Báo cáo y học: "Fine mapping of genes within the IDDM8 region in rheumatoid arthritis" pot
Bạn đang xem bản rút gọn của tài liệu. Xem và tải ngay bản đầy đủ của tài liệu tại đây (619.49 KB, 6 trang )
Open Access
Available online />Page 1 of 6
(page number not for citation purposes)
Vol 8 No 5
Research article
Fine mapping of genes within the IDDM8 region in rheumatoid
arthritis
Anne Hinks, Anne Barton, Sally John, Neil Shephard and Jane Worthington
Arthritis Research Campaign Epidemiology Unit, University of Manchester, Manchester M13 9PT, UK
Corresponding author: Anne Hinks,
Received: 26 Apr 2006 Revisions requested: 23 May 2006 Revisions received: 22 Aug 2006 Accepted: 31 Aug 2006 Published: 31 Aug 2006
Arthritis Research & Therapy 2006, 8:R145 (doi:10.1186/ar2037)
This article is online at: />© 2006 Hinks et al.; licensee BioMed Central Ltd.
This is an open access article distributed under the terms of the Creative Commons Attribution License ( />),
which permits unrestricted use, distribution, and reproduction in any medium, provided the original work is properly cited.
Abstract
The IDDM8 region on chromosome 6q27, first identified as a
susceptibility locus for type 1 diabetes, has previously been
linked and associated with rheumatoid arthritis (RA). The region
contains a number of potential candidate genes, including
programmed cell death 2 (PDCD2), the proteosome subunit
beta type 1 (PSMB1), delta-like ligand 1 (DLL-1) and TATA box-
binding protein (TBP) amongst others. The aim of this study was
to fine map the IDDM8 region on chromosome 6q27, focusing
on the genes in the region, to identify polymorphisms that may
contribute to susceptibility to RA and potentially to other
autoimmune diseases. Validated single nucleotide
polymorphisms (SNPs; n = 65) were selected from public
databases from the 330 kb region of IDDM8. These were
genotyped using Sequenom MassArray genotyping technology
in two datasets; the test dataset comprised 180 RA cases and
180 controls. We tested 50 SNPs for association with RA and
any significant associations were genotyped in a second
dataset of 174 RA cases and 192 controls, and the datasets
were combined before analysis. Association analysis was
performed by chi-square test implemented in Stata software and
linkage disequilibrium and haplotype analysis was performed
using Helix tree version 4.1. There was initial weak evidence of
association, with RA, of a number of SNPs around the
loc154449 putative gene and within the KIAA1838 gene;
however, these associations were not significant in the
combined dataset. Our study has failed to detect evidence of
association with any of the known genes mapping to the IDDM8
locus with RA.
Introduction
Rheumatoid arthritis (RA; MIM#180300) is a systemic autoim-
mune disease characterized by chronic inflammation of the
joint synovium. In common with other autoimmune diseases,
such as type 1 diabetes (T1D; MIM#222100), systemic lupus
erythematosus (SLE; MIM#152700) and autoimmune thyroid
disease, it is a complex disease caused by both genetic and
environmental factors. Various lines of evidence suggest that
some of the genetic factors may be common to a number of
autoimmune diseases. These include their shared pathophysi-
ology and also the co-occurrence of autoimmune diseases in
families. In addition, observations from meta-analyses of
autoimmune disease whole genome screens show non-ran-
dom clustering of disease susceptibility loci for a number of
human autoimmune diseases and animal models of autoimmu-
nity [1,2]. Recently convincing proof of this hypothesis has
been provided by the association of the missense single nucle-
otide polymorphism (SNP; rs2476601) in the protein tyrosine
phosphatase N22 (PTPN22) gene with at least five autoim-
mune diseases; RA [3,4], SLE [5], autoimmune thyroid dis-
ease [6], T1D [7] and juvenile idiopathic arthritis [4].
We have, therefore, hypothesized that loci identified in one
autoimmune disease are strong potential candidates in other
related conditions. Of the autoimmune diseases that cluster
within the same families as RA, T1D has been most thoroughly
investigated for genetic susceptibility loci. The T1D suscepti-
bility locus, denoted IDDM8, a region on chromosome 6q27
(Figure 1), spans approximately 200 kb and contains a number
of potential candidate genes, including programmed cell
death 2 (PDCD2), proteosome subunit beta type 1 (PSMB1),
delta-like ligand 1 (DLL-1) and TATA box-binding protein
(TBP) amongst others [8]. Interest in this region, in relation to
RA, has stemmed from our previous work that revealed
DLL-1 = Delta-like ligand 1; LD = linkage disequilibrium; PDCD2 = programmed cell death 2; PSMB1 = proteosome subunit beta type 1; PTPN22
= protein tyrosine phosphatase N22; RA = rheumatoid arthritis; RF = rheumatoid factor; SLE = systemic lupus erythematosus; SNP = single nucle-
otide polymorphism; T1D = type 1 diabetes; TBP = TATA-box binding protein.
Arthritis Research & Therapy Vol 8 No 5 Hinks et al.
Page 2 of 6
(page number not for citation purposes)
evidence for linkage and association of a microsatellite marker
(D6S446) with RA in a dataset comprising RA affected sibling
pair families and RA simplex families. An adjacent microsatel-
lite, D6S1590, has also shown evidence of linkage and asso-
ciation with RA in the same families [9].
The aim of this present study was to fine map the IDDM8
region on chromosome 6q27. We have chosen to examine a
330 kb region spanning the IDDM8 region and have focused
on the genes in this region to identify variants that may contrib-
ute to susceptibility to RA and potentially to other autoimmune
diseases.
Materials and methods
Subjects
DNA was available for an initial RA dataset comprising 180 RA
cases; these were combined with a further 174 RA cases to
give a total RA dataset of 354 RA cases for the second stage
analysis. The RA cases were obtained either from the ARC
National Repository for families with RA or from clinics within
the Greater Manchester area of Northern England. For
patients obtained through the National Repository, only one
affected case per family was selected at random for investiga-
tion. All RA cases had disease that satisfied the 1987 Ameri-
can college of Rheumatology criteria [10] modified for genetic
studies [11]. Rheumatoid factor (RF) status was ascertained
using a particle agglutination test, and a positive result was
classified as a titre of 1 in 40 or greater. Of the RA cases used
in this study, 75% were RF positive, 83% had erosive disease
and the mean age-at-onset was 44.6 ± 14.6 years. HLA-
DRB1 genotypes were determined using a commercially avail-
able semi-automated PCR-sequence specific oligonucleotide
probe typing technique (INNO-LiPA; Abbott Laboratories,
Maidenhead, UK). Of the RA cases, 16% had zero copies of
the shared epitope, 47% had one copy and 34% had 2 copies
(3% of cases not HLA typed).
The initial RA case cohort was compared with a cohort of 180
population control individuals; this was combined with a sec-
ond cohort of 192 population control individuals to give a total
control dataset of 372 controls for the second stage analysis.
Population control subjects were recruited from blood donors
and from General Practice registers.
All patients and controls were of UK Caucasoid ethnic origin,
were recruited with ethical committee approval and provided
informed consent.
SNP selection
Over the 330 kb region of IDDM8 on chromosome 6q27, fre-
quency validated SNPs were selected from public databases,
including NCBI [12] and HapMap (CEPH population) [13],
using a gene-focused approach. The genes in the region are
loc154449, loc401289, DLL1, KIAA1838, loc401290,
PSMB1, TBP and PDCD2. Information on linkage disequilib-
rium across the region was obtained from HapMap and, where
genes fell within haplotype blocks, haplotype tagging SNPs
were selected to reduce the total number of SNPs required for
genotyping. All SNPs within coding regions or with any poten-
tial function were also prioritized for genotyping. In total, 65
SNPs were selected for genotyping. Polymorphisms were
mapped to the UCSC genome browser [14] May 2004 human
reference sequence based on NCBI build 35. Details of primer
and probe sequences are available on request.
Genotyping protocol
SNPs were genotyped using Sequenom MassArray genotyp-
ing technology, according to manufacturer's instructions,
whereby the genomic sequence containing the SNP is ampli-
fied by PCR [15]. The amplified product is cleaned using
shrimp alkaline phosphatase to neutralize any unincorporated
dNTPs. This is followed by the homogeneous MassEXTEND
process. This process utilizes a primer that anneals to the
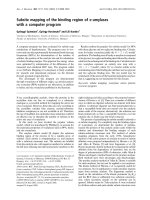
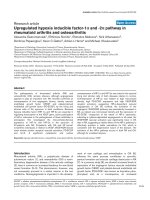
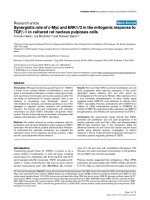
Figure 1
A schematic diagram of the IDDM8 regionA schematic diagram of the IDDM8 region. The genes are shown in blue boxes, arrows denote position of the microsatellite markers associated in
the Myerscough and colleagues study [9] and blue circles denote the single nucleotide polymorphisms.
Available online />Page 3 of 6
(page number not for citation purposes)
genomic amplification product immediately adjacent to the
SNP site and is extended to generate SNP-specified DNA
products of different length with predictable masses that can
be resolved easily by mass spectrometry. Following the Mas-
sEXTEND reaction, SpectroCLEAN resin is added to the reac-
tion mixture to remove extraneous salts that could interfere
with MALDI-TOF mass spectrometry. The reaction mixture is
then spotted onto a SpectroCHIP microarray and subjected to
the MALDI-TOF mass spectrometry. SpectroTYPER software
identifies the SNP-specific peaks according to their expected
masses and automatically assigns the genotype calls.
Statistical analysis
All SNPs were tested for Hardy-Weinberg equilibrium in cases
and controls. Association of the IDDM8 SNPs was tested
using the chi-squared test implemented in Stata (Stata, Col-
lege Station, TX, USA).
Pairwise linkage disequilibrium (LD) measures of D' and LD
correlation coefficient r
2
were calculated and plotted on a
graph. Two- and three-marker haplotypic associations using a
moving window approach were investigated using haplotype
trend regression implemented in HelixTree™ version 4.1
(Golden Helix Inc., Bozeman, Montana, USA). Haplotypes
were inferred using the expectation-maximization algorithm.
The Tagger option in the program Haploview 3.2 [16] was
used to determine how many of the SNPs in the specified
HapMap region had been successfully tagged by the SNPs
that have been genotyped.
Results
Association analysis of IDDM8 SNPs
We excluded 15 SNPs from any subsequent analyses either
because they were non-polymorphic in this study, had a call
rate of <80% or as they showed deviation from Hardy-Wein-
berg equilibrium expectations in the control population (p <
0.001). For stage 1, 50 SNPs were analyzed for association
with RA (Figure 1).
Following single marker analysis of the test dataset, one SNP
mapping close to loc154449 showed a trend towards allelic
association (rs11752069, p = 0.06) with RA and significant
genotypic association with RA (p = 0.05). A second SNP
mapping within the KIAA1838 gene was significantly associ-
ated with RA (rs910424, allelic association p = 0.012), whilst
three other SNPs in KIAA1838 showed a trend towards asso-
ciation (p < 0.1) (Table 1).
Data from the HapMap suggest there is variable LD across the
IDDM8 region. We therefore carried out two- and three-
marker haplotype analysis for SNPs across the genes using
HelixTree™ version 4.1 to see if evidence of association was
stronger in two- or three-marker haplotypes. In the stage 1
dataset, analysis using Haplotype Trend Regression in Helix
Tree™ showed evidence of association with RA of a number of
two- and three-marker haplotypes within the KIAA1838 gene
(Table 2). There was borderline significant association of a
two-marker T_T haplotype (SNPs rs910425_rs910424), and
a three-marker T_T_A haplotype (SNPs
rs910425_rs910424_rs2881062) with RA (p values of 0.07
and 0.09, respectively). We therefore went on to genotype
these SNPs, and other SNPs in the gene, in a second set of
cases and controls. Two SNPs (rs2024694) and (rs958998)
Table 1
IDDM8 single nucleotide polymorphism allele frequencies in 180 rheumatoid arthritis cases and 180 controls
SNP Gene Allele
frequencies in
RA cases
Allele
frequencies in
controls
OR (95 percent CI) P value Genotype
frequencies in RA
cases
Genotype
frequencies in
controls
P value
a
rs11752069 LOC154449 C = 0.35 (112)
G = 0.65 (204)
C = 0.29 (94)
G = 0.71 (234)
1.37 (0.98–1.9) 0.065 CC = 0.11 (17)
CG = 0.49 (78)
GG = 0.4 (63)
CC = 0.1 (17)
CG = 0.37 (60)
GG = 0.53 (87)
0.05
rs910424 KIAA1838 C = 0.63 (203)
T = 0.37 (119)
C = 0.72 (248)
T = 0.28 (96)
1.51 (1.1–2.1) 0.012 CC = 0.39 (63)
CT = 0.48 (77)
TT = 0.13 (21)
CC = 0.52 (90)
CT = 0.4 (68)
TT = 0.08 (14)
0.04
rs958997 KIAA1838 A = 0.9 (289)
C = 0.1 (31)
A = 0.86 (290)
C = 0.14 (48)
1.54 (0.96–2.5) 0.075 AA = 0.82 (131)
AC = 0.17 (27)
CC = 0.01 (2)
AA = 0.73
(124)
AC = 0.25 (42)
CC = 0.02 (3)
0.18
rs2144245 KIAA1838 C = 0.87 (245)
T = 0.13 (35)
C = 0.82 (252)
T = 0.18 (54)
1.5 (0.95–2.4) 0.083 CC = 0.76 (106)
CT = 0.24 (33)
TT = 0.007 (4)
CC = 0.67
(103)
CT = 0.3 (46)
TT = 0.03 (4)
0.18
rs1274 KIAA1838 A = 0.9 (291)
G = 0.1 (31)
A = 0.86 (299)
G = 0.14 (49)
1.54 (0.96–2.5) 0.076 AA = 0.82 (132)
AG = 0.17 (27)
GG = 0.01 (2)
AA = 0.73
(128)
AG = 0.25 (43)
GG = 0.02 (3)
0.18
a
P value calculated from chi-squared comparison of genotype frequencies in case versus controls. CI, confidence interval; OR, odds ratio; RA,
rheumatoid arthritis; SNP, single nucleotide polymorphism.
Arthritis Research & Therapy Vol 8 No 5 Hinks et al.
Page 4 of 6
(page number not for citation purposes)
showed deviation from Hardy-Weinberg equilibrium in the
combined controls and were not analyzed any further. These
were combined with the data from stage 1 for the association
analysis. In the analysis no SNPs or haplotypes were signifi-
cant at a p value < 0.05 (Table 3 and 4).
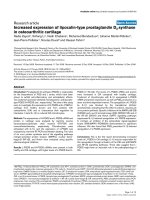
Evaluation of SNP coverage
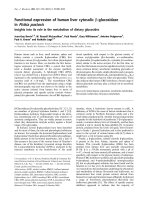
Calculations of pairwise LD between all markers examined
were performed and plotted on a graph for the total region
studied (Figure 2). A block of strong LD can be found at the
distal end of the IDDM8 region, spanning SNPs rs1474554 to
rs734249 and approximately 55 kb. The genes PSMB, TBP
and PDCD2 map within this block.
Figure 1 shows a schematic diagram of the region studied with
the 50 intragenic SNPs plotted across the chromosomal
region.
Results from Tagger (implemented in Haploview version 3.2)
suggest that, for the PSMB1-TBP-PDCD2 gene region, gen-
otyping the 11 SNPs within this region captured all of the 21
HapMap SNPs with r
2
> 0.8. For the KIAA1838 gene the 10
SNPs genotyped in this study captured 33 of the 38 HapMap
SNPs with r
2
> 0.8. For the loc401290 gene region the 3
SNPs captured all of the 9 HapMap SNPs with r
2
> 0.8. There
is, therefore, good coverage of the PSMB1-TBP-PDCD2
gene region, KIAA1838 and LOC401290. Variation across
two other gene regions was less well captured by the SNPs
we analyzed. The loc154449 gene region falls outside LD
blocks so 3 SNPs were selected to span the gene and are
located, on average, 6.8 kb apart. The DLL1 gene also falls
outside a haplotype block; therefore, SNPs spanning the gene
were selected. The seven SNPs that were used in the analysis
spanning the DLL1 gene had an average spacing of 1.4 kb.
Discussion
Linkage to the IDDM8 region on chromosome 6q27 was orig-
inally identified in the first whole genome screen in T1D [17]
and the region has also been linked to multiple sclerosis [18]
and SLE [19], supporting the hypothesis that it could harbor
polymorphisms important in autoimmunity. Linkage disequilib-
rium mapping of the region in T1D narrowed down the region
Table 2
KIAA1838 two- and three-marker haplotype analysis in 180 rheumatoid arthritis cases and 180 controls
Associated haplotype Haplotype frequency in cases
(percentage)
Haplotype frequency in controls
(percentage)
Haplotype chi-square
(P value
a
)
Two-marker haplotype
rs910425_rs910424 T_T 36.4 28.0 3.26 (p = 0.07)
rs2024694_rs910425 G_T 40.9 34.1 2.0 (p = 0.16)
Three-marker haplotype
rs2024694_rs910425_rs910424 G_T_T 32.7 25.6 2.27 (p = 0.13)
rs910425_rs910424_rs2881062 T_T_A 36.4 28.1 2.85 (p = 0.09)
a
P value calculated from chi-squared comparison of haplotype frequencies in case versus controls.
Table 3
IDDM8 single nucleotide polymorphism allele frequencies in 354 rheumatoid arthritis cases and 372 controls
SNP Gene Allele
frequencies in
RA cases
Allele
frequencies in
controls
OR (95 percent CI) P value Genotype
frequencies in RA
cases
Genotype
frequencies in
controls
P value
a
rs11752069 LOC154449 C = 0.32 (190)
G = 0.68 (404)
C = 0.31 (215)
G = 0.69 (479)
1.07 (0.84–1.4) 0.57 CC = 0.09 (28)
CG = 0.45 (134)
GG = 0.46 (135)
CC = 0.1 (36)
CG = 0.40 (140)
GG = 0.49 (171)
0.47
rs910424 KIAA1838 C = 0.67 (419)
T = 0.33 (207)
C = 0.70 (493)
T = 0.30 (211)
1.13 (0.89–1.4) 0.3 CC = 0.44 (139)
CT = 0.45 (141)
TT = 0.11 (33)
CC = 0.49 (173)
CT = 0.41 (144)
TT = 0.10 (35)
0.47
rs958997 KIAA1838 A = 0.90 (553)
C = 0.10 (61)
A = 0.87 (606)
C = 0.13 (90)
1.29 (0.9–1.86) 0.13 AA = 0.81 (249)
AC = 0.17 (53)
CC = 0.02 (5)
AA = 0.76 (263)
AC = 0.23 (80)
CC = 0.01 (5)
0.19
rs2144245 KIAA1838 C = 0.88 (514)
T = 0.12 (70)
C = 0.86 (585)
T = 0.14 (95)
1.24 (0.87–1.7) 0.21 CC = 0.78 (229)
CT = 0.20 (59)
TT = 0.02 (4)
CC = 0.74 (252)
CT = 0.24 (82)
TT = 0.02 (6)
0.18
rs1274
a
KIAA1838 A = 0.9 (291)
G = 0.1 (31)
A = 0.86 (299)
G = 0.14 (49)
1.54 (0.96–2.5) 0.076 AA = 0.82 (132)
AG = 0.17 (27)
GG = 0.01 (2)
AA = 0.73 (128)
AG = 0.25 (43)
GG = 0.02 (3)
0.18
a
P value calculated from chi-squared comparison of genotype frequencies in case versus controls. CI, confidence interval; OR, odds ratio; RA,
rheumatoid arthritis; SNP, single nucleotide polymorphism.
Available online />Page 5 of 6
(page number not for citation purposes)
to the terminal 200 kb of chromosome 6q spanning the
PDCD2-TBP-PSMB1 gene complex [8]. Previous
investigation of the region in RA found evidence of linkage and
association to two microsatellite markers (D6S446 and
D6S1590) [9].
In this study we have taken a SNP-based association mapping
approach and selected a large number of SNPs spanning the
known genes in this region. Despite initial weak evidence of
association with RA of a number of SNPs around the
loc154449 putative gene and within the KIAA1838 gene,
there was no evidence of association with RA in the combined
dataset and we conclude that there is no evidence to support
association of polymorphisms in these genes with RA.
Information on LD across the region was obtained from the
HapMap. Results from the software program Tagger suggest
that the SNPs selected within the PDCD2-TBP-PSMB1 gene
region and the loc401289 gene region capture all the Hap-
Map SNPs within these regions, suggesting that adequate
coverage of the region was achieved with the SNPs analyzed
in this study.
The PDCD2-TBP-PSMB1 gene region was initially high-
lighted in the T1D study as likely to contain the susceptibility
gene [8]. A recent study of the IDDM8 region in T1D, how-
ever, found no evidence of association, although they could
not completely rule out the possibility that the putative IDDM8
locus exists elsewhere in this chromosomal region [20]. Other
genes in the IDDM8 region include the KIAA1838 gene and,
although the 10 SNPs within this gene captured 33 out of 38
SNPs identified on the HapMap, there is a possibility that var-
iation across the region has not been completely captured and
further SNPs would need to be genotyped before this locus
can be confidently excluded for modest effect sizes.
Another possible reason for the failure to identify a susceptibil-
ity region in the study could be heterogeneity between the
dataset used in this study and the dataset used in the previous
analysis [9]. However, half of the cases used in this study were
Figure 2
Linkage disequilibrium plot of the IDDM8 region in controlsLinkage disequilibrium plot of the IDDM8 region in controls. The plot shows both linkage disequilibrium correlation and D' as measures of linkage
disequilibrium across the IDDM8 region.
Table 4
KIAA1838 two- and three-marker haplotype analysis in 354 rheumatoid arthritis cases and 372 controls
Associated haplotype Haplotype frequency in cases
(percentage)
Haplotype frequency in
controls (percentage)
Haplotype chi-square (P value
a
)
Two-marker haplotype
rs910425_rs910424 T_T 32.8 30.5 0.48 (p = 0.48)
Three-marker haplotype
rs910425_rs910424_rs2881062 T_T_A 32.8 30.6 0.38 (p = 0.54)
a
P value calculated from chi-squared comparison of haplotype frequencies in case versus controls.
Arthritis Research & Therapy Vol 8 No 5 Hinks et al.
Page 6 of 6
(page number not for citation purposes)
probands from the National Repository of RA cases that had
been used in the previous study and there were no differences
in gender (p = 0.06) or severity of disease (as denoted by
number of erosions; p = 0.55). However, there was a signifi-
cant difference in RF status between the two subgroups (p =
0.03); of the RA probands 86% had RF whilst the dataset
used in this study had 76%.
The total dataset analyzed in this study (354 cases and 372
controls) had the power to detect an effect size or odds ratio
greater than 1.6; therefore, if the IDDM8 region conferred a
risk similar to that of PTPN22 in RA (odds ratio = 1.8), then we
would have had 80% power to detect it (p = 0.05). However,
for smaller effect sizes, such as that of CTLA4 in T1D (odds
ratio = 1.14) then our study would have been underpowered.
Our study has failed to detect evidence of association with any
of the known genes mapping to the IDDM8 locus, a region we
had identified as a candidate autoimmune locus common to
RA, T1D and SLE. It is possible that the limits of the region
defined by earlier T1D studies have, in fact, failed to encom-
pass the RA susceptibility gene that gave rise to evidence of
linkage and association to microsatellite markers in our initial
study, and future studies would need to focus on genes adja-
cent to those investigated here.
Conclusion
Our study has failed to detect evidence of association with any
of the known genes mapping to the IDDM8 locus with RA.
Competing interests
The authors declare that they have no competing interests.
Authors' contributions
AH planned the work, carried out all the laboratory work, the
statistical analysis and also helped draft the manuscript. AB
participated in the study design and helped to draft the manu-
script. SJ participated in the study design and statistical
analysis. NS participated in statistical analysis. JW participi-
tated in the study design and helped draft the manuscript. All
authors read and approved the final manuscript.
Acknowledgements
This work was funded by the arthritis research campaign. Anne Barton
is in receipt of a Wellcome Trust Advanced Fellowship.
References
1. Vyse TJ, Todd JA: Genetic analysis of autoimmune disease.
Cell 1996, 85:311-318.
2. Becker KG, Simon RM, Bailey-Wilson JE, Freidlin B, Biddison WE,
McFarland HF, Trent JM: Clustering of non-major histocompat-
ibility complex susceptibility candidate loci in human autoim-
mune diseases. Proc Natl Acad Sci USA 1998, 95:9979-9984.
3. Begovich AB, Carlton VE, Honigberg LA, Schrodi SJ, Chokkalin-
gam AP, Alexander HC, Ardlie KG, Huang Q, Smith AM, Spoerke
JM, et al.: A missense single-nucleotide polymorphism in a
gene encoding a protein tyrosine phosphatase (PTPN22) is
associated with rheumatoid arthritis. Am J Hum Genet 2004,
75:330-337.
4. Hinks A, Barton A, John S, Bruce I, Hawkins C, Griffiths CE, Donn
R, Thomson W, Silman A, Worthington J: Association between
the PTPN22 gene and rheumatoid arthritis and juvenile idio-
pathic arthritis in a UK population: Further support that
PTPN22 is an autoimmunity gene. Arthritis Rheum 2005,
52:1694-1699.
5. Kyogoku C, Langefeld CD, Ortmann WA, Lee A, Selby S, Carlton
VE, Chang M, Ramos P, Baechler EC, Batliwalla FM, et al.:
Genetic association of the R620W polymorphism of protein
tyrosine phosphatase PTPN22 with human SLE. Am J Hum
Genet 2004, 75:504-507.
6. Velaga MR, Wilson V, Jennings CE, Owen CJ, Herington S, Don-
aldson PT, Ball SG, James RA, Quinton R, Perros P, et al.: The
codon 620 tryptophan allele of the lymphoid tyrosine phos-
phatase (LYP) gene is a major determinant of Graves' disease.
J Clin Endocrinol Metab 2004, 89:5862-5865.
7. Bottini N, Musumeci L, Alonso A, Rahmouni S, Nika K, Rostam-
khani M, MacMurray J, Meloni GF, Lucarelli P, Pellecchia M, et al.:
A functional variant of lymphoid tyrosine phosphatase is asso-
ciated with type I diabetes. Nat Genet 2004, 36:337-338.
8. Owerbach D: Physical and genetic mapping of IDDM8 on chro-
mosome 6q27. Diabetes 2000, 49:508-512.
9. Myerscough A, John S, Barrett JH, Ollier WE, Worthington J: Link-
age of rheumatoid arthritis to insulin-dependent diabetes mel-
litus loci: evidence supporting a hypothesis for the existence
of common autoimmune susceptibility loci. Arthritis Rheum
2000, 43:2771-2775.
10. Arnett FC, Edworthy SM, Bloch DA, McShane DJ, Fries JF, Cooper
NS, Healey LA, Kaplan SR, Liang MH, Luthra HS, et al.: The Amer-
ican Rheumatism Association 1987 revised criteria for the
classification of rheumatoid arthritis. Arthritis Rheum 1988,
31:315-324.
11. MacGregor AJ, Bamber S, Silman AJ: A comparison of the per-
formance of different methods of disease classification for
rheumatoid arthritis. Results of an analysis from a nationwide
twin study. J Rheumatol 1994, 21:1420-1426.
12. The National Centre for Biotechnology Information [http://
www.ncbi.nlm.nih.gov/]
13. The HapMap [ />]
14. UCSC Genome Bioinformatics site [http://
genome.cse.ucsc.edu/]
15. Sequenom [ />high_performance_genotyping.php]
16. Haploview [ />]
17. Davies JL, Kawaguchi Y, Bennett ST, Copeman JB, Cordell HJ,
Pritchard LE, Reed PW, Gough SCL, Jenkins SC, Palmer SM, et
al.: A genome-wide search for human type-1 diabetes suscep-
tibility genes. Nature 1994, 371:130-136.
18. Haines JL, Ter Minassian M, Bazyk A, Gusella JF, Kim DJ, Ter-
wedow H, Pericak-Vance MA, Rimmler JB, Haynes CS, Roses AD,
et al.: A complete genomic screen for multiple sclerosis under-
scores a role for the major histocompatability complex. The
Multiple Sclerosis Genetics Group. Nat Genet 1996,
13:469-471.
19. Moser KL, Neas BR, Salmon JE, Yu H, Gray-McGuire C, Asundi N,
Bruner GR, Fox J, Kelly J, Henshall S, et al.: Genome scan of
human systemic lupus erythematosus: evidence for linkage
on chromosome 1q in African-American pedigrees. Proc Natl
Acad Sci USA 1998, 95:14869-14874.
20. Payne F, Smyth DJ, Pask R, Cooper JD, Masters J, Wang WY,
Godfrey LM, Bowden G, Szeszko J, Smink LJ, et al.: No evidence
for association of the TATA-box binding protein glutamine
repeat sequence or the flanking chromosome 6q27 region
with type 1 diabetes. Biochem Biophys Res Commun 2005,
331:435-441.