Báo cáo khoa học: "SemiFDG-PET/CT imaging for staging and target volume delineation in conformal radiotherapy of anal carcinoma" potx
Bạn đang xem bản rút gọn của tài liệu. Xem và tải ngay bản đầy đủ của tài liệu tại đây (497.19 KB, 7 trang )
RESEARC H Open Access
FDG-PET/CT imaging for staging and target
volume delineation in conformal radiotherapy of
anal carcinoma
Marco Krengli
1,2*
, Maria E Milia
1
, Lucia Turri
1
, Eleonora Mones
3
, Maria C Bassi
1
, Barbara Cannillo
3
,
Letizia Deantonio
1
, Gianmauro Sacchetti
4
, Marco Brambilla
3
, Eugenio Inglese
4
Abstract
Background: FDG-PET/CT imaging has an emerging role in staging and treatment planning of various tumor
locations and a number of literature studies show that also the carcinoma of the anal canal may benefit from this
diagnostic approach. We analyzed the potential impact of FDG-PET/CT in stage definition and target volum e
delineation of patients affected by carcinoma of the anal canal and candidates for curative radiotherapy.
Methods: Twenty seven patients with biopsy proven anal carcinoma were enrolled. Pathology was squamous cell
carcinoma in 20 cases, cloacogenic carcinoma in 3, adenocarcinoma in 2, and basal cell carcinoma in 2. Simulation
was performed by PET/CT imaging with patient in treatment position. Gross Tumor Volume (GTV) and Clinical
Target Volume (CTV) were drawn on CT and on PET/CT fused images. PET-GTV and PET-CTV were respectively
compared to CT-GTV and CT-CTV by Wilcoxon rank test for paired data.
Results: PET/CT fused images led to change the stage in 5/27 cases (18.5%): 3 cases from N0 to N2 and 2 from
M0 to M1 leading to change the treatment intent from curative to palliative in a case.
Based on PET/CT imaging, GTV and CTV contours changed in 15/27 (55.6%) and in 10/27 cases (37.0%) respectively.
PET-GTV and PET-CTV resulted significantly smaller than CT-GTV (p = 1.2 × 10
-4
) and CT-CTV (p = 2.9 × 10
-4
). PET/
CT-GTV and PET/CT-CTV, that were used for clinical purposes, were significantly greater than CT-GTV (p = 6 × 10
-5
)
and CT-CTV (p = 6 × 10
-5
).
Conclusions: FDG-PET/CT has a potential relevant impact in staging and target volume delineation of the
carcinoma of the anal canal. Clinical stage variation occurred in 18.5% of cases with change of treatment intent in
3.7%. The GTV and the CTV changed in shape and in size based on PET/CT imaging.
Background
Carcinoma of the anal canal has shown an increasing
incidence over the last decades accounting for approxi-
mately 0.5-1 new case per year every 100,000 inhabitants
in Western countries [1,2]. The treatment approach
moved from an extensive surgical approach consisting
of abdominal-perineal resection to a conservative
chemo-radiation regimen proposed firstly by Nigro et al.
who reported high response and survival rates after a
combination of radiotherapy and chemotherapy [3]. The
efficacy of such an approach was confirmed by phase III
trials [4,5]. Multivariate analysis showed that the two
most significant prognostic factors are tumor size and
nodal status related to the TNM stage [6]. Conse-
quently, the efficacy of treatment relies on accurate sta-
ging of the primary tumor and the regional lymph
nodes [7]. Moreover, the precise identification of the
radiotherapy treatment volume plays a crucial role in
order to avoid geographic miss and appropriately boost
nodal disease [8].
(18)F-fluorodeoxyglucose positron emission tomogra-
phy fused with computed tomography (FDG -PET/CT)
imaging has an emerging role in staging and treatment
planning of various tumor locations and a number of lit-
erature studies show that also the ca rcinoma of the anal
* Correspondence:
1
Department of Radiotherapy, University Hospital Maggiore della Carità,
Novara, Italy
Krengli et al. Radiation Oncology 2010, 5:10
/>© 2010 Krengli et al; licensee BioMed Central Ltd. This is an Open Access article distributed under the terms of the Creative Common s
Attribution License ( which permits unrestricted use, distribution, and reproduction in
any medium, provided the original work is properly cited.
canal may benefit from this diagnostic approach
[6,9-13].
The present prospective study aims to analyze the
potential impact of FDG-PET/CT in staging and target
volume delineation of patients affected by carcinoma of
the anal canal and candidates for curative radiotherapy
combined with concomitant chemotherapy.
Methods
Patients
From January 2005 to May 2008, 27 patients, 9 males
and 18 females, aged from 36 to 90 years (mean and
median 66 years), performance status of 80-100 (med-
ian 90) according to Karnofsky scale with biopsy p ro-
ven anal carcinoma, were enrolled in the present study
after obtaining info rmed consent following the rules of
our institution. Pathology was squamous cell carci-
noma in 20 cases, cloacogenic carcinoma in 3, adeno-
carcinoma in 2 , and basa l cell carcinoma in 2. Tumor
was confined in the anal canal in 10 cases, extended to
the lower rectum in 3 cases, to the anal margin in 8
cases and to both these areas in 6 cases. Baseline
work-up included physical examination, blood count,
renal and liver function tests, endoscopy, CT-scan with
contrast of the upper and lower abdomen, and chest
X-rays. One patient was HIV positive. The main
patient characteristics are reported in Table 1. All
cases were discussed in a multidisciplinary conference
with surgeons, radiation oncologists, and medical
oncologists.
PET/CT simulation
Simulation was performed by PET/CT hybrid scanner
(Biograph 16 HI-REZ, Siemens, Hoffman Estates, IL)
with patient in supine position with knee-ankle
positioning device to improve the reproducibility at each
treatment session. The CT scanner was used both for
attenuation correction of PET data and for localization
of FDG uptake in PET images. All patients were advised
to fast for at least 8 hours prior to PET/CT examina-
tion. Aft er injection of 5.18 MBq of FDG per kg of body
weight, patients were rested for a p eriod of about 60
minutes in a comfortable chair. Emission images ranging
from the proximal femur to the base of the skull were
acquired for 3-4 minutes per bed position. Field of view
was of 50 cm w ith a matrix of 512 × 5 12 pixels for CT
and of 128 × 128 for PET. The processed images were
displayed in coronal, transverse, and sagittal pla ns. After
image acquisition, PET/CT data sets were sent to t he
treatment planning system Pinnacle (Philips, ADAC
Laboratories, Milpitas, CA) through local network.
Target volume delineation
Treatment volumes including GTV, CTV, and organs at
risk (blad der and femoral heads) were drawn on CT and
then on PET/CT fused images by the same radiation
oncolo gist with a specific experience in the treatment of
gastro-intestinal tract tumors. In particular, the GTV
was drawn manually on CT and semi-automatically on
PET images. For delineating the PET/CT-GTV and the
PET/CT-CTV, the operator considered both CT and
PET information outlining the v olume identified by one
or by both imaging modalities. The CTV was drawn
manually on CT and on PET/CT images t aking into
account respectively the CT-GTV and PET/CT-GTV
contours. The GTV included the primary tumor exten-
sion and the involved lymph n odes. The CTV sur-
rounded the GTV with margins of at least 1.5 cm at the
level of the primary tumor and i ncluded the uninvolved
regional lymph nodal areas, i. e. bilateral inguinal, exter-
nal and internal iliac, perirectal, and presacral lymph
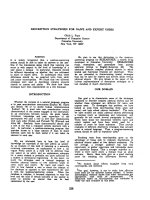
nodes (Figure 1).
Lymph nodes were considered positive at CT-scan
when greater than 15 mm in diameter or when contain-
ing areas of necrosis. A focus was considered po sitive at
PET when the activity was significantly above the
expected background and could not be explained by a
normal structure. For delineation on PET/CT images, a
fixed threshol d value of 40% of the maximum uptake i n
the lesion (whichever primary tumor, liver metastasis or
lymph node) was chosen as described in a previous arti-
cle on the use of PET/CT in rectal cancer [14]. For
treatment purposes, PTV was obtained by 10 mm sym-
metric expansion of CTV taking into account setup
uncertainties and organ motion. The GTV with sym-
metric expansion of 10 mm was used as a volume for
boosting macroscopic disease.
A 3-dimension conformal treatment plan was per-
formed to a total dose of 54.0-65.0 Gy (median 59.4
Table 1 Main patient characteristics.
Total number 27
Gender 18 females
9 males
Median age 66 (range 36-90)
Median Karnofsky performance status 90 (range 80-100)
Clinical stage
(baseline work-up with CT alone)
2T1N0M0
4T2N0M0
9T3N0M0
2T1N1M0
4T2N2M0
2T3N2M0
1T4N2M0
1T3N3M0
1T4N3M0
1T3N2M1
Krengli et al. Radiation Oncology 2010, 5:10
/>Page 2 of 7
Gy) to the macroscopic disease and to 45.0 Gy to the
potentially microscopically invaded regions with con-
ventional daily fractionation of 1.8-2.0 Gy by using 6-
15 MV photons for curative treatments. The case trea-
ted with palliative intent was irradiated to a total dose
of 35.0 Gy with daily fractionation of 2.5 Gy. Concomi-
tant chemotherapy was given by cisplatin and 5-fluor-
ouracil in 15 cases and mytomicin and 5-fluorouracil
in 8 cases.
Statistical analysis
PET-GTV and PET-CTV were respectively compared to
CT-GTV and CT-CTV by Wilcoxon rank test for paired
data. A P-value < 0.05 was considered to be statistically
significant. Data were reported as mean ± standard
deviation and 95% confidence interval (CI) or as experi-
mental percentage with 95% CI, calculated using the
binomial distribution.
The following additiona l volumes were consid ered for
the mismatch analysis:
- the volume identified by PET but not by CT
(PEToutCT),
- the volume identified by CT but not by PET
(CToutPET),
- the common volume of CT and PET (CT&PET).
Results
The average tumor-to-background ratio in the examined
lesions was 22.0 ± 10.5. Using a 40% fixed isoactivity
level of the signal maximum of the tum or, liver lesion
or suspicious node, the resulting activity level was
always above the background activity.
PET images showed extensive FDG tumor uptake in
all but one case of squamous cell carcinoma T3N0 M0
in which the accumulation of the radiotracer was limited
to a small portion of the tumor mass detectable by clini-
cal examination a nd CT. PET/CT fused images le d to
change the stage in 5/27 cases (18.5%; CI: 6.2% - 37.0%).
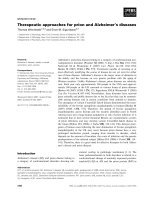
Three of these changes were related to the lymph node
stage that changed from N0 to N2 (Figure 2) and two to
the detection of liver lesions showing FDG uptake at
PET (Table 2). In the three cases presenting with FDG
uptake in inguinal nodes, a fine-needle ago-biopsy
(FNAB) confirmed the presence of tumor cells. The
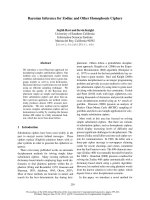
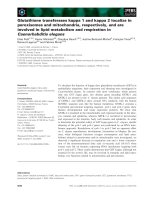
Figure 1 PET/CT image in axial view of a T3N2 case. Different colours are used to highlight the contours of the treatment volumes: CT-GTV
(blue), PET-GTV (red), PET/CT-GTV (purple), CT-CTV (light blue), and PET/CT-CTV (yellow). The PET/CT GTV and the PET/CT-CTV were used for
treatment purposes.
Krengli et al. Radiation Oncology 2010, 5:10
/>Page 3 of 7
detection of liver lesions was confirmed by contrast CT
and MRI scans. The case with multiple lesions in the
liver was treated with palliative radiotherapy followed by
chemotherapy whereas the other case presenting with a
single FDG uptake lesion received combined radio-che-
motherapy as the other cases treated by curative intent.
After radio-chemotherapy, this patients underwent sur-
gical resection of the remaining liver lesion that con-
firmed the finding of metastasis.
PET/CT led to change GTV and CTV contours in 15/
27 (55.6%; CI: 34.8 - 74.3) and in 10/27 cases (37.0%;
CI: 19.0 - 57.6) cases respec tively. In particular, changes
in GTV contours occurred in 12/15 (80%; CI: 53.0 -
95.7) cases staged T3-T4 and in 3/12 (25%; CI: 5.5 -
56.1) cases staged T1-T2. As far as the volume size, the
analysis by Wilcoxon rank test showed PET-GTV and
PET-CTV to be significantly smaller than CT-GTV (p =
1.2 × 10
-4
) and CT-CTV (p = 2.9 × 10
-4
) respectively.
PET/CT-GTV and PET/CT-CTV, that were used for
clinical purposes, were significantly greater than CT-
GTV (p = 6 × 10
-5
)andCT-CTV(p=6×10
-5
). The
mean difference GTV (9.2 ± 12.8 cc; 95% CI: 4.2 - 14.3
cc) amounted to an average 11.1% of the CT-GTV
volume. This difference was in proportion higher than
the corresponding mean difference between PET/CT-
CTV and CT-CTV (50.3 ± 26.6 cc; 95% CI: 3 9.7 - 60 .8
cc) which amounted, on average, to 5.1% of the CT-
CTV volume. The analyzed volumes for all patients are
reported in Table 3. The mean and range values of the
additional volumes analyzed to compare PET/CT and
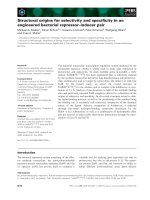
Figure 2 (a – b) CT (a) and PET/CT (b) in axial view showing a lymph node of about 1 cm in diameter with intense uptake at PET
(arrows). Positivity was confirmed by FNAB. Based on these finding, this lymph node was included in the GTV and received a boost of radiation
dose.
Table 2 Change of clinical stage by positron emission
tomography/computed tomography PET/CT findings.
Pre-PET
TNM
Post-PET
TNM
Tumor sites
T3N0 M0 T3N2 M0 Inguinal lymph node *
T3N0 M0 T3N2 M0 Inguinal * and external iliac lymph nodes
T3N0 M0 T3N2 M0 Inguinal *, external iliac, and perirectal
lymph nodes
T3N0 M0 T3N0 M1 Multiple liver metastases
T3N3 M0 T3N3 M1 Single liver metastasis
* confirmed by fine-needle ago-biopsy (FNAB)
Krengli et al. Radiation Oncology 2010, 5:10
/>Page 4 of 7
CT alone are reported in Table 4. In particular, the
mean PEToutCT volume was 10.6% of the mean CT-
GTV.
After median f ollow-up of 18 months (range 3 - 42
months), loco-regional control was obtained in 18/27
(66.7%) cases and disease-free an d overall survival (DFS
and OS) rates were 66.7% and 77.8% respectively. Acute
and late toxicity higher than grade 2 (RTOG/EORTC)
was observed in 7/27 (25.9%) and 1/ 27 (3.7%) patients
respectively.
Discussion
The present study, like others reported in the litera-
ture, analyzed the potential impact of PET/CT images
on tumor staging and treatment strategy and is one
of the first reports examining quantitatively how t he
GTV and the CTV for radiotherapy treatment plan-
ning may change in relation with the use of func-
tional imaging.
As a matter of fact, a number of recent literature stu-
dies tried to show that the addiction of PET and PET/
CTmaybeabletoaddusefulinformationforthe
carcinoma of the anal canal. Most of theses s tudies
focused on disease staging with special regard to nodal
spread whereas relative ly few of them tried to analyze
the impact of PET/CT on radiotherapy treatment plans.
Trautmann et al. reported that pre-treatment PET, in a
series of 21 patients candidates for radiotherapy and
chemotherapy, changed disease staging in 24% of cases
in relation to lymph nodal, omental, and liver metastases
[9]. Cotter et al. analyzing 41 patients affected by anal
carcinoma, observed that FDG-PET/CT detecte d abnor-
mal nodes in 20% of groins with normal CT appearing
leading to upstage 25% of patients [10]. Conversely 23%
of CT-positive lymph nodes were PET negative. Notably,
PET was positive in 17% of cases negative both at CT
and phy sical examination. More recently, Nguyen et al.
found that PET upstaged 17% of patients with unsus-
pected pelvic/inguinal nodal disease [6]. Another study
on 61 patients by Winton et al. reported a change in
tumor stage in 23% of cases as a result of P ET/CT ima-
ging with 15% of upstaging and 8% of downstaging [ 13].
The same authors observed a change in treatme nt strat-
egy in 3% of patients.
Table 3 Volumes (cc) identified by CT and PET in every single case.
Patients CT-GTV PET-GTV PET/CT-GTV CT-CTV PET/CT-CTV
1 118.1 31.3 120.1 1003.8 1044.4
2 102.4 62.2 121.8 1154.4 1226.6
3 117.6 54.3 128.8 827.3 872.1
4 46.0 33.6 46.2 852.0 889.8
5 358.4 312.1 373.2 1334.0 1370.9
6 45.1 29.1 48.2 907.5 938.1
7 88.9 53.0 90.7 1266.2 1277.7
8 57.9 24.4 74.3 1077.9 1138.8
9 107.4 101.5 141.5 1038.7 1066.6
10 72.9 27.5 73.9 792.6 815.7
11 129.8 27.7 132.4 998.1 1034.2
12 31.7 9.6 32.1 685.3 711.4
13 24.5 17.8 31.3 1007.6 1046.8
14 161.3 175.8 218.2 1034.3 1146.3
15 206.1 84.5 222.1 1040.3 1121.5
16 56.8 27.8 68.9 859.3 910.9
17 82.4 21.3 82.4 812.2 847.4
18 56.7 16.9 59.9 1003.4 1040.8
19 86.6 81.7 108.2 1310.1 1380.5
20 38.4 36.1 47.9 996.5 1100.1
21 75.7 32.0 76.1 1119.1 1152.8
22 85.6 38.3 93.9 958.6 1044.2
23 42.8 11.9 43.4 1266.6 1335.6
24 27.7 12.1 28.2 854.7 919.2
25 74.0 46.9 76.5 960.8 977.1
26 13.6 13.3 17.1 734.1 760.2
27 28.0 7.1 28.1 883.8 966.1
Mean ± SD 86.5 ± 70.2 51.5 ± 63.2 95.7 ± 76.2 991.8 ± 171.2 1042.1 ± 178.1
Krengli et al. Radiation Oncology 2010, 5:10
/>Page 5 of 7
In the present series, we observed similar data with
change in staging of 18.5% and in treatment strategy of
3.7% of cases. As reported in other studies, most
changes were found at the level of the lymph nodes,
typically in the inguinal regions even with node dia-
meter < 1.5 c m (Figure 1). In the present study, we did
not observe any downstaging of the disease possibly
related to case selection of our series. As far as the pri-
mary lesion, a case of squamous cell carcinoma showed
FDG uptake only in a part of the tumor mass detected
by CT and clinical examination. This finding could be
related to a relatively low metabolism of the tumor cells
of the PET-negative component of the lesion.
The impact of PET/CT imaging on treatment plan-
ning was analyze d only by few authors without specific
quantitative analysis of the treatment volumes. Ander-
son et al. in a series of 20 anorectal tumors found that
PTV changed, based on PET data, in 1/3 patients and
Nguye n et al. observed a significant change of the treat-
ment plan in 19% of cases because the upstage of regio-
nal lymph nodes [6, 11]. More recently, Winton et al.
reported a modification of radiotherapy fields in 13% of
patients after PET/CT imaging [13].
In our series, the GTVs and the CTVs detected by CT
alone and by PET/CT images were analyzed in details
and compared. The contours outlined on PET/CT ima-
ging were substantially different from those outlined on
CT alone, more frequently for the GTV (55.6%) than for
the CTV (37.0%). This findings may be related to the
different shape of GTV detected by the two diagnostic
modalities and strongly influenced by PET uptake and
to the relatively constant shape of CTV, i.e. the potential
microscopic tumor extension, typically defined by regio-
nal ana tomical landmarks on CT imaging and less influ-
enced by PET imaging. These changes were more
evident for the T3-T4 cases (80% of changes) where C T
images may be unable to clearly detect the tumor exten-
sion in relation with the close proximity o f muscle
structures especially at the lev el of the perineum. As a
matter of fact, CT i mages may overestimate tumor
volume in low rectal cancer as observed by O’Neill et al.
who compared MR versus CT imaging [15].
PET/CT imaging influenced also the size of the treat-
ment volumes: more that of the GTV than that of the
CTV. In particular, the GTV defined by FDG-PET
uptake (PET-GTV) w as significantly smaller than the
GTV detected by CT alone (CT-GT V) despite a number
of lymph nodes detected only by FDG-PET. This differ-
ence in size may be related to at least two different fac-
tors: on one side, CT images may include not only the
metabolically active tumor but probably also other
tumor components and possibly tissue alteration s sur-
rounding the tumor itself; on the other side, PET images
may be able to highlight the metabolically active aspect
of the tumor but not the necrotic or slow growing
tumor components. The volume used for treatment pur-
poses, i.e. the PET/CT-GTV, was significantly greater
than the CT-GTV meaning that PET uptake may extend
also beyond the tumor volume visible on CT images.
This information could lead to reduce the risk of geo-
graphic miss at the periphery of the tumor. Similarly,
the PET/CT-CTV was larger than the CT-CTV in r ela-
tion to the margin around the tumor extension and the
additional lymph nodes detected by PET. This difference
was evident but less pronounced than tha t between
PET/CT-GTV and CT-GTV because the CTV is related
to the concept of treating the microscopic disease unde-
tectable by imaging modalities.
The present study has some limitations. One is repre-
sented by the reliability of PET uptake in detecting
tumor tissue considering that data about sensitivity in
particular at the level of the regio nal lymph nodes is
quite high (67-100%) but the specificity cannot be ascer-
tain because of the lack of complete pathology surgical
data correlated with PET findings [13,16]. In our experi-
ence, we performed FNAB a t the level of the inguinal
nodes b ut we did no t have pathology data on the other
tumor components. Another issue is related to the
interpretation of PET uptake in terms of threshold value
to determine the real size of a positive lesion. In this
regard, we adopted the fixed threshold of 40% suggested
also by other au thors and a lready used in a previous
study about rectal cancer, though the determination of
the m ost appropriate method for contouring PET
images is still under investigation [14,17-19]. However,
the very high average tumor-to-background ratio mea-
sured in our sample renders unlikely a significant
change in PET volumes using adaptive threshold algo-
rithms, which usually reach a plateau of about 40% in
this range of tumor-to-background.
Data in terms of loco-regional contro l and toxicity do
not substantially diffe r from others reported in the lit-
erature but follow-up time is too short to make any
consideration about DFS and OS [2,5,6,13].
Conclusions
The present study showed that FDG-PET/CT imaging
has a potential relevant impact in staging and target
volume delineation of t he carcinoma of the anal canal.
Table 4 Volumes (cc) identified after fusion of PET and
CT images.
Volumes Mean Range Confidence Interval
PET/CT-GTV 95.7 17.1-373.2 65.5 - 125.8
PEToutCT 9.2 0.0-56.9 4.3 - 14.1
CToutPET 44.3 3.8-137.5 32.2 - 56.4
CT&PET 42.3 6.9-297.3 20.0 - 64.6
Krengli et al. Radiation Oncology 2010, 5:10
/>Page 6 of 7
Clinical stage variation was observed in 18.5% of cases
with change of treatment intent in 3.7%. GTV and CTV
contours changed in 55.6% and 37.0% of cases respec-
tively. PET/CT-GTV and PET/CT-CTV, that were used
for clinical purposes, were signi ficantly greater than CT-
GTV and CT-CTV. These variations in treatment
volumes may become very relevant when using highly
conformal techniqu es like intensity modulated radiation
therapy or particle therapy.
Abbreviations
FDG-PET/CT: (18)F-fluorodeoxyglucose positron emission tomography fused
with computed tomography; HIV: Human Immunodeficiency Virus; MBq:
Mega Becquerel; GTV: Gross Tumor Volume; CTV: Clinical Target Volume; PTV:
Planning Target Volume; CI: Confidence Interval; FNAB: Fine Needle Ago
Biopsy; SUV: Standard Uptake Value.
Acknowledgements
This project was supported by a grant from the Department of Clinical and
Experimental Medicine of the University of “Piemonte Orientale”, Italy and
was presented at the 49th Annual Meeting of the American Society for
Therapeutic Radiology and Oncology (ASTRO), September, 21-25, 2008,
Boston, MA.
Author details
1
Department of Radiotherapy, University Hospital Maggiore della Carità,
Novara, Italy.
2
Department of Clinical and Experimental Medicine and
Biotechnology Centre for Applied Medical Research, University of Piemonte
Orientale, Novara, Italy.
3
Medical Physics, University Hospital Maggiore della
Carità, Novara, Italy.
4
Nuclear Medicine, University Hospital Maggiore della
Carità, Novara, Italy.
Authors’ contributions
MK was the study coordinator, participated in the development of the study
and drafted the manuscript. MEM, LT, CB and LD were involved in data
collection and review. EM, BC and MC worked on analysis of data. EI and MB
participated in the design of the study and contributed to write the
manuscript. All authors read and approved the final manuscript.
Competing interests
The authors declare that they have no competing interests.
Received: 19 November 2009
Accepted: 6 February 2010 Published: 6 February 2010
References
1. Parkin DM, Whelan SL, Ferlay J, Teppo L, Thomas DB: Cancer incidence in
five continents. IARC Scientific Publication No. 155, Lyons: International
Agency for Research on Cancer 2002, VIII.
2. Johnson LG, Madeleine MM, Newcomer LM, Schwartz SM, Daling JR: Anal
cancer incidence and survival: the surveillance, epidemiology, and end
results experience, 1973-2000. Cancer 2004, 101:281-288.
3. Nigro ND, Vaitkevicius VK, Considine B: Combined therapy for cancer of
the anal canal: A preliminary report. Dis Colon Rectum 1974, 17:354-356.
4. Epidermoid anal cancer: results from the UKCCCR randomised trial of
radiotherapy alone versus radiotherapy, 5-fluorouracil, and mitomycin.
UKCCCR Anal Cancer Trial Working Party. UK Co-ordinating Committee
on Cancer Research. Lancet 1996, 348:1049-1054.
5. Bartelink H, Roelofsen F, Eschwege F, Rougier P, Bosset JF, Gonzalez DG,
Peiffert D, van Glabbeke M, Pierart M: Concomitant radiotherapy and
chemotherapy is superior to radiotherapy alone in the treatment of
locally advanced anal cancer: results of a phase III randomized trial of
the European Organization for Research and Treatment of Cancer
Radiotherapy and Gastrointestinal Cooperative Groups. J Clin Oncol 1997,
15:2040-2049.
6. Nguyen BT, Joon DL, Khoo V, Quong G, Chao M, Wada M, Joon ML, See A,
Feigen M, Rykers K, Kai C, Zupan E, Scott A: Assessing the impact of FDG-
PET in the management of anal cancer. Radiother Oncol 2008, 87:376-382.
7. Myerson RJ, Kong F, Birnbaum EH, Fleshman JW, Kodner IJ, Picus J,
Ratkin GA, Read TE, Walz BJ: Radiation therapy for epidermoid carcinoma
of the anal canal, clinical and treatment factors associated with
outcome. Radiother Oncol 2001, 61:15-22.
8. Myerson RJ, Garofalo MC, El Naqa I, Abrams RA, Apte A, Bosch WR, Das P,
Gunderson LL, Hong TS, Kim JJ, Willett CG, Kachnic LA: Elective clinical
target volumes for conformal therapy in anorectal cancer: an Radiation
Therapy Oncology Group Consensus panel contouring atlas. Int J Radiat
Oncol Biol Phys 2009, 74:824-830.
9. Trautmann TG, Zuger JH: Positron Emission Tomography for pre-
treatment staging and posttreatment evaluation in cancer of the anal
canal. Mol Imaging Biol 2005, 7:309-313.
10. Cotter SE, Grigsby PW, Siegel BA, Dehdashti F, Malyapa RS, Fleshman JW,
Birnbaum EH, Wang X, Abbey E, Tan B, Kodner IJ, Hunt SR, Lowney JK,
Mutch MG, Dietz DW, Myerson RJ: PET/CT in the evaluation of anal
carcinoma. Int J Radiat Oncol Biol Phys 2006, 65:720-725.
11. Anderson C, Koshy M, Staley C, Esiashvili N, Ghavidel S, Fowler Z, Fox T,
Esteves F, Landry J, Godette K: PET-CT fusion in radiation management of
patients with anorectal tumors. Int J Radiat Oncol Biol Phys 2007,
69:155-162.
12. Schwarz JK, Siegel BA, Dehdashti F, Myerson RJ, Fleshman JW, Grigsby PW:
Tumor response and survival predicted by posttherapy FDG-PET/CT in
anal cancer. Int J Radiat Oncol Biol Phys 2008, 71:180-186.
13. Winton E, Heriot AG, Ng M, Hicks RJ, Hogg A, Milner A, Leong T, Fay M,
MacKay J, Drummond E, Ngan SY: The impact of 18-fluorodeoxyglucose
positron emission tomography on the staging, management and
outcome of anal cancer. Br J Cancer 2009, 100:693-700.
14. Bassi MC, Turri L, Sacchetti G, Loi G, Cannillo B, La Mattina P, Brambilla M,
Inglese E, Krengli M: FDG-PET/CT imaging for staging and target volume
delineation in preoperative conformal radiotherapy of rectal cancer. Int J
Radiat Oncol Biol Phys 2008, 70:1423-1426.
15. O’Neill BD, Salerno G, Thomas K, Tait DM, Brown G: MR versus CT imaging:
low rectal cancer tumour delineation for three-dimensional conformal
radiotherapy. Br J Radiol 2009, 82:509-513.
16. Mai SK, Welzel G, Hermann B, Wenz F, Haberkorn U, Dinter DJ: Can the
radiation dose to CT-enlarged but FDG-PET-negative inguinal lymph
nodes in anal cancer be reduced?. Strahlenther Onkol 2009, 185:254-259.
17. Ciernik IF, Huser M, Burger C, Davis B, Szekely G: Automated functional
image-guided radiation treatment planning for rectal cancer. Int J Radiat
Oncol Biol Phys 2005, 62:893-900.
18. Patel DA, Chang ST, Goodman KA, Quon A, Thorndyke B, Gambhir SS,
McMillan A, Loo BW, Koong AC: Impact of integrated PET/CT on
variability of target volume delineation in rectal cancer. Technol Cancer
Res Treat 2007, 6:31-36.
19. Brambilla M, Matheoud R, Secco C, Loi G, Krengli M, Inglese E: Impact of
target-to-background ratio and target size on threshold segmentation
for PET target volume delineation in radiation treatment planning. Med
Phys 2008, 35:1207-1213.
doi:10.1186/1748-717X-5-10
Cite this article as: Krengli et al.: FDG-PET/CT imaging for staging and
target volume delineation in conformal radiotherapy of anal carcinoma.
Radiation Oncology 2010 5:10.
Krengli et al. Radiation Oncology 2010, 5:10
/>Page 7 of 7