Báo cáo khoa học: "Helical tomotherapy for single and multiple liver tumours" pot
Bạn đang xem bản rút gọn của tài liệu. Xem và tải ngay bản đầy đủ của tài liệu tại đây (816.87 KB, 10 trang )
Lee et al. Radiation Oncology 2010, 5:58
/>Open Access
RESEARCH
© 2010 Lee et al; licensee BioMed Central Ltd. This is an Open Access article distributed under the terms of the Creative Commons At-
tribution License ( which permits unrestricted use, distribution, and reproduction in any
medium, provided the original work is properly cited.
Research
Helical tomotherapy for single and multiple liver
tumours
Tsair-Fwu Lee*
†1,2
, Pei-Ju Chao
†1,2
, Fu-Min Fang
2
, Te-Jen Su
1
, Stephen W Leung
3
and Hsuan-Chih Hsu*
2
Abstract
Purpose: Dosimetric evaluations of single and multiple liver tumours performed using intensity-modulated helical
tomotherapy (HT) were quantitatively investigated. Step-and-shoot intensity-modulated radiotherapy (SaS-IMRT) was
used as a benchmark.
Methods: Sixteen patients separated into two groups with primary hepatocellular carcinomas or metastatic liver
tumours previously treated using SaS-IMRT were examined and re-planned by HT. The dosimetric indices used
included the conformity index (CI) and homogeneity index (HI) for the planned target volume (PTV), max/mean dose,
quality index (QI), normal tissue complication probability (NTCP), V
30 Gy
, and V
50%
for the specified organs at risk (OARs).
The monitor units per fraction (MU/fr) and delivery time were also analysed.
Results: For the single tumour group, both planning systems satisfied the required PTV prescription, but no statistical
significance was shown by the indexes checking. A shorter delivery time and lower MU/fr value were achieved by the
SaS-IMRT. For the group of multiple tumours, the average improvement in CI and HI was 14% and 4% for HT versus SaS-
IMRT, respectively. Lower V
50%
, V
30 Gy
and QI values were found, indicating a significant dosimetric gain in HT. The NTCP
value of the normal liver was 20.27 ± 13.29% for SaS-IMRT and 2.38 ± 2.25% for HT, indicating fewer tissue
complications following HT. The latter also required a shorter delivery time.
Conclusions: Our study suggests dosimetric benefits of HT over SaS-IMRT plans in the case of multiple liver tumours,
especially with regards sparing of OARs. No significant dosimetric difference was revealed in the case of single liver
tumour, but SaS-IMRT showed better efficiency in terms of MU/fr and delivery time.
Background
During the past 20 years, primary liver cancer has ranked
the fifth most common malignancy worldwide, the third
leading cause of death from malignant neoplasm in Japan
in men and the fifth in women [1,2], and the second lead-
ing cause of cancer death in Taiwan with a mortality of
more than 7,000 cases each year [3]. Several modalities
have been used for the treatment of hepatocellular carci-
nomas (HCC) and metastatic liver tumours [4-10] includ-
ing surgery, transcatheter arterial chemoembolization
(TACE), percutaneous ethanol injection therapy, micro-
wave coagulation therapy, radiotherapy and liver trans-
plantation. The role of radiotherapy has been limited
because of the poor tolerance of the whole liver to radia-
tion [11,12]. With advances in intensity-modulated radia-
tion therapy (IMRT), several reports have indicated
increased safety and more promising results in patients
with unresectable intrahepatic malignancies treated with
radiotherapy to a portion of the liver [6,13-18]. IMRT
constitutes an advanced form of the conformal technique
and uses inverse planning algorithms and iterative com-
puter-driven optimization to generate treatment fields
with varying beam intensity. It has the ability to produce
custom-tailored conformal dose distributions around the
tumour, although most studies have examined large
tumours [19]. IMRT can also be delivered using linac or
Hi-Art Helical Tomotherapy (HT) (TomoTherapy, Madi-
son, WI, USA), which creates a more uniform target dose
and improves critical organ sparing [16,20-23] with a
greater number of degrees of freedom.
* Correspondence: ,
1
Medical Physics and Informatics Lab. (EE), National Kaohsiung University of
Applied Sciences, Kaohsiung, Taiwan
2
Chang Gung Memorial Hospital-Kaohsiung Medical Centre, Chang Gung
University College of Medicine, Kaohsiung, Taiwan
†
Contributed equally
Full list of author information is available at the end of the article
Lee et al. Radiation Oncology 2010, 5:58
/>Page 2 of 10
Compared with conventional and other IMRT tech-
niques, HT can potentially produce superior dose distri-
butions (i.e., more uniform dose to the target and lower
doses to normal tissues) and is thus being reconsidered
for promotion [21,22,24]. In this study, we investigated
the potential improvement of HT over step-and-shoot
(SaS)-IMRT for the treatment of single or multiple liver
tumours. HT plans were compared with IMRT plans for
sixteen patients previously treated using SaS-IMRT deliv-
ery. The HT plans were designed to emulate as closely as
possible the goals and constraints used for SaS-IMRT
plans. Dose distributions in the planned target volume
(PTV) and organs at risk (OARs) were compared accord-
ing to the isodose distribution and dose-volume histo-
gram (DVH)-based method using several dosimetric
parameters including the conformity index (CI) and
homogeneity index (HI) for the PTV, max/mean dose,
quality index (QI) for the organs at risk (OARs) [25-29],
V
30 Gy
, V
50%
, EUD (equivalent uniform dose), and NTCP
(normal tissue complication probabilities) for the normal
and whole liver. The delivery time and monitor units per
fraction (MU/fr) of the two techniques were also com-
pared. SaS-IMRT was used as a benchmark.
Methods
Study population
Sixteen consecutive patients (six females, ten males) with
primary hepatocellular carcinomas (HCC) or metastatic
liver tumours previously treated using SaS-IMRT
between March 2006 and March 2008 were examined.
The patient characteristics and tumour descriptions are
presented in Table 1. The median age was 68 years (range
50-85). Patients were retrospectively grouped to evaluate
the influence of the treatment plans. Two groups were
formed according to whether they had single (group 1) or
multiple (group 2) tumour sites, and interestingly, there
were eight in each group. The distributions of clinical
stages according to the American Joint Committee on
Cancer (AJCC 6
th
edition) staging system was as follows;
I: 1 (6.25%), II: 3 (18.75%), III: 5 (31.25%) and metastasis
liver tumour: 7 (43.75%). Six (37.5%) were treated with a
combination of chemotherapy.
All patients were immobilized using a tailor-made vac-
uum lock in the supine position with their arms placed on
their forehead. The patients were scanned using a CT
(Siemens Biograph LSO PET/CT, PA, USA) with a 3-mm
slice thickness, containing 512 × 512 pixels in each slice.
The field of view had a mean dimension of 48 cm.
Treatment plans were originally calculated with the
ADAC Pinnacle
3
, version 7.4 (ADAC Inc, CA, USA)
treatment-planning system (TPS) on a dose grid of 0.4 ×
0.4 × 0.3 cm
3
without DMPO (direct machine parameter
optimization). The 5-field and range 4 × 6 SaS-IMRT
technique was used with the dose goal for PTV coverage;
initial gantry angles of 20°, 310°, 270°, 220° and 180° were
set. The plan was delivered on an Elekta Precise™ Linac
equipped with an 80-leaf 1-cm MLC in SaS-IMRT mode.
Basically, the IMRT planning system tried to achieve the
dose goal target coverage while keeping within the dose
constraints of OARs by sequential iteration.
PTV and normal organ contouring
The planned target volume (PTV) structures were cre-
ated from the gross tumour volume (GTV) structures.
Respiratory motion is the main determinant of PTV
expansion. PTVs were based on a 5 mm radial expansion
and a 10 mm craniocaudal expansion. Because respira-
tory motion has been shown to be greater in the cranio-
caudal dimension than in the anteroposterior and
mediolateral dimensions, an asymmetric expansion was
used for the PTV [30-33]. The PTV ranged from 57.75 to
726.32 cc (222.77 ± 170.35). For dosimetric analysis, the
normal liver volume did not include the PTV. The OARs
used in this study were as follows: 1) spinal cord-maxi-
mum dose ≤ 45 Gy; 2) kidneys (L & R)-mean dose to
bilateral kidneys must be < 16 Gy. If only one kidney is
present, not more than 15% of the volume of that kidney
can receive ≥ 18 Gy and no more than 30% can receive ≥
14 Gy; 3) liver-mean liver dose must be ≤ 25 Gy; 4) gas-
Table 1: Patient characteristics (n = 16)
Characteristics No. of patients
Age, median years (range) 68 (50-85)
Gender
Male 10 (62.5%)
Female 6 (37.5%)
Primary HCC (AJCC, 6
th
edition)
I1 (6.25%)
II 3 (18.75%)
III 5 (31.25%)
Metastasis liver tumour
Structures (cm
3
) Mean ± SD
(range)
7 (43.75%)
PTV 222.77 ± 170.35 (57.75-726.32)
Normal liver 1299.88 ± 279.03 (751.03-1776.16)
Rt kidney 132.7 ± 50.19 (35.39-238.91)
Lt kidney 147.62 ± 42.82 (78.54-233.17)
Spinal cord 14.10 ± 5.52 (4.93-26.44)
Patient's tumour number
Single (group 1) 8(50%)
Multiple (group 2) 8(50%)
Abbreviation: HCC: Hepatocellular Carcinoma; AJCC = American Joint
Committee on Cancer; PTV: Planned target volume; Rt: Right side; Lt:
Left side;
Lee et al. Radiation Oncology 2010, 5:58
/>Page 3 of 10
trointestinal system (GIS) (including stomach and small
bowels)-maximum dose ≤ 54 Gy; < 10% of each organ
volume can receive between 50 and 53.99 Gy, < 15% of
the volume of each organ can receive between 45 and
49.99 Gy.
Treatment plans
In the re-planned HT, three main parameters were
selected: the field width (1, 2.5 or 5 cm), pitch (range
0.01-20), and modulation factor (range 1-10). A 2.5-cm
field width, a pitch of 0.287 (0.86/3) and a modulation
factor of 2 were used in all of the HT plans in this study
[34,35]. The software version used for this re-planning
study was Hi-Art TomoPlan 2.1 (Tomotherapy Inc., Wis-
consin, USA). The selection of these three parameter val-
ues was based on preliminary planning exercises that
showed them to provide a good balance between ability at
dose sculpting and treatment efficiency, in terms of treat-
ment duration and feasibility for routine use. In general,
small field dimensions, small pitch and large modulation
factors mean longer irradiation times and a better ability
for the delivery system to sculpt complex dose distribu-
tions with steeper dose gradients [16,21,23,24,36]. For all
patients, dose calculation was done on the fine grid,
which has a resolution of 1.875 × 1.875 mm
2
by the slice
thickness of 3 mm for the dose calculation window of 48
× 48 cm
2
(256 × 256 pixels). Both planning systems per-
form iterations during the optimization process. The 0.1
Gy dose bin-size of the dose-volume histograms (DVHs)
used in both systems was the same for the subsequent
computation of various indices. Plans were run with the
goal of delivering the prescribed doses of 60 Gy/30 frac-
tions while meeting the normal tissue constraints for
conventional treatment. The PTV doses were prescribed
to cover over 95% of the PTV with no greater than a 107%
maximum point dose. Having achieved these objectives,
the dose plans were made by the same physicist and
approved by the same oncologist, who was specialized in
liver tumours. The monitor units per fraction (MU/fr),
segments and delivery time taken by the two plans were
compared. The patient set-up time was not included.
Plan evaluation
The HT plans were compared with the SaS-IMRT plans
using the following dosimetric parameters:
1. CI: a ratio used to evaluate the goodness of fit of the
PTV to the prescription isodose volume in the treat-
ment plans: where V
TV
is the treat-
ment volume of the prescribed isodose lines; V
PTV
is
the volume of the PTV; and TV
PV
is the volume of
V
PTV
within the V
TV
. The smaller and closer the value
of CI is to 1, the better the dose conformity [26,37].
2. HI: a ratio used to evaluate the homogeneity of the
PTV. where D
5%
and D
95
are the mini-
mum doses delivered to 5% and 95% of the PTV. A
larger HI indicates poorer homogeneity [38,39].
3. QI: an index used to evaluate the difference in the
maximum or mean absorbed dose at serial or parallel
OARs, respectively, between HT and SaS-IMRT plans
[22,40].
4. V
50%
: the percentage volume receiving a dose
greater than or equal to 50% of the prescribed dose
for a normal liver.
5. V
30 Gy
: the percentage volume receiving a dose
greater than or equal to 30 Gy for the whole liver.
6. EUD: equivalent uniform dose, the original defini-
tion of the EUD was derived on the basis of a mecha-
nistic formulation using a linear-quadratic cell
survival model [41]. Subsequently, Niemierko and
Emami suggested a phenomenological model of the
form [42]:
where α is a unitless model parameter that is specific to
the normal structure or tumour of interest, and ν
i
is unit-
less and represents the ith partial volume receiving dose
D
i
in Gy. Since the relative volume of the whole structure
of interest corresponds to 1, the sum of all partial vol-
umes v
i
will equal 1. For normal tissues, the EUD repre-
sents the uniform dose that leads to the same probability
of injury as the examined inhomogeneous dose distribu-
tion.
7. NTCP: an EUD-based normal tissue complication
probability (NTCP) was used. Niemierko proposed
parameterization of the dose-response characteristics
using the logistic function [42,43]:
where TD
50
is the tolerance dose for a 50% complication
rate at a specific time interval (e.g., 5 years in the Emami
et al. normal tissue tolerance data [44]) when the whole
organ of interest is homogeneously irradiated, and γ
50
is a
unitless model parameter that is specific to the normal
CI V
PTV
V
TV
TV
PV
=×
2
HI
D
D
=
5
95
%
%
QI
D
ht
D
imrt
QI
D
mean
ht
D
mean
imrt
Serial Parallel
==
max
max
,.
EUD v D
ii
a
i
a
=
()
⎛
⎝
⎜
⎜
⎞
⎠
⎟
⎟
=
∑
1
1
NTCP
TD
EUD
=
+
⎛
⎝
⎜
⎞
⎠
⎟
1
1
50
4
50
g
Lee et al. Radiation Oncology 2010, 5:58
/>Page 4 of 10
structure and describes the slope of the dose-response
curve. Niemierko and Emami suggested that the parame-
ters of α and γ
50
should be used in the EUD-based NTCP
model. The values of α, γ
50
, and TD
50
used in this study
were 3, 3, and 40 Gy respectively, and were based on the
Emami data, calculating the BED as 2 Gy/fraction with an
α/β ratio of 2 [42,44]. The Matlab-2009a software (Math-
Works, Inc., Natick, Massachusetts) was used for EUD-
based NTCP and CERR (computational environment for
radiotherapy research) calculations [45].
Statistical analyses
The mean values (standard deviation) of the dosimetric
data for the sixteen patients were analysed using the
paired Wilcoxon signed-rank test to compare the differ-
ence between HT and SaS-IMRT. A two-tailed value of p
< 0.05 was deemed to indicate statistical significance. The
SPSS-15.0 software was used for data processing (SPSS,
Inc., Chicago, IL).
Results
PTV analysis
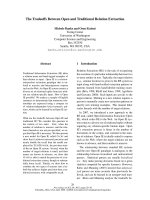
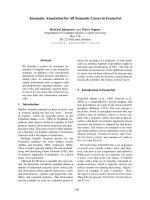
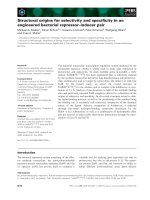
The isodose distributions in the axial plane and the DVHs
of the PTV and OARs for one typical case in each group
plan using both systems are shown in Figs. 1 and 2.
Table 2 gives the dose statistics for the PTV for each
group with HT and SaS-IMRT.
For group 1, the mean V
95%
and V
100%
for the desired
PTV coverage was 99.44 ± 0.72 and 97.26 ± 1.13 in the
HT plans, and 99.63 ± 0.51 and 97.84 ± 0.99 in the SaS-
IMRT plans, respectively, with no significant differences
between plans. For the hot spot checking, the mean V
107%
for the desired PTV was 0.00 ± 0.00 with HT and 8.75 ±
4.94 with SaS-IMRT respectively, indicating significantly
better homogeneity of the PTV with HT (p < 0.05). (V
x%
:
volume receiving ≥x% of the prescribed dose).
The mean CI for group 1 was 1.21 ± 0.07 with HT and
1.30 ± 0.05 with SaS-IMRT, indicating a significantly bet-
ter conformity of the PTV with HT (p < 0.05) The average
improvement in CI was 7% for HT. The mean HI was 1.04
± 0.01 for HT and 1.06 ± 0.01 for SaS-IMRT; this differ-
ence was statistically significant (p < 0.05) with a 2%
improvement in HT.
For group 2, the mean V
95%
and V
100%
for the desired
PTV coverage was 99.09 ± 0.45 and 96.20 ± 0.70 in the
HT plans, and 98.47 ± 0.69 and 96.13 ± 1.10 in the SaS-
IMRT plans, respectively, with no significant difference
between plans. For the hot spot checking, the mean V
107%
for the desired PTV was 0.30 ± 0.58 with HT and 16.62 ±
2.38 with SaS-IMRT respectively, indicating significantly
better homogeneity of the PTV with HT (p < 0.05).
The mean CI was 1.25 ± 0.11 with HT and 1.43 ± 0.07
with SaS-IMRT, indicating significantly better conformity
of the PTV with HT (p < 0.05). The average improvement
in CI was 14% for HT versus SaS-IMRT. The mean HI for
group 2 was 1.06 ± 0.01 for HT and 1.10 ± 0.02 for SaS-
IMRT; this difference was statistically significant (p <
0.05) with a 4% improvement in HT.
Dosimetry of OARs
The dose statistics of the specified OARs are summarized
in Table 3. For group 1, the mean dose, V
50%
and NTCP
value of the normal liver did not differ significantly
between the HT and SaS-IMRT plans (p > 0.05). Similarly
there was no significant difference between plans in the
V
30 Gy
value of the whole liver (p > 0.05) or the max/mean
dose of the other four OARs (R/Lt kidneys, GIS, and spi-
nal cord) (p > 0.05).
For group 2, the mean dose, V
50%
and NTCP value of
the normal liver were significantly lower in the HT plans
versus the SaS-IMRT plans (p < 0.05). The V
50%
value of
the normal liver was 36.46 ± 4.92% for HT and 51.74 ±
11.46% for SaS-IMRT, indicating an approximate reduc-
tion of 15% in HT. With regards tissue complications the
NTCP value of the normal liver was 2.38 ± 2.25% for HT
and 20.27 ± 13.29% for SaS-IMRT, indicating an approxi-
mate reduction of 18% in HT (NTCP for liver failure).
The V
30 Gy
value of the whole liver differed significantly
between plans (p < 0.05). The mean value of V
30 Gy
for the
whole liver was 43.91 ± 10.43% for HT and 55.00 ±
14.28% for SaS-IMRT, indicating an approximate 11%
reduction in HT. The max/mean dose of the following
three OARs (R/Lt kidneys and GIS) did not differ signifi-
cantly. The maximum dose of the spinal cord was 18.08 ±
5.38 for HT and 23.55 ± 8.65 Gy for SaS-IMRT. These
results indicate a significant dosimetric gain in HT and a
reduced dose to sensitive structures.
QI analysis for the OARs
The QI values of the OARs for group 1 and group 2 are
listed in Table 4; the kidneys were excluded in the QI cal-
culation as the test results did not differ significantly.
For group 1, of the two serial OARs, the spinal cord
showed the most notable improvement [QI = 0.86 ± 0.47]
followed by GIS [QI = 0.91 ± 0.23], indicating an approxi-
mate 14% reduction in maximal dose in the spinal cord
and a 9% reduction in the GIS in the HT versus SaS-
IMRT plans, respectively (p > 0.05). Of the only parallel
organ (normal liver) calculated, the QI
Parellel
was 0.95 ±
0.20, indicating an approximate mean dose reduction of
5% in the normal liver in the HT versus SaS-IMRT plans.
For group 2, of the two serial OARs, the spinal cord
showed the most notable improvement [QI = 0.83 ± 0.30]
followed by the GIS [QI = 0.95 ± 0.12], indicating an
approximate 17% reduction in maximal dose in the spinal
cord and a 5% reduction in the GIS in the HT versus SaS-
Lee et al. Radiation Oncology 2010, 5:58
/>Page 5 of 10
IMRT plans, respectively. Of the only parallel organ (nor-
mal liver) calculated, the QI
Parellel
was 0.93 ± 0.17, indicat-
ing an approximate mean dose reduction of 7% in the
normal liver by HT.
For the whole study cohort, of the two serial OARs, the
spinal cord showed the most notable improvement [QI =
0.85 ± 0.38] followed by the GIS [QI = 0.93 ± 0.18], indi-
cating an approximate 15% reduction in maximal dose in
the spinal cord and a 7% reduction in the GIS by HT. Of
the only parallel (normal liver) organ calculated, the QI
was 0.93 ± 0.17, indicating an approximate mean dose
reduction of 7% in the normal liver by HT.
MU/fr and delivery time
The MU/fr and delivery time of the sixteen patients with
HT versus SaS-IMRT are compared in Table 5. For group
1, the mean delivery time was 4.4 ± 1.4 min (range 2.9-
6.3) for HT and 3.3 ± 1.4 min (range 1.9-5.2) for SaS-
IMRT, with a significant difference between these values
(p = 0. 00). The mean MU/fr used was 5135 ± 1678 for
HT, which was significantly higher than the mean MU/fr
of 343 ± 120 in SaS-IMRT (p < 0.05).
For group 2, the mean delivery time was 4.7 ± 0.8 min
(range 3.3-5.7) for HT and 6.2 ± 1.4 min (range 4.8-8.8)
for SaS-IMRT. A significant difference was observed
between these values (p < 0.05). The mean MU/fr used
was 5529 ± 960 for HT, which was significantly higher
than the mean MUs of 461 ± 242 in SaS-IMRT (p < 0.05).
Discussion
The benefits of improved dose homogeneity and better
sparing of critical organs in HT compared with conven-
tional linac-based IMRT have been reported in prostate
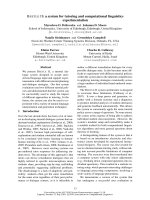
Figure 1 The comparison of isodose distributions of planned target volume (PTV) and organs at risk (OARs) in an axial plane for one patient
in group 1 using the helical tomotherapy (HT) planning system versus step-and-shoot intensity-modulated radiotherapy (SaS-IMRT). DVH:
Dose volume histograms; PTV = Planning target volume; OAR = Organ at risk
Dose (cGy)
700060005000400030002000
10000
20
40
60
80
100
Volume %
Dose (cGy)
700060005000400030002000
10000
20
40
60
80
100
Volume %
Solid lineΚHT
Dash lineΚSaS-IMRT
Solid lineΚHT
Dash lineΚSaS-IMRT
Nor.liver
SC
Stomach
Dose (cGy)
Volume %
20
40
60
80
100
700060005000400030002000
10000
Dose (cGy)
Volume %
20
40
60
80
100
700060005000400030002000
10000
— 107% — 100% — 95% — 80% — 60% — 50%
HT SaS-IMRT
Lee et al. Radiation Oncology 2010, 5:58
/>Page 6 of 10
cancer [46], intracranial tumours [24], nasopharyngeal
carcinoma [22] and other head and neck cancers [47,48],
and breast cancer [13]. However, these benefits of IMRT
and HT are generally achieved at the cost of a greater vol-
ume of normal tissue in the irradiated volume receiving a
low dose [29,49]. In addition, radiotherapy for liver
tumours is largely limited by the dose to the surrounding
normal tissues, primarily the residual normal liver tissue.
One of the major objectives of this study was to deter-
mine the achievable gain of HT in single and multiple
liver tumour irradiations against a well-investigated and
routinely-used clinical technique, SaS IMRT, delivered in
a conventional way with SaS-IMRT planning and an
Elekta Precise delivery system. Sixteen cases in two
groups were investigated in this study. The HT plans had
a slightly significantly better conformity and homogene-
ity to the PTV than SaS-IMRT plans in the whole cohort.
However, the dosimetric advantages of the two plans
were inconsistent for individual OARs and other indices.
We demonstrated that HT plans significantly improved
the conformity index (improvement ratio: 7 and 14%) and
homogeneity index (improvement ratio: 2 and 4%) of the
PTV compared with SaS-IMRT plans in group 1 and 2,
respectively.
However, the difference between the mean/maximal
doses of OARs was not statistically significant in group 1,
indicating no difference in OARs sparing. Sparing was
found in the normal liver with mean values of QI-1 = 0.95
± 0.20 and QI-2 = 0.90 ± 0.14, and in the spinal cord with
Figure 2 The comparison of isodose distributions of planned target volume (PTV) and organs at risk (OARs) in an axial plane for one patient
in group 2 using the helical tomotherapy (HT) planning system versus step-and-shoot intensity-modulated radiotherapy (SaS-IMRT). DVH:
Dose volume histograms; PTV = Planning target volume; OAR = Organ at risk
Dose (cGy)
700060005000400030002000
10000
20
40
60
80
100
Volume %
Dose (cGy)
700060005000400030002000
10000
20
40
60
80
100
Volume %
Solid lineΚHT
Dash lineΚSaS-IMRT
Solid lineΚHT
Dash lineΚSaS-IMRT
Nor.liver
Dose (cGy)
Volume %
20
40
60
80
100
700060005000400030002000
10000
Dose (cGy)
Volume %
20
40
60
80
100
700060005000400030002000
10000
SC
Stomach
Rt kidney
— 107% — 100% — 95% — 80% — 60% — 50%
SaS-IMRT
HT
Lee et al. Radiation Oncology 2010, 5:58
/>Page 7 of 10
mean values of QI-1 = 0.86 ± 0.47 and QI-2 = 0.83 ± 0.30
in group 2, indicating a dosimetric gain in the HT plans.
In V
30 Gy
and V
50%
analysis, HT showed a significant
dosimetric gain in group 2. The results showed that a bet-
ter (lower) dose was received in HT than that in group 1;
for group 2, the mean value of V
50%
of the whole liver was
36.46 ± 4.92 for HT and 51.74 ± 11.46 for SaS-IMRT,
indicating an approximate reduction of 15.3% in HT. The
mean value of V
30 Gy
of the normal liver was 43.91 ± 10.43
for HT and 55.00 ± 14.28 for SaS-IMRT, indicating an
approximate reduction of 11.1% in HT. These results
showed a significant dosimetric gain in HT and a reduced
mean liver dose.
In clinical practice, the V
50%
(fraction of normal liver
treated to at least 50% of the isocentre dose) and the V
30
Gy
(the percentage volume receiving a dose greater than
or equal to 30 Gy for the whole liver) are the most com-
monly used indicators for the dose given. According to
the Yonsei University guidelines [50], if the percentage of
normal liver volume receiving 50% of the isocentre dose
was less than 25%, the total dose was increased to 59.4
Gy; if the percentage was 25% to 49%, the dose was 45 to
54 Gy; if the percentage was 50% to 75%, the dose was
30.6 to 45 Gy, and if the dose was more than 75%, no
treatment was administered. They showed that the
parameter V
50%
can be divided into four categories and
used to predict acceptable liver toxicity. In group 2, the
V
50%
value of normal liver was 36.46 ± 4.92% for HT and
51.74 ± 11.46% for SaS-IMRT, indicating an opportunity
for dose escalation by HT versus SaS-IMRT plans. The
NTCP value of the normal liver was 2.38 ± 2.25% for HT
and 20.27 ± 13.29% for SaS-IMRT, indicating that a
reduction in tissue complications may be achieved by HT
versus SaS-IMRT plans.
Kim et al. demonstrated that the V
30 Gy
appears to be a
useful dose-volumetric parameter for predicting the risk
of radiation-induced hepatic toxicity (RIHT). In their
report, grade 2 or worse RIHT was observed in only 2 out
of 85 patients (2.4%) with a whole liver volume receiving
30 Gy (V
30 Gy
, whole liver) of ≤60%, and in 11 out of 20
patients (55.0%) with greater than 60% (p < 0.001) [12].
When a lower value of V
50%
and/or V
30 Gy
was accom-
plished, a higher PTV dose could be given. As a result, a
lower V
50%
and/or V
30 Gy
can be achieved with HT for the
treatment of multiple liver tumours than with SaS-IMRT.
Consequently, a higher dose can be given and a higher
response can be achieved when HT is selected.
The overall delivery time and average MU/fr used in
the HT plans were significantly higher than for SaS-
IMRT plans, which are consistent with the results of sev-
eral studies [13,22,24,47-49]. The delivery time depended
on the limitations of gantry rotation and dose prescrip-
tion in the HT system, while a speed limitation on gantry
rotation exists in the HT system. An interesting result
occurred in this study in that a contrary result was found
in group 2 due to the geometry of the multiple site distri-
bution. The mean delivery time in group 2 was 4.7 ± 0.8
min (range 3.3-5.7) for HT and 6.2 ± 1.4 min (range 4.8-
8.8) for SaS-IMRT. This difference was significant (p = 0.
01).
We also found that both planning systems satisfied the
required PTV prescription, but that better dose confor-
mity and homogeneity were achieved with the HT com-
Table 2: The dosimetric results of PTV between HT and SaS-IMRT plans for two groups
Parameter objective HT SaS-IMRT p
Group 1-single tumour group
V
95%
100 99.44 ± 0.72(97.97-100.00) 99.63 ± 0.51(98.78-100.00) n/a
V
100%
95 97.26 ± 1.13(95.87-98.79) 97.84 ± 0.99(96.50-99.07) n/a
V
107%
0 0.00 ± 0.00 8.75 ± 4.94(2.30-15.14) < 0.05
CI 1 1.21 ± 0.07(1.15-1.37) 1.30 ± 0.05(1.23-1.40) < 0.05
HI 1 1.04 ± 0.01(1.02-1.05) 1.06 ± 0.01(1.02-1.07) < 0.05
Group 2-multiple tumours group
V
95%
100 99.09 ± 0.45(98.43-99.95) 98.47 ± 0.69(97.35-99.25) n/a
V
100%
95 96.20 ± 0.70(95.60-97.86) 96.13 ± 1.10(94.80-97.77) n/a
V
107%
0 0.30 ± 0.58(0.00-1.60) 16.62 ± 2.38(13.70-20.53) < 0.05
CI 1 1.25 ± 0.11(1.15-1.47) 1.43 ± 0.07(1.37-1.57) < 0.05
HI 1 1.06 ± 0.01(1.02-1.07) 1.10 ± 0.02(1.08-1.12) < 0.05
Abbreviation: SaS-IMRT: Step-and-shoot intensity-modulated radiotherapy; HT: Helical tomotherapy; V
x%
: volume receiving ≥x% of the
prescribed dose; CI: Conformity index; HI: Homogeneity index; n/a: not statistical significance; statistical significance (p < 0.05) is reported
between couples from the paired Wilcoxon signed-rank test analysis.
Lee et al. Radiation Oncology 2010, 5:58
/>Page 8 of 10
pared to SaS-IMRT plans in the two groups. No
significant was shown for OARs sparing in group 1, espe-
cially if the tumour is leaning against the body surface. As
the result, general SaS-IMRT can meet the prescription
requirements like the HT did, but shown more efficiency
in MU/fr used and delivery time saved than HT in group
1.
We did not aim to perform a strict comparison of the
two systems, but to retrospectively evaluate the dosimet-
ric difference for the 16 patients that had been success-
fully treated with step-and-shoot IMRT and re-planned
in a routinely-used helical tomotherapy based upon the
same planning CT scan; the dose plans were made by the
same physicist and approved by the same oncologist who
was specialized in liver tumours. We paid careful atten-
tion to reducing biases in this study. However, there are
some limitations with regard to our results, and although
we used the same resolution, voxel size, and binning of
Table 3: Dosimetric statistics for the specified OARs
Structure Parameter HT SaS-IMRT p
Group 1-single tumour group
Normal liver Mean (Gy) 18.24 ± 6.73(10.84-31.09) 20.01 ± 7.86 (8.37-31.20) n/a
V
50%
(%) 19.17 ± 5.62(10.83-22.50) 22.19 ± 7.13(14.17-31.25) n/a
EUD 23.68 ± 5.14(16.60-33.97) 29.11 ± 5.46(21.52-37.14) < 0.05
NTCP 1.69 ± 4.30(0.003-12.33) 6.80 ± 9.86(0.06-29.07) 0.051
Whole liver V
30 Gy
(%) 36.41 ± 14.88(16.45-62.00) 39.44 ± 16.57(16.94-62.06) n/a
Lt kidney Mean (Gy) 2.48 ± 2.43 (0.30-6.44) 2.83 ± 3.61(0.17-9.00) n/a
Rt kidney Mean (Gy) 4.13 ± 3.09 (0.42-8.03) 5.55 ± 4.55(0.15-10.57) n/a
GIS Max (Gy) 30.18 ± 18.17(8.65-52.56) 32.67 ± 17.27(11.77-53.45) n/a
Spinal cord Max (Gy) 15.30 ± 9.14(5.12-34.28) 22.05 ± 11.10(4.58-34.78) n/a
Group 2-multiple tumours group
Normal liver Mean (Gy) 25.89 ± 3.43(18.89-28.45) 29.73 ± 6.71 (15.54-36.96) < 0.05
V
50%
(%) 36.46 ± 4.92(29.17-41.67) 51.74 ± 11.46(37.5-69.17) < 0.05
EUD 28.09 ± 3.23(21.95-31.87) 34.68 ± 3.80(27.77-38.43) < 0.05
NTCP 2.38 ± 2.25(0.07-6.15) 20.27 ± 13.29(1.23-38.33) < 0.05
Whole liver V
30 Gy
(%) 43.91 ± 10.43(23.12-53.42) 55.00 ± 14.28(27.11-74.97) < 0.05
Lt kidney Mean (Gy) 4.18 ± 2.94 (0.66-9.21) 2.60 ± 2.03(0.37-6.97) n/a
Rt kidney Mean (Gy) 6.11 ± 4.16 (0.99-12.38) 6.45 ± 4.76(0.93-14.58) n/a
GIS Max (Gy) 39.59 ± 12.42(21.42-53.20) 42.05 ± 12.36(19.67-52.78) n/a
Spinal cord Max (Gy) 18.08 ± 5.38(10.58-28.19) 23.66 ± 8.65(8.96-32.20) < 0.05
Abbreviation: SaS-IMRT: Step-and-shoot intensity-modulated radiotherapy;; HT: helical tomotherapy; EUD: Equivalent uniform dose; NTCP:
Normal tissue complication probability; GIS: Gastrointestinal system (including stomach and small bowels); Lt: left side; Rt: right side; n/a: not
statistical significance; statistical significance (p < 0.05) is reported between couples from the paired Wilcoxon signed-rank test analysis.
Table 4: The dosimetric comparisons of QI between HT and SaS-IMRT plans
Variables of OARs QI-1 QI-2 QI-whole cohort
QI of parallel organ
Normal Liver 0.95 ± 0.20 (0.61-1.30) 0.90 ± 0.14 (0.76-1.21) 0.93 ± 0.17 (0.61-1.30)
QI of serial organ
SC 0.86 ± 0.47 (0.16-1.45) 0.83 ± 0.30 (0.56-1.52) 0.85 ± 0.38 (0.16-1.52)
GIS 0.91 ± 0.23 (0.64-1.36) 0.95 ± 0.12 (0.75-1.11) 0.93 ± 0.18 (0.64-1.36)
Abbreviation: HT: Helical tomotherapy; SaS-IMRT: Step-and-shoot intensity-modulated radiotherapy; QI: Quality index; QI-1: QI-single tumour
group; QI-2: QI-multiple tumours group; SC: Spinal cord; GIS: Gastrointestinal system (including stomach and small bowels);
Lee et al. Radiation Oncology 2010, 5:58
/>Page 9 of 10
the DVHs in both systems, and the same software
(CERR), an intrinsic difference in the calculation algo-
rithms or TPS optimization modules (such as DMPO)
might produce different results.
Conclusions
Our study suggests the dosimetric benefits of HT over
SaS-IMRT plans in the group with multiple liver
tumours, especially with regards sparing of OARs, as it
significantly reduced the V
50%
and V
30 Gy
to the normal
liver and whole liver respectively. In addition a reduction
in the NTCP value indicates that fewer tissue complica-
tions may arise in HT plans. Although there was no sig-
nificant difference in the group with single liver tumour,
IMRT showed better efficiency in terms of the MU/fr and
delivery time used.
Competing interests
The authors declare that they have no competing interests.
Authors' contributions
TFL and PJC: idea and concept. FMF; TJS and SWL: design and development of
study. PJC and HCH: statistical analysis. TFL: writing of manuscript and study
coordinator. FMF and HCH: final revision of manuscript. All authors read and
approved the final manuscript.
Acknowledgements
The authors thank the anonymous reviewers for their helpful comments on
the original manuscript and Dr. YJ Huang, Ms. HM Ting and Mr. MH Liu for their
technical support and data collection. This study was supported financially, in
part, by grants from the CGMH (CMRPG890061) and NSC (98-2221-E-151-038).
Author Details
1
Medical Physics and Informatics Lab. (EE), National Kaohsiung University of
Applied Sciences, Kaohsiung, Taiwan,
2
Chang Gung Memorial Hospital-
Kaohsiung Medical Centre, Chang Gung University College of Medicine,
Kaohsiung, Taiwan and
3
Yuan's General Hospital, Kaohsiung, Taiwan
References
1. Kiyosawa K, Umemura T, Ichijo T, Matsumoto A, Yoshizawa K, Gad A,
Tanaka E: Hepatocellular carcinoma: Recent trends in Japan.
Gastroenterology 2004, 127:S17-S26.
2. Thomas MB, Abbruzzese JL: Opportunities for targeted therapies in
hepatocellular carcinoma. Journal of Clinical Oncology 2005, 23:8093.
3. Kao Y-H, Chen C-N, Chiang J-K, Chen S-S, Huang W-W: Predicting Factors
in the Last Week of Survival in Elderly Patients with Terminal Cancer: A
Prospective Study in Southern Taiwan. Journal of the Formosan Medical
Association 2009, 108:231-239.
4. Cha CH, Ruo L, Fong Y, Jarnagin WR, Shia J, Blumgart LH, DeMatteo RP:
Resection of hepatocellular carcinoma in patients otherwise eligible
for transplantation. Ann Surg 2003, 238:315.
5. Dae Yong K, Won P, Do Hoon L, Joon Hyoek L, Byung Chul Y, Seung Woon
P, Kwang Cheol K, Tae Hyun K, Yong Chan A, Seung Jae H: Three-
dimensional conformal radiotherapy for portal vein thrombosis of
hepatocellular carcinoma. Cancer 2005, 103:2419-2426.
6. Fuss M, Salter BJ, Herman TS, Thomas JCR: External beam radiation
therapy for hepatocellular carcinoma: Potential of intensity-modulated
and image-guided radiation therapy. Gastroenterol 2004,
127:S206-S217.
7. Tse RV, Guha C, Dawson LA: Conformal radiotherapy for hepatocellular
carcinoma. Crit Rev Oncol Hematol 2008, 67:113-123.
8. Wang X, Krishnan S, Zhang X, Dong L, Briere T, Crane CH, Martel M, Gillin
M, Mohan R, Beddar S: Proton radiotherapy for liver tumors: dosimetric
advantages over photon plans. Med Dosim 2008, 33:259-267.
9. Ohto M, Yoshikawa M, Saisho H, Ebara M, Sugiura N: Nonsurgical
treatment of hepatocellular carcinoma in cirrhotic patients. World J
Surg 1995, 19:42-46.
10. Tsuzuki T, Sugioka A, Ueda M, Iida S, Kanai T, Yoshii H, Nakayasu K: Hepatic
resection for hepatocellular carcinoma. Surgery 1990, 107:511.
11. Cha CH, Saif MW, Yamane BH, Weber SM: Hepatocellular carcinoma:
current management. Curr Probl Surg 47:10-67.
12. Kim TH, Kim DY, Park J-W, Kim SH, Choi J-I, Kim HB, Lee WJ, Park SJ, Hong
EK, Kim C-M: Dose-volumetric parameters predicting radiation-induced
hepatic toxicity in unresectable hepatocellular carcinoma patients
treated with three-dimensional conformal radiotherapy. Int J Radiat
Oncol Biol Phys 2007, 67:225-231.
13. Caudrelier JM, Morgan SC, Montgomery L, Lacelle M, Nyiri B, MacPherson
M: Helical tomotherapy for locoregional irradiation including the
internal mammary chain in left-sided breast cancer: Dosimetric
evaluation. Radiother Oncol 2009, 90:99-105.
14. Cheng JC-H, Wu J-K, Huang C-M, Liu H-S, Huang DY, Tsai SY, Cheng SH,
Jian JJ-M, Huang AT: Dosimetric analysis and comparison of three-
dimensional conformal radiotherapy and intensity-modulated
radiation therapy for patients with hepatocellular carcinoma and
radiation-induced liver disease. Int J Radiat Oncol Biol Phys 2003,
56:229-234.
15. Esiashvili N, Koshy M, Landry J: Intensity-modulated radiation therapy.
Curr Probl Cancer 28:47-84.
16. Mavroidis P, Ferreira BC, Shi C, Lind BK, Papanikolaou N: Treatment plan
comparison between helical tomotherapy and MLC-based IMRT using
radiobiological measures. Phys Med Biol 2007, 52:3817-3836.
17. Dawson LA, Normolle D, Balter JM, McGinn CJ, Lawrence TS, Ten Haken
RK: Analysis of radiation induced liver disease using the Lyman NTCP
model* 1. Int J Radiat Oncol Biol Phys 2002, 53:810-821.
18. Dawson LA, Ten Haken RK, Lawrence TS: Partial irradiation of the liver.
Elsevier 2001:240-246.
Received: 26 April 2010 Accepted: 24 June 2010
Published: 24 June 2010
This article is available from: 2010 Lee et al; licensee BioMed Central Ltd. This is an Open Access article distributed under the terms of the Creative Commons Attribution License ( ses/by/2.0), which permits unrestricted use, distribution, and reproduction in any medium, provided the original work is properly cited.Radiation O ncology 2010, 5:58
Table 5: Delivery time and MU/fr used in HT and SaS-IMRT plans
Group 1-single tumour group Group 2-multiple tumours group
HT SaS-IMRT HT SaS-IMRT
DT (min) MU/fr DT (min) MU/fr DT (min) MU/fr DT (min) MU/fr
Mean ± SD 4.4 ± 1.4 5135 ± 1678 3.3 ± 1.4 343 ± 120 4.7 ± 0.8 5529 ± 960 6.2 ± 1.4 461 ± 242
(range) (2.9-6.3) (3461-7404) (1.9-5.2) (227-577) (3.3-5.7) (3904-6704) (4.8-8.8) (148-698)
Abbreviation: HT: Helical tomotherapy; SaS-IMRT: Step-and-shoot intensity-modulated radiotherapy; DT: delivery time; MU/fr: Monitor units used
per fraction; Patient setup time was not included.
Lee et al. Radiation Oncology 2010, 5:58
/>Page 10 of 10
19. Kang M, Kim M, Kim S, Choi J: High dose radiotherapy for massive
hepatocellular carcinoma (HCC) with intensity-modulated radiation
therapy (IMRT). Int J Radiat Oncol Biol Phys 2009, 75:S281-S281.
20. Jang JW, Kay CS, Bae SH, Choi JY, Jung HJ, You CR, Kim CW, Cho SH, Yoon
SK, Han JY, et al.: 378 Simultaneous multitarget irradiation using helical
tomotherapy for advanced hepatocellular carcinoma with multiple
extrahepatic metastases. Journal of Hepatology 2008, 48:S147-S147.
21. Lawrence JA, Forrest LJ: Intensity-modulated radiation therapy and
helical tomotherapy: Its origin benefits, and potential applications in
veterinary medicine. Vet Clin Small Anim 2007, 37:1151-1165.
22. Lee TF, Fang FM, Chao PJ, Su TJ, Wang LK, Leung SW: Dosimetric
comparisons of helical tomotherapy and step-and-shoot intensity-
modulated radiotherapy in nasopharyngeal carcinoma. Radiother
Oncol 2008, 89:89-96.
23. Mackie TR: History of tomotherapy. Phys Med Biol 2006, 51:R427-453.
24. Han C, Liu A, Schultheiss TE, Pezner RD, Chen YJ, Wong JYC: Dosimetric
comparisons of helical tomotherapy treatment plans and step-and-
shoot intensity-modulated radiosurgery treatment plans in
intracranial stereotactic radiosurgery. Int J Radiat Oncol Biol Phys 2006,
65:608-616.
25. Baltas D, Kolotas C, Geramani K, Mould RF, Ioannidis G, Kekchidi M,
Zamboglou N: A conformal index (COIN) to evaluate implant quality
and dose specification in brachytherapy. Int J Radiat Oncol Biol Phys
1998, 40:515-524.
26. Leung LHT, Kan MWK, Cheng ACK, Wong WKH, Yau CC: A new dose-
volume-based plan quality index for IMRT plan comparison. Radiother
Oncol 2007, 85:407-417.
27. Paddick I: A simple scoring ratio to index the conformity of
radiosurgical treatment plans. J Neurosurg 2000, 93:219-222.
28. Riet Av, Mak ACA, Moerland MA, Elders LH, van der Zee W: A
conformation number to quantify the degree of conformality in
brachytherapy and external beam irradiation: Application to the
prostate. Int J Radiat Oncol Biol Phys 1997, 37:731-736.
29. Yang R, Xu S, Jiang W, Xie C, Wang J: Integral dose in three-dimensional
conformal radiotherapy, intensity-modulated radiotherapy and helical
tomotherapy. Clini Oncol 2009, 21:706-712.
30. Wagman R, Yorke E, Ford E, Giraud P, Mageras G, Minsky B, Rosenzweig K:
Respiratory gating for liver tumors: use in dose escalation. Int J Radiat
Oncol Biol Phys 2003, 55:659-668.
31. Baisden JM, Reish AG, Sheng K, Larner JM, Kavanagh BD, Read PW: Dose
as a function of liver volume and planning target volume in helical
tomotherapy, intensity-modulated radiation therapy-based
stereotactic body radiation therapy for hepatic metastasis. Int J Radiat
Oncol Biol Phys 2006, 66:620-625.
32. Clifford M, Banovac F, Levy E, Cleary K: Assessment of hepatic motion
secondary to respiration for computer assisted interventions.
Computer Aided Surgery 2002, 7:291-299.
33. Nakashige A, Horiguchi J, Tamura A, Asahara T, Shimamoto F, Ito K:
Quantitative measurement of hepatic portal perfusion by
multidetector row CT with compensation for respiratory
misregistration. Bri J Radiol 2004, 77:728.
34. Sterzing F, Sroka-Perez G, Schubert K, Münter MW, Thieke C, Huber P,
Debus Jg, Herfarth KK: Evaluating target coverage and normal tissue
sparing in the adjuvant radiotherapy of malignant pleural
mesothelioma: Helical tomotherapy compared with step-and-shoot
IMRT. Radiotherapy and Oncology 2008, 86:251-257.
35. Kissick MW, Fenwick J, James JA, Jeraj R, Kapatoes JM, Keller H, Mackie TR,
Olivera G, Soisson ET: The helical tomotherapy thread effect. Medical
Physics 2005, 32:1414-1423.
36. Balog J, Holmes T, Vaden R: A helical tomotherapy dynamic quality
assurance. Med Phys 2006, 33:3939-3950.
37. Penagaricano J, Yan Y, Shi C, Linskey M, Ratanatharathorn V: Dosimetric
comparison of helical tomotherapy and gamma knife stereotactic
radiosurgery for single brain metastasis. Radiat Oncol 2006, 1:26.
38. Ling C, Archambault Y, Bocanek J, Zhang P, LoSasso T, Tang G: Scylla and
charybdis: longer beam-on time or lesser conformality-the dilemma of
tomotherapy. Int J Radiat Oncol Biol Phys 2009, 75:8-9.
39. Rahimian J, Chen J, Rao A, Girvigian M, Miller M, Greathouse H:
Geometrical accuracy of the Novalis stereotactic radiosurgery system
for trigeminal neuralgia. J Neurosurg 2004, 101:351-355.
40. Lee TF, Chao PJ, Wang CY, Lan JH, Huang YJ, Hsu HC, Sung CC, Su TJ, Lian
SL, Fang FM: Dosimetric comparison of helical tomotherapy and
dynamic conformal arc therapy in stereotactic radiosurgery for
vestibular schwannomas. Medical Dosimetry . doi:10.1016/
j.meddos.2009.11.005
41. Wu Q, Mohan R, Niemierko A, Schmidt-Ullrich R: Optimization of
intensity-modulated radiotherapy plans based on the equivalent
uniform dose* 1. International Journal of Radiation Oncology* Biology*
Physics 2002, 52:224-235.
42. Gay HA, Niemierko A: A free program for calculating EUD-based NTCP
and TCP in external beam radiotherapy. Physica Medica 2007,
23:115-125.
43. Niemierko A: A generalized concept of equivalent uniform dose (EUD).
Med Phys 1999, 26:1100.
44. Emami B, Lyman J, Brown A, Coia L, Goitein M, Munzenrider JE, Shank B,
Solin LJ, Wesson M: Tolerance of normal tissue to therapeutic
irradiation. International Journal of Radiation Oncology Biology Physics
1991, 21:109.
45. Deasy J, Blanco A, Clark V: CERR: a computational environment for
radiotherapy research. Medical Physics 2003, 30:979.
46. Aoyama H, Westerly DC, MacKie TR, Olivera GH, Bentzen SM, Patel RR,
Jaradat H, Tome WA, Ritter MA, Mehta MP: Integral radiation dose to
normal structures with conformal external beam radiation. Int J Radiat
Oncol Biol Phys 2006, 64:962-967.
47. Sheng K, Molloy JA, Read PW: Intensity-modulated radiation therapy
(IMRT) dosimetry of the head and neck: A comparison of treatment
plans using linear accelerator-based IMRT and helical tomotherapy. Int
J Radiat Oncol Biol Phys 2006, 65:917-923.
48. van Vulpen M, Field C, Raaijmakers CPJ, Parliament MB, Terhaard CHJ,
MacKenzie MA, Scrimger R, Lagendijk JJW, Fallone BG: Comparing step-
and-shoot IMRT with dynamic helical tomotherapy IMRT plans for
head-and-neck cancer. Int J Radiat Oncol Biol Phys 2005, 62:1535-1539.
49. Purdy JA: Dose to normal tissues outside the radiation therapy patient's
treated volume: A review of different radiation therapy techniques.
Health Physics 2008, 95:666.
50. Lee IJ, Seong J, Shim SJ, Han KH: Radiotherapeutic parameters
predictive of liver complications induced by liver tumor radiotherapy.
Int J Radiat Oncol Biol Phys 2009, 73:154-158.
doi: 10.1186/1748-717X-5-58
Cite this article as: Lee et al., Helical tomotherapy for single and multiple
liver tumours Radiation Oncology 2010, 5:58