Báo cáo khoa học: " A 4D IMRT planning method using deformable image registration to improve normal tissue sparing with contemporary delivery techniques" pot
Bạn đang xem bản rút gọn của tài liệu. Xem và tải ngay bản đầy đủ của tài liệu tại đây (6.26 MB, 14 trang )
RESEARCH Open Access
A 4D IMRT planning method using deformable
image registration to improve normal tissue
sparing with contemporary delivery techniques
Xiaoqiang Li, Xiaochun Wang, Yupeng Li and Xiaodong Zhang
*
Abstract
We propose a planning method to design true 4-dimen sional (4D) intensity-modulated radiotherapy (IMRT) plan s,
called the t4Dplan method, in which the planning target volume (PTV) of the individual phases of the 4D
computed tomography (CT) and the conventional PTV receive non-uniform doses but the cumulative dose to the
PTV of each phase, computed using deformable image registration (DIR), are uniform. The non-uniform dose
prescription for the conventional PTV was obtained by solving linear equations that required motion-convolved 4D
dose to be uniform to the PTV for the end-exhalation phase (PTV50) and by constraining maximum inhomogeneity
to 20%. A plug-in code to the treatment planning system was developed to perform the IMRT optimization based
on this non-uniform PTV dose prescription. The 4D dose was obtained by summing the mapped doses from
individual phases of the 4D CT using DIR. This 4D dose distribution was compared with that of the internal target
volume (ITV) method. The robustness of the 4D plans over the course of radiotherapy was evaluated by computing
the 4D dose distributions on repeat 4D CT datasets. Three patients with lung tumors were selected to demonstrate
the advant ages of the t4Dplan method compared with the commonly used ITV method. The 4D dose distribution
using the t4Dplan method resulted in greater normal tissue sparing (such as lung, stomac h, liver and heart) than
did plans designed using the ITV method. The dose volume histograms of cumulative 4D doses to the PTV50,
clinical target volume, lung, spina l cord, liver, and heart on the 4D repeat CTs for the two patients were similar to
those for the 4D dose at the time of original planning.
Keywords: 4D CT, IMRT, treatment planning, respiratory motion, deform
1. Introduction
Implementations of four-dimensional (4D) radiotherapy
based on 4D computed tomography (CT) datasets have
been described by Rietzel et al [1] and Keall [2]. In 4D
radiotherapy, the treatment plan is designed on each 4D
CT image set (i.e., 4D treatment planning), and radia-
tion is delivered throughout the patient’s breathing cycle
(i.e., 4D treatment delivery) , which ensures adequate
coverage of the tumor target without increasing the
treated volume. Because 4D treatment planning
accounts for temporal changes in anatomy, 4D radio-
therapy holds promise as the op timal method for treat-
ing patients. However, 4D radiotherapy currently
requires 4D t reatment delivery, which necessitates
sophisticated device(s) to synchronize the treatment
delivery with the patient’s respiration. Most centers have
the ability to acquire 4D CT images, but they do not
have the ability to perform 4D radiation delivery.
Instead, 4 D CT images are primarily used to define the
internal target volume (ITV), which is essentially the
envelope needed to enclose the target as it moves
throughout the breathing cycle. 4D CT [3-9] provides a
more accurate tumor volume definition since it limits
motion artifacts during CT acquisition, displays the ana-
tomically correct shape and size of the tumor, and
demonstrates respiration-induced motion o f the tumor
and organs at risk. Previous studies using 4D CT data-
sets have mostly been focused on dosimetric verification
to determine if dose distribution planned on one or part
of the 4D CT datasets is adequate to estimate the cumu-
lative dose from all 4D CT datasets [ 1,10]. Few studies
* Correspondence:
Department of Radiation Physics, The University of Texas, MD Anderson
Cancer Center, Houston, Texas 77030, USA
Li et al. Radiation Oncology 2011, 6:83
/>© 2011 Li et al; licensee BioMed Central Ltd. This is an Open Access article di stributed under the terms of the Creative Commons
Attribution License (http://creativec ommons.or g/licenses/by/2.0), which permits unrestricted use, distribution, and reproduction in
any medium, pro vided the original work is properly cited.
have investigated whether the information on anatomic
motion pr ovided by 4D CT can be used to design treat-
ment plans that confer the advantages of 4D treatment
delivery without requiring additional equipment.
In this paper, we describe an effective and practical 4D
treatment p lanning method, which we refer to true 4D
planning (t4Dplan) method, for intensity-modula ted
radio therapy (IMRT) us ing 4D CT datasets to maximize
critical structure sparing. In traditional treatment plan-
ning, the prescribed dose is planned to be distributed
uniformly to the target while minimal dose is delivered
to the surrounding normal structures on the planning
CT under the assumption that the planning CT truly
represents the patient an atomy that will be present dur-
ing treatment. In our t4Dplan method, however, plan-
ning deliberately creates non-uniform dose distribution
in the target (i.e., it creates hot regions along the target’s
directionofmotionontheplanningCT)toachievea
uniform dose distribution in the target and minimal
dose to the surrounding normal structures on the final
4D dose distribution. The difference between the
t4Dplan method and the traditional ITV method is illu-
strated in figure 1. The t4Dplan method does not
require 4D treatment delivery and is solely dependent
on the 4D datasets acquired during the planning pro-
cess. Compared to some other techniques such as
respiratory gating [11], breath hold [12,13] and dynamic
MLC tumor tracking [14-16], the t4Dplan method is
easier to implement in the clinic because it uses the cur-
rent treatment planning and delivery systems.
2. Materials and methods
2.1. t4Dplan
The t4Dplan method, which uses 4D CT datasets,
designs treatment plans as follows:
1. A reference CT dataset is selected from all the 4D
CT da tasets. Usually, an end-of-exhalation phase CT
(i.e., the 50% phase [T50]) is selected as the refer-
ence CT dataset [17] since patients spend more time
at the end of exhalation [18].
2.Thetargetvolume(TV)isoutlinedbasedonthe
reference CT.
3. The motion TV (MTV) is outlined on the refer-
ence CT as th e combined volume of the target at all
phases of the 4D CT datasets (i.e., the MTV is an
envelope enclosing the target as it moves throughout
the breathing cycle).
The t4Dplan metho d calculates a deliverable non-uni-
form dose distribution (i.e., the apparent dose distri-
bution [AppD]) to the MTV. The final 4D dose
distribution is determined by recalculat ing the t4Dplan
on each phase of the 4D CT dataset and creating a
time-averaged cumulative dose distribution based on
deformable image registration (DIR).
For each voxel on the reference CT, the corresponding
voxel on another phase of the CT dataset can be derived
through DIR by transforming the source image (i.e., the
reference CT) to the target image (i.e., another phase of
the CT dataset), such that
υ
j
i
= T
j,ref
× υ
ref
i
,
(1)
where
υ
re
f
i
is the position vector for the ith voxel o n
the referenc e CT, T
j,ref
represents the transform matrix
from the reference CT to the jth phase of the CT data-
set, and
υ
j
i
is the position vector for the corresponding
voxel on the jth phase of the CT dataset for the ith
voxel on the reference CT.
In the current study, to derive the non-uniform do se,
we first assumed that the dose on each phase of the 4D
CT was approximately the same as the AppD on the
reference CT. This approximation assumes the internal
movement of anatomy will not impact the dose distri-
bution and is a good approximation for photon dose
calculation. It should be noted that this approximation
is only used in the derivation of a non-uniform dose
prescription. For the final designed plan, we used the
exact 4D dose calculation without this approximation.
The 4D dose for each voxel on the reference CT can be
approximated as the time-averaged cumulative dose of
the corresponding voxel on all phases in the CT dataset,
such that
D
4D
(υ
ref
i
)=
1
K
K
j
=1
D
AppD
(υ
j
i
)
,
(2)
where K r epresents the number of phases o f the CT
datasets,
D
4D
(υ
ref
i
)
isthe4Ddosefortheith voxel on
the reference CT, and
D
AppD
(υ
j
i
)
is the AppD for the
corresponding voxel on the j th phase of the dataset.
Assuming the MTV and TV on the reference CT have
n and m (n >m) voxels, respectively, and the AppD
values for the n voxels of the MTV are D
1
, D
2
, , D
n
,
the 4D dose distribution for the TV with m voxels can
be determined using the following linear equations
derived from equation (2):
D
4D
(υ
ref
1
)=
1
K
(D
AppD
(υ
1
1
)+D
AppD
(υ
2
1
) + + D
AppD
(υ
K
1
)) = D
0
,1
st
voxel;
D
4D
(υ
ref
2
)=
1
K
(D
AppD
(υ
1
2
)+D
AppD
(υ
2
2
) + + D
AppD
(υ
K
2
)) = D
0
,2
nd
voxel;
D
4D
(υ
ref
m
)=
1
K
(D
AppD
(υ
1
m
)+D
AppD
(υ
2
m
) + + D
AppD
(υ
K
m
)) = D
0
, mth voxel
,
(3)
where
D
AppD
(υ
j
i
)=D
1
, D
2
,
.
,orD
n
,arethe
unknown parameters, and D
0
is the uniform dose pre-
scribed to the TV (i.e., the final 4D dose distribution on
the TV). Here, we have n unknown parameters (i.e., D
1
,
Li et al. Radiation Oncology 2011, 6:83
/>Page 2 of 14
D
2
, , D
n
) that need to be derived from m equations,
with m <n. The solution for equation group (3) is
underdete rmined. In order to clarify the idea how the
linear equations are constructed and the non-uniform
dose distribution is derived more clearly, we used a sim-
ple phantom (shown in figure 2) to illustrate. This phan-
tom shown in figure 2(a, b, c, d) had 4 phases, the MTV
had 4 voxels (voxel 1-4), the TV had 2 voxels (shadow
area). So the linear equation s were constructed by 4D
dose convolution of each TV voxel as follows:
D
4D
(υ
ref
1
)=(
1
4
D
1
+
1
2
D
2
+
1
4
D
3
)=D
0
,1
st
TV voxel;
D
4D
(υ
ref
2
)=(
1
4
D
2
+
1
2
D
3
+
1
4
D
4
)=D
0
,2
nd
TV voxel
;
(4)
Uniform dose with larger
area
Non-uniform dose with hot
regions(HRs) and cold
regions(CRs)
(a)
(b)
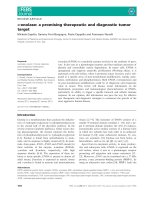
Figure 1 The difference between (a) t4Dplan method and (b) traditional ITV method. The planning target volume (PTV) in the ITV method
is the target volume used to plan and treat. In the t4Dplan method, the PTV50 plus the hot regions (HRs) are the target volume used to plan
and treat. The cold regions (CRs) in the t4Dplan method represent the reduced treated volume relative to that in plans from the ITV method.
CTV represents the clinical target volume; GTV represents gross tumor volume; IGTV represents internal gross tumor volume.
Li et al. Radiation Oncology 2011, 6:83
/>Page 3 of 14
(a)
(e) (f)
(b) (c) (d)
(g) (h)
(
i
)(j)
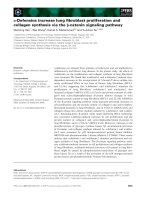
Figure 2 A phantom with tumor volume (shadow area) moving only in superior-inferior direction was illustrated to show how the
non-uniform dose distribution was derived. The moving circle was divided into 4 phases (a), (b), (c), (d). The non-uniform prescribed dose
distribution derived by the t4Dplan method was shown on (e) and its corresponding 4D dose was shown on (f) by summing the dose for 4
phases evaluated on (b). The prescribed dose for ITV approach (g) and the 4D dose (f). The non-uniform dose distribution acquired for t4Dplan
with the total variation regulation from formula (5) was shown in (i) and its corresponding 4D dose (j).
Li et al. Radiation Oncology 2011, 6:83
/>Page 4 of 14
Since the linear equations had 4 unknown parame ters
and only 2 equations, it was undetermined. One of the
solutions can be acquired by applying an extra con-
straint, which implied the smallest margin (D
1
= D
4
=
0), and was shown figure 2(e). The corresponding 4D
dose referenced on the second phase (figure 2(b)) was
calculated and shown on figure 2(f). Compared to the
ITV approach, distributing uniform prescribed dose to
all the voxels (figure 2(g)), resulting 4D dose (figure 2
(h)) when accumulating for all phases, the non-uniform
dose distribution clearly decreased the margin, spared
the critical organ while maintaining the same target cov-
erage (figure 2(f) vs figure 2(h)).
The non-uniform dose as shown is figure 2(e) was an
ideal prescribed do se, assuming the dose can be deliv-
ered for this pattern. In reality, when delivering a high
dose to a specific voxel, it is impractical to achieve a
very low dose in the nearby voxels due to the dose fall-
off gradient. For this reason, one possible AppD can be
acquired by minimizing the following objec tive function
with a total-variation regulation [19]:
X =
n
i
D
AppD
(υ
ref
i
)+λ
n
i
(D
AppD
(υ
ref
i
) − D
AppD
(υ
ref
i−1
))
2
,
(5)
subject to (2) : D
4D
(υ
ref
i
)=
1
K
K
j=1
D
AppD
(υ
j
i
) ≥ D
0
,
120% × D
0
≥ D
i
≥ 0, D
i
= D
1
, D
2
, , D
n
,
(6)
where n is the total number voxels of MTV on the
reference CT dataset. The parameter l is the impor-
tance factor to penalize t he second term of (5) which
calculates the sum of absolute derivatives. The penalty
tends to have zero derivatives and smoothes the voxels’
prescribed doses for easy delivery. The formula (6) con-
strains the maximum inhomogeneity to be 20%. The
reason is that when we create the apparent plan with
designed h ot region, we want the apparent plan not to
be too hot. In our routine clinica l practice, our clinician
sometimes also accepts the plan 20% hot in the PTV,
therefore, the plan can be readily used in the routine
clinical practice. For the phantom in figure 2, the solu-
tion to minimize equation (5) was shown in figure 2(i).
Compared to the ideal solution (figure 2(e)), the solution
with the total-variation regulation blurred the non-uni-
form dose and created a more natural dose fall-off,
which became practical for deliverable optimization.
The corresponding non-uniform 4D dose, as shown in
figure 2(j), still had enough dose coverage to the target
and more normal tissue sparing than that of the ITV
approach (figure 2(j) vs figure 2(h)).
The derived AppD for the MTV served as the non-
uniform dose pre scription for the MTV. The deliverable
AppD can be obtained using an IMRT optimization
system. The voxel-based optimization function wa s used
to achieve the AppD for the MTV on referen ce CT,
such that
f =
n
i
=1
(D(υ
ref
i
) − D
AppD
(υ
ref
i
))
2
,
(7)
In other words, the derived AppD for the MTV
becomes the optimization objective for the MTV. The
Pinnacle t reatment planning system (version 8.1x, Phi-
lips Medical Systems, Milpitas, CA) was used as the
platform for IMRT optimization. The in-house-devel-
oped plug-in module, which optimizes the dose distribu-
tion to achieve the derived AppD for the MTV using
equation (7), cooperates with the Pinnacle IMRT opti-
mization system to achieve the final deliverable AppD
on the reference CT, which results in a uniform dose to
the TV and minimal dose to the surro unding critical
structures for 4D dose distribution. In our implementa-
tion, only the objective function (7) was added to the
Pinnacle inverse planning module as a plug-in. The con-
ventional objectives that are not voxelized can still be
used to control normal tissue sparing and targe t cover-
age. From the treatment planner’s point of view, our
method is an enhancement of the current planning
method. This implementation makes our method readily
available for use in routine clinical practice.
Once treatment optimization based on the AppD was
obtained, the dose on each 4D CT was rec alculated and
the 4D dose distribution obtained by using DIR.
2.2. Evaluation of t4Dplan method
Three patients with tumor located in the middle lobe of
the right lung (patient 1), near the diaphragm of the left
lung (patient 2) and near the diaphragm of the right
lung (patient 3) respectively were selected for our eva-
luation of the t4Dplan method. The characteristics of
the three patients were listed in Table 1. All patients
hadbeenenrolledonaninstitutionalreviewboard
approved protocol and treated at The University of
Texas MD Anderson Cancer Center. According to the
protocol, the 4D CT datasets for each patient had been
acquired in 2.5-mm slices using a multislice CT scanner
(Discovery ST, General Electric Healthcare Systems,
Waukesha, WI) and the Real-Time Position Manage-
ment (RPM) respiratory gating system (Varian Medical
Systems, Palo Alto, CA). Ten CT datasets corresponding
to the 10 phases in each equally divided respiration
cycle (from the 0% phase, referred as the T0 CT, to the
90% phase, referred as the T90 CT) were reconstructed
[20] for each 4D dataset. The end-of-exhalation phase
CT (i.e., T50 CT) da taset from the 4D dataset acquired
during simulation was selected as the reference and
planning CT set. The TV was defined as the planning
Li et al. Radiation Oncology 2011, 6:83
/>Page 5 of 14
treatment volume (PTV) on the reference CT (i.e.,
PTV50), which was generated by defining the gross
tumor volume (GTV) on the reference CT and then
expanding t he GTV by 8 mm to obtain the clinical TV
(CTV) on the reference CT (i.e., CTV50) and by another
8-mm to obtain the PTV50. The MTV was defined as
the PTV that was generated by a 16-mm expansion of
the combined volume of the GTVs at all 10 phases,
named the internal GTV (IGTV), i.e., 8-mm expansion
of the IGTV to obtain the ITV and another 8-mm
expansion of the ITV to obtain the PTV. The margins
to expand from IGTV to ITV and ITV to PTV are cur-
rently adopted as the standard for the thoracic patients
in our institution [21]. The prescription spe cified that
the4Ddose(i.e.,D
0
)of63Gycoversatleast95%of
the PTV50 on the reference CT.
The t4Dplan method was used to design the treatment
plans for all patients. The non-uniform AppD for t he
PTV was derived from equations (3), (5), and (6), and
the deliverable AppD was achieved by optimization
using equation (7). The clinical treatment plan for all
patients had b een designed by our experienced dosime-
trists based on the commonly used ITV method (i.e.,
the IMRT plan was designed to have uniform dose dis-
tribution to the PTV and minimal dose to normal tis-
sues.). In this study, we re-optimized those plans and
found that those plans could not be improved upon to
our best effort and knowledge. To compare the plan
based on the t4Dplan method with the plan based on
the ITV method, t he dose volume histograms (DVHs)
for the PTV50 and normal structures (i.e., total lun g,
stomach, liver, spinal cord, and heart) were calculated
based on deliverable AppD and 4D dose distribution. To
assess plan quality with respect to target dose, we com-
puted the conformity number (CN) for the PTV50 using
the following definition [22]:
CN =
TV
Dp
TV
×
TV
Dp
V
D
p
,
(8)
where TV
Dp
is the TV covered by the prescribed dose
and V
Dp
is the total volume enclosed by the prescription
isodose surface. The CN ranges from 0 to 1, and the
greater the CN, the better the prescribed dose’sconfor-
mation to the target. A small CN indicates that either
the target is not well covered by the prescribed dose
(the first fraction of the equation) or the total volume of
tissue receiving the prescribed dose was very large com-
pared to the target (the second fraction of the equation).
The ratio ( R
prescribed_dose
) of the prescribed dose
volume in 4D dose distribution (V
4D
) and deliverable
AppD (V
AppD
) was calculated for plans derived from
both the t4Dplan meth od and the ITV method for each
patient to show the dosimetric effects of respiration-
induced organ motion:
R
prescribed dose
=
V
4D
V
A
pp
D
.
(9)
2.3. Robustness of the t4Dplan method against
interfractional variation of the respiratory pattern
To evaluate the robustness of t4Dplan method against
the irregular breathing motion pattern, patient 2 and 3
were used. Since for these patients, not only 4D-CT
were obtained during simulation to allow consideration
of tumor motion in planning, but also several repeat4D
CTs were obtained to assess the intra- and inter-frac-
tional movement of the target volumes and the normal
structures. One repeat 4D CT datasets acquired during
week 2 of treatment for patient 2 and week 3 for patient
3 were selected to ev aluate the robustne ss of the
t4Dplan against inter-fractional variation in the respira-
tory pattern. Figure 3 shows the right-left (RL), anterior-
posterior (AP), and SI shifts of the GTV on each phase
(i.e., T0, T10, ) relative to the T50 phase for both the
simulation CT and repeat CT for patient 2. The repeat
4D CTs were also registered to the simulation 4D data-
set using bony structures, and figure 4 shows the ana-
tomic c hanges between coronal CT images obtained at
simulation and week 2 f or patient 2. Both figures 3 and
4 demonstrate the irregularity of breathing motion dur-
ing fractional radiation treatments.
To evaluate whether the non-uniform dose presc rip-
tion derived solely on the 4D simulation CT could still
provide good target coverage and normal tissue sparing
if the breathing pattern was irregular during fractional
treatments, we recalculated the AppD in each phase of
the repeat 4D datasets based on the plans designed
using simulation CT and bony registration. The 4D dose
distribution was cumulated and displayed on the refer-
ence CT (T50) of the repeat CT. The DVHs for the
PTV50 and normal structures were calculated based on
Table 1 Characteristics of the three patients used in the study.
Patient GTV50 (cm
3
) PTV (cm
3
) Center-to-center tumor motion (cm) Primary tumor motion direction Prescribed dose (fxs × Gy/fx)
1 61.14 481.15 2.65 S-I 35 × 1.8
2 156.9 878.7 1.53 S-I 35 × 1.8
3 218.108 1204.06 3.42 S-I 35 × 1.8
Abbreviations: fx(s) = fraction(s)
Li et al. Radiation Oncology 2011, 6:83
/>Page 6 of 14
the 4D dose distributions to show the effects of inter-
fractional variation in the respiratory pattern of the
patient in the t4Dplan method.
3. Results
3.1. Theoretic and deliverable AppD
Figure 5 shows the theoretic and deliverable AppD for
patient 1 (figures 5(a) and 5(b)), patient 2 (figures 5(c)
and 5(d)) and patient 3 (figures 5(e) and 5(f)). The theo-
retic AppD hot regions (i.e., 70 Gy, red color-wash on
figure 5(a), (c) and 5(e)) for the PTV were located infer-
ior to the PTV50 for all pat ients. Tumor motion in SI
direction was 2.6 cm for patient 1, 1.5 cm for patient 2
and3.31cmforpatient3;motioninAPdirectionwas
0.2 cm for patient 1 and 2, 0.85 cm for patient 3; and
motion in RL direction was 0.5 cm for patient 1, 0.2 cm
for patient 2. The SI direction was the dominant direc-
tion of tumor motion for all patients, which resulted in
the hot regions of theoretic AppD appearing along the
SI direction.
The optimized deliverable AppD was similar to the
theoretic AppD for all patients, with the hot regions (i.e.
70 Gy isodose line in figure 5(b), figure 5(d) and figure
5(f)) mainly located inferior to the PTV50. The more
similar the deliverable AppD was to the theoretic AppD,
themoreuniformthe4Ddosedistributionwasinthe
PTV50 on the reference CT.
3.2. Normal-structure sparing in the t4Dplan method
Table 2 lists all the dosimetric indices for the 4D dose
distributions calculated using the t4Dplan me thod and
ITV method for all three patients. Since the tumor
located in the middle lobe of the right lung for patient
1, the total lung sparing was significant using t4Dplan
method compared to ITV method. For other two
patients, as tumor located in the lower lobe of lung near
the diaphragm and close to stomach (patient 2) or liver
(patient 3), significant dose reduction for stomach and
liv er were obser ved using t4Dplan method compared to
ITV method, respectively. And the total lung sparing
was comparable u sing two methods. The reduction of
the mean dose of heart of 4D dose distributions for all
the three patients using t4Dplan method, were 3 Gy, 0.4
Gy and 0.2 Gy, respectively, from that using ITV
method. The maximum cord dose of 4D dose distribu-
tions for patient 1 was slightly higher using t4Dplan
method than that using I TV method, but far lower than
cord tolerate dose (i.e. 45 Gy).
Simulation CT
Repeat CT
Figure 3 The GTV motion on the simulation CT datasets (solid line) and repeat CT datasets (dashed line) for 10 phases of the
respiratory cycle relative to the T50 phase in the right-left (RL) direction (blue color), anterior-posterior (AP) direction (red color), and
superior-inferior (SI) direction (green color) for patient 2.
Li et al. Radiation Oncology 2011, 6:83
/>Page 7 of 14
The PTV50 coverage by the 63 Gy prescribed dose
(V63) for 4D dose distribution using the t4Dplan
method was inferior to the coverage obtained using the
ITV method f rom table 2. However, the CN for all
patients using the t4Dplan method was signifi cantly bet-
ter than the CN of the ITV method. It indicates that the
ITV method overestimated the T V. In other words, the
ITV method overestimates the dose effect of respira-
tion-induced target motion. Consequently, a l arge
volume of normal tissue will be unneces sarily irradi ated
if the ITV method is used.
Figure 6 shows the 4D dose distributions calculated
using the t4Dplan method and ITV method for the
three patients respectively. The high-dose isodose lines
(such as 63 Gy and 60 Gy) sprea d out especially in
inferior direction for ITV method and conformed to the
target very well for t4Dplan method. The low-dose iso-
doselinepushedoutslightlyfromtargetforITV
method compared to t4Dpaln method. It illustrates
more normal tissue sparing using t4Dplan method than
ITV method.
The R
63
which is the ratio of volume greater than or
equal to 63 Gy (prescription) of 4D cumulative dose dis-
tribution to apparent dose distribution is listed in table
2. They were all less than 1, meaning that target motion
effectively smears the dose and reduces the high-dose
volume. Comparing deliverable AppD and 4D dose dis-
tributions (i.e., figu re 5(b) vs figure 6(a) for patient 1,
figure 5(d) vs figure 6(c) for patient 2 and figure 5(f) vs
figure 6(e)), it shows the prescribed isodose line (i.e., 63
Gy) on the 4D dose distribution was pushed in the
superior direction and that it conformed well to the
PTV50 (figures 6(a), (c) and 6(e)), since the dominant
motion of the target was in the SI direction; ho t regions
(i.e., ≥70 Gy) were smeared out and significantly smaller
on 4D dose distribution than that on the deliverable
AppD. On the contrary, ITV method overestimated t he
target motion and the prescribed isodose line in ITV
method enclosed many healthy lung tissue s (figure 6(b),
(d) and 6(f)). This fact is also reflected in CN index.
Since respiratory motion effectively reduces the
volume receiving a high dose, as mentioned a bove, it
may cause under dosing in the target if the plan is not
designed to compensate for the motion-induced effects.
Conversely, r espiratory motion will create a more uni-
form target dose than designed if the plan is designed to
compensate for the motion-induced effects.
3.3. Robustness of the t4Dplan method
Figure 7 shows the DVHs and 4D dose distributions cal-
culated on the simulation CT and repeat CT datasets for
patient 2 and 3 (there was no 4D repeat CT available for
patient 1). The coverage of CTV50 and PTV50 on the
repeat CT was as good as that on the simul ation CT for
patient 2 and a little better than that on the simulation
CT for pa tient 3. The DVHs of the normal st ructure s
were similar between the two dis tributions from simula-
tion CT and repeat CT for both patients. This result
indicates that there were essentially no significant
changes in dose distribut ion for the plan designed using
the t4Dplan even if there are some irregularities of
respiration pattern for the patient from week to week.
The stomach received fewer doses during week 2 of the
treatment because volume of stomach was reduced dur-
ing week 2 for patient 2. In other words, the t4Dplan
(a)
(
b
)
Simulation CT
Repeat CT
Figure 4 Changes of GTVs (red color-wash) and other anatomic
structures on coronal view of (a) simulation CT datasets and
(b) repeat CT datasets for patient 2.
Li et al. Radiation Oncology 2011, 6:83
/>Page 8 of 14
method is robust against inter-fractional variation in the
respiratory pattern.
3.4. Planning time for t4Dplan
Currently, the t4Dplan was implemented as a plug-in to
Pinnacle (8.1x), which runs on an AMD Opteron 8220
CPU operating at 2800 MHz with an i 387-compatible
floating-point operation processor. It took less than 10
minutes to generate the DIR, and another 5 minutes to
generate t he non-uniform prescrib ed dose distribution.
After the plan was optimized, it took 3 minutes to gen-
erate the 4D dose from the apparent dose.
Patient 1
Theoretic AppD
Deliverable AppD
(a) (b)
Theoretic AppD Deliverable AppD
Patient 2(c) (d)
63 Gy
60 Gy
45 Gy
20 Gy
10 Gy
5 Gy
70 Gy
Theoretic AppD Deliverable AppD
Patient 3(e) (f)
Figure 5 The theoretic and deli verable AppDs for patient 1 shown on panel (a) and pa nel (b), for patient 2, show n on panel (c) and
panel (d) and for patient 3, shown on panel (e) and panel (f) respectively. The red and green color-wash on panel (a), (c) and (e) represent
hot region (i.e. 70 Gy) and cold region (i.e. 30 Gy for patient 1 and 3, 50 Gy for patient 2) respectively for theoretic AppD. The blue color-wash
on all the panels represents PTV50. The orange color-wash on (d) represents the stomach for patient 2.
Li et al. Radiation Oncology 2011, 6:83
/>Page 9 of 14
4. Discussion
Our findings sugge st that the t4Dplan method i s an
effective means of treatment planning, with features that
make it sup erior to the ITV metho d, which currently is
the most common strategy implemented clinically to
compensate for respiration-induced target motion.
Essentially, the t4Dplan method uses a smaller PTV
while designing a heterogeneous target dose distribution
for the planning CT. Because the t4Dplan method
acco unts for the effects of respiratory motion by adjust-
ing dose within the target, the margin can be reduced
relative to that in the ITV method plan, leading to more
normal structures sparing. The rationale for the t4Dplan
technique is as follows: 4D CT shows that all phases
from T30 to T 70 are usually similar to the T50 phase,
which indicates that patients spent more time in the
end-exhalation phase than in any other, that is, the
tumor stays around the T50 position for a long period,
while it remains at other positions, such as T0, for only
short periods. The ITV method envelopes the tumor
location in 10 phases to generate the treatment target,
which means it weights the time that the tumor is in its
T0 position the same as the time it is near its T50 posi-
tion. The consequence is that the planned dose to the
tumor’s location around the T0 phase may be delivered
to normal structures mo st of the time since the target
moved out of the planned position most of time. The
strategy of the t4Dplan method is to deliver a smaller
dose to the tumor when the tumor is at its T0 position
and then deliver higher doses to the tumor when it is
close to its T50 position, which will compensate for the
underdosing at the T0 position. In this way, normal
structure sparing is maximized as the free-breathing
patient undergoes radiotherapy.
Methods of designing treatment pla ns with non-uni-
form dose distributions to achieve better normal tissue
sparing have been tested by several groups. For example,
Li et al [23] used a simplified 4D dose calculation
method to design a treatment plan with non-uniform
dose. This method will only provide a treatment plan
with non-uniform dose distribution. The simplified 4D
dose calculation method used by Li et al (2006) directly
convolves the 3D dose distribution with a probability
distribution of the tumor over the breathing cycle and
therefore does not accurately reflect the effects of
breathing mot ion on the dose distribution. In t4Dplan
method, the non-uniform target dose in the planning
CT datas et is the apparent dose in the target, while the
4D dose is essentially uniform. The final result pre-
sented to the radiation oncolo gist yields a uniform dose
distribution, and the plan is easily adopted by most
practitioners. As the current report shows, the t4Dplan
method can be readily implemented in the treatment
planning system. We expect that this method will be
readily adopted in centers where 4D CT scanners and
related treatment planning systems are already available.
Other 4D planning approaches which designed the
plans on mid-ventilation, mid-position scan or maxi-
mum- and minimum-intensity projection to account for
the organ motion have been extensively studied by
Wolthaus [24], Cuijipers [25] and Guckenberger [26].
According to their studies, a good dose coverage was
still obtained even if the tumor was only fully within the
prescribed iso-dose line during a small part of the
breathing cycle. Therefore, a better normal tissue spar-
ing was achieved compared to the ITV approach that
overestimated the margins necessary for the breath
motion. The t4Dplan which designs the non-uniform
dose agrees with those previous studies. Cuijipers et al
(2010) proposed to use a dosimetric margin, 80% iso-
dose line of the prescribed dose which fully covers the
PTV, to reduce margin compared to ITV approach. The
coverage of 80% dose to the PTV for the three patients
using t4Dplan was 91%, 96% and 90% respectively. Con-
sidering the fact that our t4Dplan is a motion adapted
plan, in whic h the instantaneous hot and cold spots in
the dose distribution delivered during various phases of
the target motion are specially designed to compensate
each other, the dosimetric margin derived using our
approach is even smaller than that proposed by
Table 2 Dosimetric indices of normal structures and
PTV50 for 4D dose distributions calculated using the
t4Dplan method and the ITV method for the three
patients.
Parameters Patient 1 Patient 2 Patient 3
t4DPlan ITV t4DPlan ITV t4Dplan ITV
Total
lung
V5 (%) 55.4 63.9 32.2 32.7 41.0 42.5
V10 (%) 30.2 35.7 24.2 25.4 25.0 26.2
V20 (%) 19.1 24.3 20.7 21.7 17.3 18.2
V30 (%) 14.8 19.8 18.3 17.6 13.0 13.4
Mean (Gy) 13.2 16.3 12.8 12.9 11.3 11.8
Spinal
cord
Max (Gy) 30.1 26.3 31.6 32.3 34.0 38.0
Heart Mean (Gy) 10.8 13.4 23.8 24.2 18.8 19.0
Stomach V40 (%) 8.2 21.4
V50 (%) 2.6 10.6
Max (Gy) 54.1 62.3
Mean(Gy) 19.3 27.3
Liver V30(%) 28.3 42.1
Mean (Gy) 22.8 31.3
PTV50 V63 (%) 98 99.3 96.4 98.0 95.1 97.0
CN 0.74 0.57 0.91 0.78 0.81 0.67
R
63
0.94 0.99 0.94 0.97 0.91 0.94
Abbreviations: R
63
= ratio of volume greater than or equal to 63 Gy of 4D
dose distribution to AppD; CN = conformity number; Vx = the volume of
structures received dose >x Gy; Max = Maximum.
Li et al. Radiation Oncology 2011, 6:83
/>Page 10 of 14
(b)(a)
t4Dplan ITV
Patient 1
t4Dplan
ITV
;ĐͿ
;ĚͿ
Patient 2
63 Gy
60 Gy
45 Gy
20 Gy
10 Gy
5 Gy
70 Gy
t4Dplan
;
Ğ
Ϳ
ITV
;
Ĩ
Ϳ
Figure 6 4D dose distributions calculated using the t4Dplan method for (a) patient 1, (c) patient 2 and ( e) patient 3, and the ITV
method for (b) patient 1, (d) patient 2 and (f) patient 3. The blue color-wash represents the PTV50. The orange color-wash represents
stomach.
Li et al. Radiation Oncology 2011, 6:83
/>Page 11 of 14
70 Gy 63 Gy 60 Gy 45 Gy
20 Gy 10 Gy 5 Gy
Patient 2
DVH
Repeat
(a) (b)
Patient 3
DVH Repeat
(c) (d)
Figure 7 (a) DVHs from 4D dose distribution calculated using the t4Dplan method on the simulation CT (solid li ne) and repeat CT
(dashed line) for (a) patient 2 and (c) patient 3;4D dose distribution images calculated using the t4Dplan method on the repeat CT
for (b) patient 2 and (d) patient 3. The blue color-wash represents the PTV50. The orange color-wash represents stomach.
Li et al. Radiation Oncology 2011, 6:83
/>Page 12 of 14
Cuijipers. In this sense, the t4Dplan is a further
improvement. One major difference between ours and
other works is that, although PTV is underdosed in the
apparent dose distribution, PTV50 is adequately covered
in 4D dose. Evaluating the coverage of PTV50 and nor-
mal tissue sparing on 4D dose distribution is much
more easily accepted by physicians and a natural transi-
tion from ITV approach to the t4Dplan approach.
Our t4Dpl an method essentially converts the 4D plan-
ning problem to a dose-painting problem based on 4D
anat omic information. Currently, the dose-painting pro-
blem is a subject of intense research in the radiotherapy
community [27-32]. The robustness of plans designed
bydose-paintingalgorithmsiswidelyrecognizedasa
major ch allenge to advancing the technique [33]. In our
study, we recalculated the plan designed using the simu-
lation 4D CT by using a repeat 4D CT that exhibited
the irregularity of b reathing motion to test the robust-
ness of our method. We found that our method is rela-
tively robust against the irregula rity of breath ing motion
for t he two patients. One explanation is that o ur
method did not require “exact” dose painting of the vox-
elized dose prescription. As shown in figure 5(a), (c) and
5(e),aslongasthehotregionswere“painted,” the
underdose due to the smaller margin would be co mpen-
sated f or. The other explanation was pointed by Cuiji-
pers et al. (2010). T here are two uncertainties affec ting
the robustness of any 4D planning method: 1) the inter-
fractional variability of tumor motio n due to the
changes of the tumor motion in the breathing pattern of
the patient and 2) and changes in the mean tumor posi-
tion and tumor volume during the course of the treat-
ment. As realized by Cuijipers et al. (2010) for breathing
amplitude of 15 mm, a 30% change in amplitude corre-
sponds to a change in a breathing margin of about 1
mm, implying that the impact of the first uncer tainties
is expected to be small. The second uncertainty is also
small for most patients [25] and is also not considered
in the PTV/ITV approach.
Other techniques, such as respiratory gating a nd
breath hold, also showed critical organ sparing com-
pared to ITV approach [34,35]. But for those patients
who could not comply with the breath hold technique,
our t4Dplan method and respirato ry gating may be the
good candidates to treat. Compared to the gating
method, the t4Dplan does not require 4D delivery,
instead, delivers the dose continuously and saves a lot of
beam time, with the price of increasing around 15 min-
utes in the planning time. Considering the current treat-
ment planning which required many rounds of trial and
error, the increase in planning time is almost negligible.
Although we demonstrate d that our method was rela-
tively robust using two patients as an example, in
the clinical practice adopting our method, a motion
monitoring protocol and adaptive planning strategy are
suggested to ensure the target was adequately covered.
For example, the 4D repeat CT should be taken and the
robustness of the plan should be checked using t he
same approach for patients 2 and 3. If the tar get was
found not adequately to be covered due to irregular
breathing pattern, the new adaptive plan should be
designed based on the new repeat 4D CT.
Of note, the three patient datasets used in this study
illustrate the t4Dplan method as well as demonstrate
the effectiveness and robustness of t4Dplan method. A
study of applying this meth od to a cohort of patients is
undergoing and summary of the study will be presented
in near future.
5. Conclusions
The t4Dplan method is an effective and practical
method for designing 4D treatment plans for tumors
subject to respira tory motion. The t4Dplan method cre-
ates plans that permit better sparing of the normal
structures than the commonly used ITV method, which
overcompensates for the dosimetric effects of respira-
tion-induced motion to the target. The t4Dplan method
does not require 4D treatment delivery and therefore
can be readily adopted in centers where 4D CT scan-
ning is already available.
Acknowledgements
The authors thank Karl Bzdusek and Michael Kaus from Philips Medical
Systems for technical support on the research version of the Pinnacle
3
treatment planning system (8.1x). We thank Professor John Wong from John
Hopkins University for spurring us the idea of using non-uniform dose
distribution to design 4D lung treatment plan during his visit at MD
Anderson. We also want to thank Professor Robert Jeraj from the University
of Wisconsin for the helpful discussion on the robustness of dose-painting
problems during his visit at MD Anderson this year. This work was presented
at the fifty-first conference of the American Association of Physicists in
Medicine as a moderated poster discussion. This work is partially supported
by NIH grant 16672.
Authors’ contributions
All authors read and approved the final manuscript. XZ originated the idea,
XL and XW carried out all the CT evaluation, target delineation. XL also
drafted the manuscript. XL and YL contributed to the acquisition of the data
and the plan optimization. XW and XZ contributed to the final version of
the manuscript.
Competing interests
The authors declare that they have no competing interests.
Received: 4 May 2011 Accepted: 19 July 2011 Published: 19 July 2011
References
1. Rietzel E, Chen GTY, Choi NC, Willet CG: Four-dimensional image-based
treatment planning: Target volume segmentation and dose calculation
in the presence of respiratory motion. International Journal of Radiation
Oncology Biology Physics 2005, 61:1535-1550.
2. Keall P: 4-dimensional computed tomography imaging and treatment
planning. Seminars in Radiation Oncology 2004, 14:81-90.
3. Keall PJ, Mageras GS, Balter JM, Emery RS, Forster KM, Jiang SB,
Kapatoes JM, Low DA, Murphy MJ, Murray BR, et al: The management of
Li et al. Radiation Oncology 2011, 6:83
/>Page 13 of 14
respiratory motion in radiation oncology report of AAPM Task Group 76.
Medical Physics 2006, 33:3874-3900.
4. Low DA, Nystrom M, Kalinin E, Parikh P, Dempsey JF, Bradley JD, Mutic S,
Wahab SH, Islam T, Christensen G, et al: A method for the reconstruction
of four-dimensional synchronized CT scans acquired during free
breathing. Medical Physics 2003, 30:1254-1263.
5. Mageras GS, Pevsner A, Yorke ED, Rosenzweig KE, Ford EC, Hertanto A,
Larson SM, Lovelock DM, Erdi YE, Nehmeh SA, et al: Measurement of lung
tumor motion using respiration-correlated CT. International Journal of
Radiation Oncology Biology Physics 2004, 60:933-941.
6. Trofimov A, Rietzel E, Lu HM, Martin B, Jiang S, Chen GTY, Bortfeld T:
Temporo-spatial IMRT optimization: concepts, implementation and initial
results. Physics in Medicine and Biology 2005, 50:2779-2798.
7. Werner R, Ehrhardt J, Frenzel T, Saring D, Lu W, Low D, Handels H: Motion
artifact reducing reconstruction of 4D CT image data for the analysis of
respiratory dynamics. Methods of Information in Medicine 2007, 46:254-260.
8. Wolthaus JWH, Schneider C, Sonke JJ, van Herk M, Belderbos JSA,
Rossi MMG, Lebesque JV, Damen EMF: Mid-ventilation CT scan
construction from four-dimensional respiration-correlated CT scans for
radiotherapy planning of lung cancer patients. International Journal of
Radiation Oncology Biology Physics 2006, 65:1560-1571.
9. Yamamoto T, Langner U, Loo BW, Shen J, Keall PJ: Retrospective Analysis
of Artifacts in Four-Dimensional CT Images of 50 Abdominal and
Thoracic Radiotherapy Patients. International Journal of Radiation Oncology
Biology Physics 2008, 72:1250-1258.
10. Kang YX, Zhang XD, Chang JY, Wang H, Wei X, Liao ZX, Komaki R, Cox JD,
Balter PA, Liu H, et al: 4D proton treatment planning strategy for mobile
lung tumors. International Journal of Radiation Oncology Biology Physics
2007, 67:906-914.
11. Shimizu S, Shirato H, Ogura S, Akita-Dosaka H, Kitamura K, Nishioka T,
Kagei K, Nishimura M, Miyasaka K: Detection of lung tumor movement in
real-time tumor-tracking radiotherapy. International Journal of Radiation
Oncology Biology Physics 2001, 51:304-310.
12. Remouchamps VM, Vicini FA, Sharpe MB, Kestin LL, Martinez AA, Wong JW:
Significant reductions in heart and lung doses using deep inspiration
breath hold with active breathing control and intensity-modulated
radiation therapy for patients treated with locoregional breast
irradiation. International Journal of Radiation Oncology Biology Physics 2003,
55:392-406.
13. Yorke ED, Wang L, Rosenzweig KE, Mah D, Paoli JB, Chui CS: Evaluation of
deep inspiration breath-hold lung treatment plans with Monte Carlo
dose calculation. International Journal of Radiation Oncology Biology Physics
2002, 53:1058-1070.
14. Suh YL, Weiss E, Zhong HL, Fatyga M, Siebers JV, Keall PJ: A deliverable
four-dimensional intensity-modulated radiation therapy-planning
method for dynamic multileaf collimator tumor tracking delivery.
International Journal of Radiation Oncology Biology Physics 2008,
71:1526-1536.
15. Suh YL, Sawant A, Venkat R, Keall PJ: Four-dimensional IMRT treatment
planning using a DMLC motion-tracking algorithm. Physics in Medicine
and Biology 2009, 54:3821-3835.
16. Gui MZ, Feng YM, Yi BY, Dhople AA, Yu C: Four-dimensional intensity-
modulated radiation therapy planning for dynamic tracking using a
direct aperture deformation (DAD) method. Medical Physics 2010,
37:1966-1975.
17. Rosu M, Balter JM, Chetty IJ, Kessler ML, McShan DL, Balter P, Ten Haken RK:
How extensive of a 4D dataset is needed to estimate cumulative dose
distribution plan evaluation metrics in conformal lung therapy? Medical
Physics 2007, 34:233-245.
18. Lujan AE, Larsen EW, Balter JM, Ten Haken RK: A method for incorporating
organ motion due to breathing into 3D dose calculations. Medical Physics
1999, 26:715-720.
19. Zhu L, Lee L, Ma YZ, Ye YY, Mazzeo R, Xing L: Using total-variation
regularization for intensity modulated radiation therapy inverse
planning with field-specific numbers of segments. Physics in Medicine and
Biology 2008, 53:6653-6672.
20. Pan T, Lee TY, Rietzel E, Chen GTY: 4D-CT imaging of a volume influenced
by respiratory motion on multi-slice CT. Medical Physics 2004, 31:333-340.
21. Chang JY, Zhang XD, Wang XC, Kang YX, Riley B, Bilton S, Mohan R,
Komaki R, Cox JD: Significant reduction of normal tissue dose by proton
radiotherapy compared with three-dimensional conformal or intensity-
modulated radiation therapy in Stage I or Stage III non-small-cell lung
cancer. International Journal of Radiation Oncology Biology Physics 2006,
65:1087-1096.
22. Feuvret L, Noel G, Mazeron JJ, Bey P: Conformity index: A review.
International Journal of Radiation Oncology Biology Physics 2006, 64:333-342.
23. Li X, Zhang PP, Mah D, Gewanter R, Kutcher G: Novel lung IMRT planning
algorithms with nonuniform dose delivery strategy to account for
respiratory motion. Medical Physics 2006, 33:3390-3398.
24. Wolthaus JWH, Sonke JJ, van Herk M, Belderbos JSA, Rossi MMG,
Lebesque JV, Damen EMF: Comparison of different strategies to use four-
dimensional computed tomography in treatment planning for lung
cancer patients. International Journal of Radiation Oncology Biology Physics
2008, 70:1229-1238.
25. Cuijpers JP, Verbakel W, Slotman BJ, Senan S: A novel simple approach for
incorporation of respiratory motion in stereotactic treatments of lung
tumors. Radiotherapy and Oncology 2010, 97:443-448.
26. Guckenberger M, Kavanagh A, Webb S, Brada M: A novel respiratory
motion compensation strategy combining gated beam delivery and
mean target position concept - A compromise between small safety
margins and long duty cycles. Radiotherapy and Oncology 2011,
98:317-322.
27. Ling CC, Humm J, Larson S, Amols H, Fuks Z, Leibel S, Koutcher JA:
Towards multidimensional radiotherapy (MD-CRT): Biological imaging
and biological conformality. International Journal of Radiation Oncology
Biology Physics 2000, 47:551-560.
28. Alber M, Paulsen F, Eschmann SM, Machulla HJ: On biologically conformal
boost dose optimization. Physics in Medicine and Biology 2003,
48:N31-N35.
29. Bentzen SM: Theragnostic imaging for radiation oncology: dose-painting
by numbers. Lancet Oncology 2005, 6:112-117.
30. Flynn RT, Bowen SR, Bentzen SM, Mackie TR, Jeraj R: Intensity-modulated
x-ray (IMXT) versus proton (IMPT) therapy for theragnostic hypoxia-
based dose painting. Physics in Medicine and Biology 2008, 53:4153-4167.
31. Thorwarth D, Eschmann SM, Paulsen F, Alber M: Hypoxia dose painting by
numbers: A planning study. International Journal of Radiation Oncology
Biology Physics 2007, 68:291-300.
32. Thorwarth D, Soukup M, Atber M: Dose painting with IMPT, helical
tomotherapy and IMXT: A dosimetric comparison. Radiotherapy and
Oncology 2008, 86:30-34.
33. Jeraj R: personal communication. 2010.
34. Barnes EIA, Murray BR, Robinson DM, Underwood LJ, Hanson J, Roa WHY:
Dosimetric evaluation of lung tumor immobilization using breath hold
at deep inspiration. International Journal of Radiation Oncology Biology
Physics 2001, 50:1091-1098.
35. Engelsman M, Sharp GC, Bortfeld T, Onimaru R, Shirato H: How much
margin reduction is possible through gating or breath hold? Physics in
Medicine and Biology 2005, 50:477-490.
doi:10.1186/1748-717X-6-83
Cite this article as: Li et al.: A 4D IMRT planning method using
deformable image registration to improve normal tissue sparing with
contemporary delivery techniques. Radiation Oncology 2011 6:83.
Submit your next manuscript to BioMed Central
and take full advantage of:
• Convenient online submission
• Thorough peer review
• No space constraints or color figure charges
• Immediate publication on acceptance
• Inclusion in PubMed, CAS, Scopus and Google Scholar
• Research which is freely available for redistribution
Submit your manuscript at
www.biomedcentral.com/submit
Li et al. Radiation Oncology 2011, 6:83
/>Page 14 of 14