Báo cáo khoa học: " In vivo assessment of catheter positioning accuracy and prolonged irradiation time on liver tolerance dose after single-fraction 192 Ir high-dose-rate brachytherapy" pot
Bạn đang xem bản rút gọn của tài liệu. Xem và tải ngay bản đầy đủ của tài liệu tại đây (1.98 MB, 10 trang )
RESEARCH Open Access
In vivo assessment of catheter positioning
accuracy and prolonged irradiation time on
liver tolerance dose after single-fraction
192
Ir high-dose-rate brachytherapy
Lutz Lüdemann
1*†
, Christian Wybranski
2†
, Max Seidensticker
2
, Konrad Mohnike
2
, Siegfried Kropf
3
, Peter Wust
1
and
Jens Ricke
2
Abstract
Background: To assess brachytherapy catheter positioning accuracy and to evaluate the effects of prolonged
irradiation time on the tolerance dose of normal liver parenchyma following single-fraction irradiation with
192
Ir.
Materials and methods: Fifty patients with 76 malignant liver tumors treated by computed tomography (CT)-
guided high-dose-rate brachytherapy (HDR-BT) were included in the study. The prescribed radiation dose was
delivered by 1 - 11 catheters with exposure times in the range of 844 - 4432 seconds. Magnetic resonance
imaging (MRI) datasets for assessing irradiation effects on norm al liver tissue, edema, and hepatocyte dysfunction,
obtained 6 and 12 weeks after HDR-BT, were merged with 3D dosimetry data. The isodose of the treatment plan
covering the same volume as the irradiation effect was taken as a surrogate for the liver tissue tolerance dose.
Catheter positioning accuracy was assessed by calculating the shift between the 3D center coordinates of the
irradiation effect volume and the tolerance dose volume for 38 irradiation effects in 30 patients induced by
catheters implanted in nearly parallel arrangement. Effects of prolonged irradiation were assessed in areas where
the irradiation effect volume and tolerance dose volume did not overlap (mismatch areas) by using a catheter
contribution index. This index was calculated for 48 irradiation effects induced by at least two catheters in 44
patients.
Results: Positioning accuracy of the brachytherapy catheters was 5-6 mm. The orthogonal and axial shifts between
the center coordinates of the irradiation effect volume and the tolerance dose volum e in relation to the direction
vector of catheter implantation were highly correlated and in first approximation identically in the T1-w and T2-w
MRI sequences (p = 0.003 and p < 0.001, respectively), as were the shifts between 6 and 12 weeks examinations (p
= 0.001 and p = 0.004, respectively). There was a significant shift of the irradiation effect towards the catheter entry
site compared with the planned dose distribution (p < 0.005). Prolonged treatment time in creases the normal
tissue tolerance dose. Here, the catheter contribution indices indicated a lower tolerance dose of the liver
parenchyma in areas with prolonged irradiation (p < 0.005).
Conclusions: Positioning accuracy of brachytherapy catheters is sufficient for clinical practice. Reduced tolerance
dose in areas exposed to prolonged irradiation is contradictory to results published in the current literature. Effects
of prolonged dose administration on the liver tolerance dose for treatment times of up to 60 minutes per HDR-BT
session are not pronounced compared to effects of positioning accuracy of the brachytherapy catheters and are
therefore of minor importance in treatment planning.
* Correspondence:
† Contributed equally
1
Department of Radiation Therapy, Charité Medical Center, Berlin, Germany
Full list of author information is available at the end of the article
Lüdemann et al. Radiation Oncology 2011, 6:107
/>© 2011 Lüdemann et al; licensee BioMed Central Ltd. This is an Open Access article distributed under the terms of the Creative
Commons Attribution License (http ://creativecommons. org/licenses/by/2.0), which permits unrestricted use, distribut ion, and
reproduction in any medium, provided the original work is properly cited.
1 Background
Single-fraction
192
Ir high-dose-rate brachytherapy (HDR-
BT) of the liver is an ablation technique which has
shown promising results with respect to safety and
efficacy in the treatment of nonresectable primary and
secondary liver malignancies [1-3]. HDR-BT provides
steep dose gradients at the surface of the target volume
due to the low g-ray energy of
192
Ir and use of a point
source, and thus can be used to treat several malignan-
cies in one session or recurrent malignancies sequentially
without seriously impairing the functional hepatic reserve
[4]. To prevent recurrence at the tumor margins, catheter
placement and dwell positions of the
192
Ir point source
have to be carefully planned [5]. The accuracy of dose
application is predominantly dependent on catheter posi-
tioning. Computed tomography (CT) was used to moni-
tor catheter implantation, and 3D CT datasets acquired
in breath-hold were used for treatment planning. For
irradiation patients were transferred from the CT unit to
the brachytherapy unit. Dislocation of catheters during
patient transfer might be a potential source of error with
respect to correct dose application at the target site.
Additionally, the liver is an elastic organ and could be
deformed between catheter implantation and irradiation.
The treatment of larger tumors with an
192
Ir point
source requires the implantation of approximately 1
catheter for each 1 - 2 cm of tumor diameter. The con-
tributions of several cathe ters with numerous dwell
positions to the planned dose in a large part of the tar-
get volume lead to r egional prolongation of irradiation.
Several authors describe an increased normal tissue dose
tolerance for prolonged radiation therapy or pulsed dose
rate (PDR) radiation therapy [6,7] even if the total irra-
diation time is less than one hour [8].
The present study aims at addressing two methodical
aspects of HDR-BT: First, to investigate the limits of
catheter positioning accuracy and its clinical importance.
Second, to investigate if effects of prolonged irradiation
times on the tolerance dose of normal liver parenchyma
are important for clinical practice and may have to be
taken into account in treatment planning.
2 Methods
Study population
In this study we retrospectively analyzed irradiation
effects on normal liver tissue in 50 consecutive patients
who underwent CT-guided single-fraction HDR-BT as
part of a clinical phase II study prospectively assessing
local tumor control. In 50 HDR-BT sessions a total of
76 solid primary or secondary liver tumors were treated
(1 - 4 malignant tumors per session). The study was
approved by the local ethics committee. Written
informed consent was obtained from all patients.
Interventional technique
The interventional technique has been described in
detail elsewhere [9]. In brief, a T2-weighted (T2-w)
respiratory-triggered ultrafast turbo spin echo (UTSE)
and a T1-weighted (T1-w) breath-hold gradient echo
(GRE) sequence with administration of the hepatocyte-
specific contrast agent gadobenate dimeglumine (Gd-
BOPTA (Multihance), Bracco, Princeton, NJ) were
acquired to delineate primary and secondary liver
lesions (see Follow-up section below). The brachyther-
apy c atheters were positioned using CT guid ance
(Somatom 4, Siemens, Erlangen, Germany), i.e., CT
scans were acquired continuously during the interven-
tional procedure with an image reconstruction rate of
12 per second to m onitor actual catheter location. They
were placed in 6F angiographic sheaths (Radiofocus,
Terumo, Japan), which were implanted in Seldinger
technique within the tumors.Theangiographicsheaths
were sutured to the skin. After catheter positioning, a
spiral CT scan of the liver (matrix size, 512 × 512; slice
thickness, 5 mm; increment, 5 mm) enhanced by intra-
venous administration of iodine contrast medium (100
ml Ultravist 370; flow, 1 ml/s; start delay, 80s) was
acquired in breath-hold technique for treatment plan-
ning. Four catheters were implanted on average per
HDR-BT session (range, 1 - 11 catheters).
Treatment planning and irradiation
Treatment was planned using the BrachyVision software
package, version 7.1 (Varian Medical Systems, Palo Alto,
CA). The dwell positions and irradiation times were
optimized to ensure delivery of the prescribed dose to
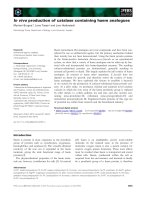
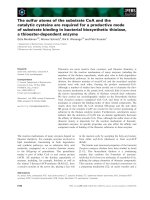
the entire clinical target volume (CTV), see Figure 1.
The 24-channel HDR af terloading system (Gammamed
12i, Varian, Charlottesville, VA) employed a
192
Ir source
(nominal source strength, 370GBq). A dose of 15, 20, or
25G y was prescribed, which was planned to enclose the
lesion (clinical targ et volume). Compromises were
necessary if organs of risk such as the stomach, small
intestine, or a large bile duct were very close to the tar-
get. No upper limit was defined for the dose within the
tumor volume. To preserve liver function after irradia-
tion, one third of the liver parenchyma should receive a
dose of less than 5Gy. The effective irradiation time
needed to apply the target dose w ith all catheters was
corrected according to the actual
192
Ir source strength.
We usually limit the maximum irradiation time to 60
minutes to incre ase patient comfort. The ca theters were
then sequentially connected to the afterloading system
according to the prescribed enumeration, and irradiation
was started at the most distant dwell position in each
catheter. All dwell positions within one catheter were
sequentially ir radiated without any delay. An interval of
Lüdemann et al. Radiation Oncology 2011, 6:107
/>Page 2 of 10
approx. 2 - 3 minutes was required for connecting each
catheter. Manual sequential connection of the catheters
was necessary because only a single adapter was avail-
able for connect ing the catheters to the afterloader. The
exposure times were in the range of 844 - 4432 seconds.
Follow-up
A total of 161 MRI exam inations were performed 6 ± 2
weeks and 12 ± 2 weeks after HDR-BT. The MRI proto-
col comprised the following sequences (Gyroscan NT
Intera , Philips, The Netherlands) [10]: T2-w respiratory-
triggered UTSE (echo time/repetition time (TE/TR), 90/
2100 ms; echo train length (ETL), 21; slice thickness, 8
mm, acquired in interleaved mode with no gap) with fat
suppression to assess the extent of interstitial edema
and T1-w breath-hold GRE (TE/TR 5/30 ms; flip
angle,30°; slice thickness, 8 mm, acquired in, interleaved
mode with no gap) 2 h after intravenous injection of 15
ml gadobenate dimeglumine (Gd-BOPTA (Multihance),
Bracco, Princeton, NJ). The hepatocyte-specific contrast
agent gadobenate dimeglumine allowed visualization of
the extent of hepatocyte dysfunction. The underlying
mechanism o f intracellular uptake is a polyspecific
organic anionic transport [11-13].
Image registration
Merging of the 3D dosimetry data calculated by BrachyVi-
sion with the corresponding follow-up MRI scans was
accomplished using an independent image registration
implementation within the 3D visualization software
Amira 3.1 (Mercury Computer Systems, Berlin, Germany).
The image voxel-property-based registration method
allowed affine transformation (12 degrees of freedom: 3
rotations,3translations,3scalings,and3shears)by
exploring the normalized mutual information (NMI) [14],
see Figure 2A. The liver including a 1-cm margin was seg-
mented in the treatment planning CT. The segmented
data served as reference for registration to optimize regis-
tration accuracy for the liver. Registration accuracy was
validated using intrahepatic vessel bifurcations as land-
marks. Three to four landmarks were set in the CT and
MRI image data of ten patients. Distances between the
landmarks in the coregi stered images (CT vs. MRI) were
determined using the differences between the absolute
positions determined with Amira. A total of 120 coregis-
tered landmark combinations were evaluated.
Calculation of normal liver tissue tolerance dose
The borders of hyperintensity on T2-w images (intersti-
tial edema) and hypointensity on late Gd-BOPTA-
Figure 1 Geometry. The 3D visualization shows a CT slice with the
calculated dose in Gy overlayed. The dose is applied using two
catheters. The two catheters were visualized in 3D using surface
rendering of the catheters labeled in the CT scan.
A)
B)
5 Gy
10 Gy
15 Gy
20 Gy
Lesion
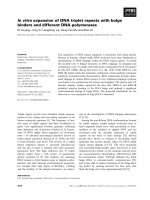
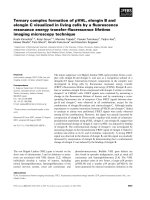
Figure 2 Image registration. A) T2-w image coregistered with the
planning CT. Note that only the liver was coregistered and
therefore good matching of the images was only achieved for the
liver. B) T2-w image showing segmented lesion and isodoses at 12-
week follow-up. A prononounced shift of the irradiation effect with
respect to the planned dose distribution as shown in this example
was typically not found.
Lüdemann et al. Radiation Oncology 2011, 6:107
/>Page 3 of 10
enhanced T1-w images (hepatocyte dysfuntion) around
the irradia ted liver tumors were outlined, see Figure 2B.
The volume of each irra diation effect was determined.
As the next step, we used this volume to calculate the
3D-isodose, which was confined to the liver and encom-
passed a corresponding volume (± 1%). The calculated
isodose was taken as a surrogate for the tolerance dose
of normal liver tissue assuming consistency between an
observed radiation effect and the dose applied [9]. The
volume encompassed by the isodose surface will be
referred to as tolerance dose volume in the following.
The mismatch areas between both volumes were investi-
gated in detail for the effect of prolonged irradiation
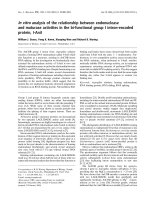
time, see Figure 3.
Measurement of lesion volume shift in relation to
planned volume
Potential inaccuracies of the treatment planning proce-
dure or catheter dislocation were analyzed by calculating
the shift b etween the center coordinates of the irradia-
tion effect volume and the tolerance dose volume using
thecoordinatesystemoftheplanningCT.Onlythose
brachytherapies were evaluated in which the catheters
were implanted unidirectionally, i.e., in parallel (n = 38).
The direction vector of an implanted catheter was cal-
culated f rom the coordinates of the catheter skin entry
site and the catheter tip in the treatment planning CT.
If more than one catheter was implanted, an average
coordinate from the coordinates of the entry sites and
of the catheter tips was calcul ated. The direction vector
of catheter implantation was converted into a unit vec-
tor
e
with unit length 1 cm.
The shift vector
S
describing the shift between the
irradiation effect volume and the tolerance dose volume
was calculated from the center coordinates of both
volumes. The scalar product of the unit vector and the
shift vector,
S
axial
=
e ·
S
, was taken as a measure of the
shift between irradiation effect volume and tolerance
dose volume axial to the direction vector of catheter
implantation. It serves as a surrogate for catheter dislo-
cation within the catheter track. The vector product of
both vectors,
S
ortho
=
|
e ×
S
|
, provides a measure of the
orthogonal shift between the center coordinates of the
irradiation effect volume and the tolerance dose volume
in relation to the direction vector of catheter implanta-
tion. Since movement of the brachytherapy catheters
within the liver is limited to the catheter track the
orthogonal shift results mainly from methodical limita-
tions of ima ge registration due to local liver deforma-
tion. The vector product thus serves as an additional
surrogate for registration inaccuracy.
An asymmetry coefficient of the scalar and vector pro-
duct was calculated to differentiate between a systematic
shift and registration inaccuracy:
AC
S
=
|
S
axial
|−
S
ortho
0.5
(
|S
axial
| + S
ortho
)
(1)
A positive value of the asy mmetry coefficient in dicates
a shift predominantely parallel to the direction vector of
the implanted catheter, whereas a negative value indi-
cates a shift predominantly orthogonal to the direction
vector of the implanted catheter.
Evaluation of prolonged irradiation time
Irradiation took up to 4432 seconds (≈ 74 minutes)
using multiple catheters with numerous dwell positions
of the
192
Ir source. Therefore, in areas with significant
dose contribution of several catheters, dose delivery
time was prolonged and may be ch aracterized as pulsed
dose administration. The effects of regionally longer,
pulsed irradiation were investigated in areas where the
extent of hepatocyte dysfunction and edema was not
consistent with the applied dose. Only radiation effects
induced by at least 2 brachytherapy catheters were
assessed (n = 48).
We used a boolean tool implemented in Amira 3.1 to
identify nonoverlapping areas of the irradiation effect
volume and the corresponding tolerance dose isovolume
(confined to the liver). These areas will be referred to as
mis mat ch areas in the fol lowing. Mismatch areas where
edema or hepatocyte dysfunction occurred at doses
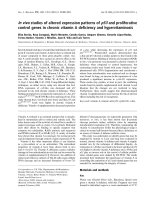
Lesion
16.2 Gy isodose surface
MA-
MA+
Figure 3 Mismatch areas. T2-w image showing segmented
irradiation effect and 16.2Gy isodose encompassing the
corresponding tolerance dose volume. A very pronounced shift of
the irradiation effect with respect to the isodoses is shown to illus-
trate the likely maximum inaccuracy of catheter positioning.
Mismatch areas in which we observed a dose response at doses
smaller than the tolerance dose of the total irradiation effect are
indexed with “MA+” and mismatch areas in which we did not
observe a dose response at doses higher than the tolerance dose of
the total irradiation effect are indexed with “MA- “.
Lüdemann et al. Radiation Oncology 2011, 6:107
/>Page 4 of 10
smaller than the tolerance dose of the total irradiation
effect are indexed with ‘"MA+”. Conversely, mismatch
areas in which edema or hepatocyte dysfuntion did not
manifest at doses exceeding the tolerance dose of the
total irradiation effect are indexed with “ MA-” ,see
Figure 3. The ‘"MA+” and “MA-” mismatch areas by
definition have identical volumes.
A comprehensive description of the time course of
irradiation in brachytherapy is difficult since multiple
catheters with numerous dwell positions contribute to
dose fractionation in each voxel. First, the total voxel
dose, D
tot
(x,y,z), depends on the voxel position. Second,
thedosecontributionofeachcatheter,D
i
(x, y, z),
depends on the voxel position, (x,y,z), where i is the
catheter number. Third, each voxel is irradiated with a
different dose administration scheme, D
tot
(x,y,z )=∑
n
D
i
(x,y,z), where n is the number of catheters. The Bra-
chyVision software allows separation of the total dose
map, D
tot
(x,y,z), into n separate dose maps, D
i
(x,y,z), for
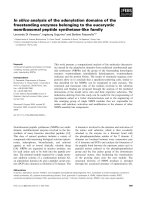
each catheter i, see Figure 4. We calculated a total of
202 separate treatment plans using the treatment plan-
ning system to determine the contribution of each
catheter to the total of 48 irradiation effects. To esti-
mate the prolongation of irradiation by the
192
Ir HDR
source we calculated a catheter contribution index, I
P
(x,
y,z), that uses the number of dose contribution pulses:
|I
P
(x, y, z)| = n −
n
i
=1
2 ·
D
i
(x, y, z)
D
tot
(x, y, z)
− 1
2
(2)
The irradiation of a single voxel is prolonged as the
number of dose-cont ributing catheters increases. There-
fore, the catheter contribution index increases with the
number of contributing catheters. In case of a single con-
tributing catheter, I
P
= 0. In case of two equally contribut-
ing catheters, D
i
/D
tot
=0.5,andI
P
=2.0.I
P
is always in
the range between 0 and 2. The separate treatment plans
were combined in a voxelwise approach using an arith-
metic module implemented in Amira 3.1, see Figure 5.
Catheter contribution index I
P
( x,y,z ) was then aver-
aged over the 3D maps of the mismatch areas, I
P
(MA+)
and I
P
( MA-). We calculated an asymmetry coefficient
with the following formula
AC
I
=
I
P
(MA+) − I
P
(MA−)
0.5
(
I
P
(
MA+
)
+ I
P
(
MA−
))
(3)
to compare the averaged catheter contribution indices
I
P
(MA+) and I
P
(MA-) calculated using Eq. 2. A value of
the asymmetry coefficient > 0 indicates that the catheter
contribution index in “MA+” is higher than in “ MA-”,
vice versa a value of the asymmetry coefficient < 0
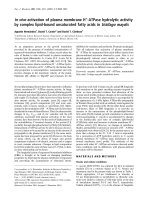
Figure 4 Dose separation. The 3D visualization shows a coronal
CT reconstruction with the calculated dose in Gy overlayed using
the patient in Fig. 1. The dose is applied using two catheters. The
two catheters were visualized in 3D using surface rendering of the
catheters labeled in the CT scan. A) Total dose, D
tot
, overlayed.
B) Dose applied by the cranial catheter, D
1
. C) Dose applied by the
caudal catheter, D
2
.
Lüdemann et al. Radiation Oncology 2011, 6:107
/>Page 5 of 10
indicat es that the catheter contribut ion index in “ MA+”
is lower than in “MA-”.
Statistical analysis
The G eneralized Estimating Equation (GEE) model was
employed to statistically assess limits of catheter posi-
tioning accuracy and the effects of prolonged irradiation
times on the tolerance dose of normal liver parenchyma.
For a dataset consisting of repeated measurements (2
MRI sequences, 2 follow-up dates) of a variable of inter-
est, a GEE model allows the correlation of outcomes
within one individual to be estimated and taken into
appropriate account in the equation which generates the
regression coefficients and their standard errors [15,16].
The GEE model was calculated with SAS, Version 9.1
(SAS Institute Inc., Cary, NC, USA). A p <0.05was
considered significant.
3 Results
The validation of image registra tion accuracy using
landmarks yielded a mean deviation of 2.64 mm (25%
quartile width (Q
25
): 0.28 mm, 75% quartile width
(Q
75
): 4.51 mm). Thus registration accuracy proved to
be sufficient for evaluating catheter positioning accuracy.
A total of 161 MRI examinations of 62 irradiation
effects were performed 6 and 12 weeks a fter HDR-BT.
Table 1 shows the mean volume and threshold dose of
hepatocyte dysfunction (T1-w images) and interstitial
edema (T2-w images) and corresponding liver tolerance
doses as well as the standard deviation between the
examinations at 6 and 12 weeks (6W and 12W).
A total of 96 follow-up MRI examinations of 30
patients with 38 irradiation effects were assessed to ana-
lyze methodical limitations of cathe ter positioning accu-
racy. Only patients with unidirectionally implanted, i.e.,
nearly parallel, catheters were included in the evaluation.
The median number of catheters inserted was 2 (Q
25
:1,
Q
75
: 3 catheters; range: 1-8 catheters).
Table 2 presents the axial, orthogonal, and total shifts
(in mm) between the center coordinates of the irradiation
effects and tolerance dose volumes in relation to the
direction vectors of catheter implantation. The mean
axial shift of hepatocyte dysfunction (T1-w images) was
-5. 3 ± 5.4 mm and of inters titial edema (T2-w images)
-5. 6 ± 6.0 mm in plane, indicating a shift of the irradia-
tion effect volume against the corresponding tolerance
dose volume in the direction of the catheter entry sites.
The orthogonal shift as a surrogate for registration inac-
curacy due to liver deformation was 4.0 ± 2.5 mm on
T1-w images and 4.6 ± 2.6 mm on T2-w images.
The orthogonal and axial shifts between the center
coordinates of the irradiation effect volume and the tol-
erance dose volume in relation to the direction vector of
catheter implantation were highly correlated in the T1-
w and T2-w MRI sequences (p = 0.003 and p <0.001,
respectiv ely), as were the s hifts between 6 and 12 weeks
examinations (p = 0.001 and p = 0. 004, respectively).
The asymmetry coefficient of the orthogonal and axial
shifts of the center coo rdinates of the irradiation effect
Figure 5 Catheter contribution index.Theimageshowingthe
separated isodoses of two catheters for the patient in Fig. 1 and
Fig. 4. The separated doses of the cranial and caudal catheter (Fig.
4) are used to calculate the catheter contribution index (Eq. 2)
shown in color coding. In case of two equally contributing
catheters, D
i
/D
tot
= 0.5 and I
P
= 2.0. I
P
is always in the range
between 0 and 2.
Table 1 Normal liver tissue tolerance dose and volume of
irradiation effect
6w T1-w 12w T1-w 6w T2-w 12w T2-w
n = 44 36 48 33
Dose/Gy 13.7 ± 4.8 16.7 ± 5.0 14.3 ± 6.2 16.6 ± 6.4
Volume/
cm
3
190.3 ±
158.6
127.2 ±
118.8
190.0 ±
166.4
157.0 ±
143.5
Mean normal liver tissue tolerance dose and volume (± standard deviation)
for interstitial edema assessed by hyperintensity on T2-w images and
hepatocyte dysfunction assessed by hypointensity on T1-w images six/twelve
weeks (6w and 12w) after HDR-BT (n: number of MRI examinations evaluated).
Table 2 Shift between irradiation effect and planned
dose distribution
T1-w T2-w
n = 47 49
Axial shift/mm -5.3 ± 5.4 -5.6 ± 6.0
Orthogonal shift/mm 4.0 ± 2.5 4.6 ± 2.6
Total shift/mm 7.7 ± 4.4 8.4 ± 4.4
AC
S
1.14 ± 0.43 1.04 ± 0.49
Mean axial, orthogonal, and total shift between center coordinates of the
irradiation effect and planned dose distribution in relation to the direction
vector of catheter implantation for T1-w and T2-w MRI data. Both follow-up
dates, 6w and 12w, were evaluated together. A negative value of the axial
shift indicates a shift into the direction of the catheter entry site. T1-w =
hepatocyte dysfunction, T2-w = interstitial edema, n = number of MR
examinations assessed.
Lüdemann et al. Radiation Oncology 2011, 6:107
/>Page 6 of 10
and corresponding tolerance dose volume in relation to
the direction vector of catheter implantation, AC
S
,was
1.14 ± 0.43 for hepatocyte dysfunction and 1.04 ± 0.49
for interstitial edema, indicating that the axial shift as a
surrogate for catheter dislocation w ithin the catheter
track was predominant (p < 0.005). The asymmetry
coefficient was significantly affected by the MRI
sequence used (p = 0.014) but not by the change in the
irradiation effect volume between the 6-week and 12-
week examinations (p = 0.48).
A total of 129 follow-up MRI examinations of 44
patients with 48 irradiation effects were assessed to ana-
lyze the effect of prolonged irradiation time on the tol-
erance dose of normal liver parenchyma. All irradiation
effects were induced by at least 2 brachytherapy cathe-
ters. The median number of catheters per irradiation
effect was 4 (Q
25
:3;Q
75
: 6 catheters; range: 2-11 cathe-
ters). The average time for complete ap plication of the
radiation dose was 1865 ± 758 seconds (range: 844 -
4432 seconds).
The volumes of the mismatch areas, “MA+” and “MA-
”, averaged over the 6-week and 12-week follow-u p MRI
examinations and T1-w and T2-w acquisitions, was 40.6
±28.9cm
3
(23.5 ± 10.1%). The differences between the
mismatch area volumes with regard to 6-week and 12
week follow-up examinations and T1-w and T2-w MRI
are small, see Table 3. The average dose in “ MA+” is
approximately 12Gy 6 weeks and 14Gy 12 weeks after
the intervention. The average dose in “ MA-” ,is
approximately 22-23Gy 6 weeks and 28Gy 12 weeks
post intervention, see Table 3. The difference between
the average doses in the mismatch areas is significant (p
< 0.0001). The values for the catheter contribution
indices in the mismatch areas, I
P
(MA+) and I
P
(MA -), as
well as the asymmetry coefficients of the catheter contri-
butio n indices in the mismatch areas, AC
I
, with respect
to hepatocyte dysfunction and interstitial edema and the
corresponding follow-up dates are displayed in Table 3.
The mean of AC
I
is > 0 in each subgroup, indicating
that the catheter contribution index in “MA+” is slightly
higher than in “MA-”. I
P
(MA+) and I
P
(MA-) are signifi-
cantly affected by the volume loss of the irradiation
effect between the 6-week and 12-week follow-up exam-
inations and consecutive shifts of the mismatch areas
towards the high dose regions of the dose plan (p =
0.0014). There is no significant difference between I
P
(MA+) and I
P
(MA- ) with respect to hepat ocyte dysfunc-
tion and interstitial edema (p = 0.9).
4 Discussion
In this study, we sought to assess two methodical
aspects of HDR-BT: first, limits of catheter positioning
accuracy and, second, effe cts of prolonged irradiation on
the tolerance dose of normal liver parenchyma. The
mean shift betw een the center coordinates of the irra-
diation effect volume and corresponding toler ance dose
volume in relation to the direction vector of catheter
implantation is ≈ - 5 mm in plane, indicating a shift of
the irradiation effect in the direction of the catheter
entry site. The shift is within the slice thickness of 5
mm of the treatment planning CT but larger than could
be explained by registration inaccuracy, which is ≈ 3
mm, and inaccuracy due to local liver d eformation in
the follow-up images, resulting in an overall registration
inaccuracy of ≈ 4-5 mm.
Determination o f catheter positioning accuracy might
be limited by the delineation of the brachytherapy cathe-
ters in the treatment planning CT since applicator geo-
metry i s entered manually. Partial volume effects in the
treatment planning datasets could be a potential source
of error in the treatment planning procedure, especially
for catheters in oblique direction, since correct place-
ment of the starting point of the catheter is dependent
on conspicuity of the catheter tip.
Another limitation is the dislocation of catheters
between acquisition of the planning CT and irradiation.
Although the angiographic sheaths containing the cathe-
ters were secured to the skin by suture, retraction of the
brachytherapy catheters within the catheter tracks might
potentially occur due to patient movement, e.g., when
the patient is transferred from the CT unit to the bra-
chyt herapy unit, and liver movement during respiration.
However, the extent of the shift between an irradiation
Table 3 Mean dose, deviation of mean dose from normal
liver tissue tolerance dose, and dose protraction in
mismatch areas
6W T1-w 12W T1-w 6W T2-w 12W T2-w
n 35274027
D(MA+)/Gy 12.0 ± 4.3 14.1 ± 4.4 11.8 ± 5.4 14.0 ± 6.3
D(MA-)/Gy 23.2 ± 11.9 28.5 ± 11.0 22.2 ± 11.6 27.7 ± 15.1
ΔD(MA+)/Gy -2.1 ± 2.8 -3.2 ± 1.9 -2.1 ± 4.3 -3.0 ± 3.1
ΔD(MA-)/Gy 9.1 ± 7.5 11.2 ± 6.8 8.3 ± 6.6 10.7 ± 8.8
I
P
(MA+) 1.67 ± 0.33 1.69 ± 0.26 1.67 ± 0.31 1.70 ± 0.27
I
P
(MA-) 1.45 ± 0.39 1.35 ± 0.37 1.45 ± 0.37 1.39 ± 0.36
AC
I
0.17 ± 0.28 0.25 ± 0.27 0.16 ± 0.26 0.23 ± 0.22
V (MA +/MA-)/cm
3
42.0 ± 26.7 38.2 ± 31.2 40.8 ± 29.2 43.0 ± 33.1
V (MA +/MA-)/% 21.8 ± 11.1 23.9 ± 7.8 23.1 ± 0.8 27.0 ± 9.0
D(MA+), D(MA-): Average dose in mismatch areas; “MA+” for response at doses
smaller than the tolerance dose and “MA-” for missing response at doses
exceeding the tolerance dose.
ΔD(MA+), ΔD(MA-): Difference between the average dose in “MA+"and “MA-”
and corresponding tolerance dose of the irradiation effect.
I
P
(MA+), I
P
(MA-): Catheter contribution index in “MA+” and “MA-”.
AC
I
: Asymmetry coefficient between the catheter contribution indices in “MA
+” and “MA-”.
V (MA +/MA-): Volume of the mismatch areas “MA+” and “MA-” in percent and
absolute value which is per definition identical for both areas.
Errors are given as standard deviation.
Lüdemann et al. Radiation Oncology 2011, 6:107
/>Page 7 of 10
effect and the center of the planned dose distribution
does not suggest a significant dislocation of the bra-
chytherapy catheters within the catheter tracks.
The systematic shift between the irradiation effect
volume and planned dose distribution has to be consid-
ered in treatment planning when defining the CTV to
avoid underdosage of the tumor periphery. In our institu-
tion, the CTV comprises the tumor volume visible on
contrast-enhanced CT scans plus a 5-mm safety margin.
With regard to treatment planning, we conclude that a
slice thickness exceeding 3 mm potentially impairs cathe-
ter positioning accuracy. We furthermore propose that it
would be ben eficial to increase the safety margin of the
CTV in the direction of the catheter tips from 5 to 10
mm to avoid underdosage and consecutive recurrence at
the tumor margin. The amount of mismatch (Table 3)
between planned dose distribution and irradiation effect
volume is determined by the registration accuracy or pos-
sibly by biological effects but does not allow to asses s the
reproducibility of the CTV. Two studies evaluated the
accuracy of target positioning in extrac ranial stereotactic
radiotherapy (ESRT) using special patient fixation. For
mobile soft tissue targets, such as liver metastasis, Wulf
et al. [17] reported mean target deviations of 0.9 ± 4.5
mm, 0. 9 ± 3.0 mm, and 3.4 ± 3.2 mm in the craniocau-
dal, anteroposterior, and lateral directions, respectively,
when breathing control was applied. The mean 3D devia-
tion of the targets was 6.1 ± 4.6 mm.
For single-fraction therapy, Herfarth et al. [18]
reported mean target set-up deviations between treat-
ment planning and treatment of 4. 0 ± 2.5 mm, 2.2 ± 1.
8 mm, and 2.2 ± 1.7 mm in the craniocaudal, anteropos-
terior, and lateral directions, respectively. The mean 3D
deviation of the targets was 5.7 ± 2.5 mm.
The total in-plane deviation of the target location in
our study was slightly higher, 4-6 ± 2-6 mm. However,
we determined the effective positioning accuracy by
comparing the shift between the irradiation effect in fol-
low-up MRI and planned dose distribu tion. The authors
quoted above compared treatment planning images with
control CT datasets acquired before treatment [17,18]
and did not evaluate the treatment effect.
Based on metric analysis of target mobility and set-up
inaccuracy in the CT simulation prior to or during
treatment, safety margins for defining the planning tar-
get volume (PTV) of about 5 mm in axial and 5 - 10
mm in craniocaudal direction are commonly added to
the CTV in ESRT of lung and liver tumors [19]. In con-
trast to the present study, Wulf et al. evaluated the
reproducibility of the CTV of lung and liver tumors
within the planning target volume (PTV) over the entire
course of hypofractionated treatment in CT simulation
prior to application of each fraction [19]. The mean
volume ratio of the PTV to the CTV was 2.2 ± 0.6 in
liver targets. The authors showed that especially liver
tumors with a CTV exceeding 100 cm
3
were susceptible
to target deviation exceeding the standard safety mar-
gins for PTV definition. They suggested to increase the
PTV by adding a larger safety margin to ensure ade-
quatetargetdosedepositionintheseCTVs.Inbra-
chytherapy, the applicator moves to a certain extent
together with the target and there is no need to increase
the safety margin for larger tumors.
Catheter dislocation in brachytherapy was mainly
investigated in fractionated HDR brachytherapy of the
prostate, which differs from the technique used here in
that a much larger number of catheters are implanted
for more than one day. Imaging techniques (cone beam
CT and CT) were used to assess catheter dislocation
between the first and second fraction, i.e., over 24
hours. Foster et al. found a mean catheter displacement
of 5. 1 mm, resulting in a significantly (p <0.01)
decreased mean prostate V
100
(volume receiving 100Gy
or more) from 93.8% to 76.2% [20]. Five patients had
maximum catheter displacement exceeding 10 mm.
Simnor et al. found a mean m ovement in caudal direc-
tion relative to the prostate base between the first and
second fraction of 7. 9 mm (range 0-21 mm). Planning
target volume dose D
90%
was reduced without move-
ment correction by a mean of 27.8% [21]. Kim et al.
found an average (range) magnitude of craniocaudal
catheter displacement of 2.7 mm (- 6.0 to 13.5 mm)
using bone markers and 5.4 mm (-3.75 to 18.0 mm)
using the center of two gold markers [22]. Catheter dis-
locati on in fractionated HDR b rachytherapy of the pros-
tate is in the same range as in the present study but,
because of the much more complex irradiation geome-
try, the impact on dose coverage is much larger.
We assessed the effect of prolonged irradiation times
on the tolerance dose of normal liver tissue to determine
its relevance for treatment planning. A catheter contribu-
tion index served as a surrogate for prolonged pulsed
dose administration in nonoverlapping areas of the irra-
diation effect volume and the corresponding tolerance
dose volume. The catheter contribution index was
slightly but signif icantly higher in “MA+” than in “MA-”,
indicating a prolongation of dose application in “MA+”
compared to “MA-” . Based on published data, we would
have expected to find an increased tolerance dose of the
liver parenchyma in areas irradiated for a longer time, i.
e., by several catheters [6,7], even if the overall irradiation
time is less than one hour [8]. However, we f ound a
decreased tolerance dose of the liver parenchyma in areas
where the radiation dose was applied by several catheters
for a prolonged period of time.
We hypothesize that the effects of prolonged irradia-
tion on the tolerance dose of normal liver tissue might
have been obscured by other factors. For instance,
Lüdemann et al. Radiation Oncology 2011, 6:107
/>Page 8 of 10
biological effects such as react ive inflammatory change s
may mimic irradiation effects, or scarring of the liver
tissue induced by catheter insertion may cause retrac-
tion of the irradiation effect towards the catheter entry
site. Furthermore, we propose that inaccuracies in the
positioning of the brachytherapy catheters are more pro-
nounced in areas where several catheters contribute to
the total irradiation dose and that the total applied
effective dose in “MA+” was higher than would have
been expected from the treatment plan. Since steep
dose gradients are an inherent quality of interstitial
HDR-BT, the shift of active dwell positions of one or
several catheters towards the tumor periphery would be
sufficient to signif icantly increase the applied dose out-
side the CTV. As the number of catheters increases, the
probability of a dose shift due to slight inaccuracy in
catheter positioning likely increases as well.
We conclude that the eff ects of prolonged irradiation
time are of minor importance for interstitial HDR-BT
compared to other factors such as positioning accuracy
of brachytherapy catheters and do not have to be tak en
into account in treatment planning in HDR-BT if the
total irradiation time does not significantly exceed one
hour.
The study has several limitations. Obviously one key
issue o f the study is the registration accuracy. The vali-
dation of registration accuracy was based on corre-
sponding vessel bifurcations identified in the planning
CT and follow-up MR images by an experienced radiol-
ogist [23,24]. We applied affine registration, allowing 12
degrees of freedom, which compensates for whole organ
deformation and yielded an accuracy of ≈ 3mmwith
respect to vessel bifurcations within the centr al parts of
the liver, comparable to other studies [25,26]. Affine
registration has been proven to be precise and robust
for liver registration [25-27]. However, local liver defor-
mation resulting from compression by adjacent organs
(such as the stomach), dif ferent respiration levels, or the
implanted catheters in the treatment planning CT data
might not be sufficiently compensated for. To ade-
quately compensate for these effects a finite element
model-based deformable image registration would have
been superior [23,24]. We tried to compensate for the
limitations of affine registration by restricting the regis-
tration to the liver [25]. Using this procedure, we
achieved a registration accuracy with a mean deviation
of 2.64 mm, which was smaller than that of the nonrigid
registration used by Elhawary et al. [ 28], for which the
authors reported a mean target regis tration error of. 4.1
mm and a mean 95
th
-percentile Hausdorff distance of 3.
3 mm.
Second, the catheter contribution index has to be con-
sidered a rough simplification, merely providing a first
estimate of the effect of prolonged dose administration.
Dose administration was considered highly prolonged if
the index was 2 (meaning that each catheter of the bra-
chyt herapy implant contributed < 50% of the irradiatio n
dose in the mismatch area). It was considered fairly pro-
longed if the value was between 1 and 2 (indicating that
more than 25% of the total irradiation dose in the m is-
matchareawasappliedbymorethan1catheter),and
nonprolonged if the value was ≤ 1 (meaning that 75% or
more of the t otal irradiation dose in the mismatch area
was applied by 1 catheter only). Nevertheless, the tool is
sufficient to rule out practically relevant effects of pro-
longed dose administration in HDR-BT in vivo.
5 Conclusions
In conclusion, positioning accuracy of brachytherapy
catheters is sufficiently precise with approx. 5-6 mm.
Accuracy was within the 5-mm slice thickness of the
treatment planning CT. Thus positioning accuracy is
potentially affected by inaccuracy in the delineation of
the brachytherapy catheters during treatment planning
due to partial volume effects in the planning CT.
Retraction of the catheters within the catheter tracks
during transfer of the patient from the CT unit to the
brachytherapy unit might occur; however, this retraction
is not pronounced. Therefore, CT-guided HDR -BT can
be safely performed, even if CT and brachytherapy are
not performed in the same unit. Effects of prolonged
irradiation times on the tolerance dose of normal liver
tissue are negligible compared to positioning accuracy
of brachytherapy catheters and do not have to be tak en
into account in treatment planning if the total irradia-
tion time does not significantly exceed one hour.
6 Competing interests
The authors declare that they have no competing
interests.
7 Authors’ contributions
LL, CW: data analysis, manuscript preparation.
PW, JR: study coordination, study design.
MS, KM: data acquisition.
SK: data analysis
All authors read and approved the final manuscript.
Author details
1
Department of Radiation Therapy, Charité Medical Center, Berlin, Germany.
2
Department of Radiology and Nuclear Medicine, Otto von Guericke
University, Magdeburg, Germany.
3
Department of Biometrics and Medical
Informatics, Otto von Guericke University, Magdeburg, Germany.
Received: 16 May 2011 Accepted: 5 September 2011
Published: 5 September 2011
References
1. Ricke J, Mohnike K, Pech M, Seidensticker M, Rühl R, Wieners G, Gaffke G,
Kropf S, Felix R, Wust P: Local response and impact on survival after local
Lüdemann et al. Radiation Oncology 2011, 6:107
/>Page 9 of 10
ablation of liver metastases from colorectal carcinoma by computed
tomography-guided high-dose-rate brachytherapy. Int J Radiat Oncol Biol
Phys 2010, 78(2):479-485.
2. Mohnike K, Wieners G, Schwartz F, Seidensticker M, Pech M, Ruehl R,
Wust P, Lopez-Hänninen E, Gademann G, Peters N, Berg T, Malfertheiner P,
Ricke J: Computed tomography-guided high-dose-rate brachytherapy in
hepatocellular carcinoma: safety, efficacy, and effect on survival. Int J
Radiat Oncol Biol Phys 2010, 78:172-179.
3. Wieners G, Mohnike K, Peters N, Bischoff J, Kleine-Tebbe A, Seidensticker R,
Seidensticker M, Gademann G, Wust P, Pech M, Ricke J: Treatment of
hepatic metastases of breast cancer with CT-guided interstitial
brachytherapy - A phase II-study. Radiother Oncol 2011.
4. Rühl R, Lüdemann L, Czarnecka A, Streitparth F, Seidensticker M, Mohnike K,
Pech M, Wust P, Ricke J: Radiobiological restrictions and tolerance doses
of repeated single-fraction hdr-irradiation of intersecting small liver
volumes for recurrent hepatic metastases. Radiat Oncol 2010, 5:44-44.
5. Seidensticker M, Wust P, Rühl R, Mohnike K, Pech M, Wieners G,
Gademann G, Ricke J: Safety margin in irradiation of colorectal liver
metastases: assessment of the control dose of micrometastases. Radiat
Oncol 2010, 5:24-24.
6. Hall EJ: Weiss lecture. The dose-rate factor in radiation biology. Int J
Radiat Biol 1991, 59(3):595-610.
7. Fowler JF, Van Limbergen EF: Biological effect of pulsed dose rate
brachytherapy with stepping sources if short half-times of repair are
present in tissues. Int J Radiat Oncol Biol Phys 1997, 37(4):877-883.
8. Pop LA, Millar WT, van der Plas M, van der Kogel AJ: Radiation tolerance of
rat spinal cord to pulsed dose rate (PDR-) brachytherapy: the impact of
differences in temporal dose distribution. Radiother Oncol 2000,
55(3):301-315.
9. Wybranski C, Seidensticker M, Mohnike K, Kropf S, Wust P, Ricke J,
Lüdemann L: In vivo assessment of dose volume and dose gradient
effects on the tolerance dose of small liver volumes after single-fraction
high-dose-rate 192Ir irradiation. Radiat Res 2009, 172(5):598-606.
10. Ricke J, Seidensticker M, Lüdemann L, Pech M, Wieners G, Hengst S,
Mohnike K, Cho CH, Hanninen EL, Al-Abadi H, Felix R, Wust P: In vivo
assessment of the tolerance dose of small liver volumes after single-
fraction HDR irradiation. Int J Radiat Oncol Biol Phys 2005, 62(3):776-84.
11. Clement O, Siauve N, Cuenod CA, Vuillemin-Bodaghi V, Leconte I, Frija G:
Mechanisms of action of liver contrast agents: impact for clinical use.
J Comput Assist Tomogr 1999, 23(Suppl 1):S45-52.
12. Kirchin MA, Pirovano GP, Spinazzi A: Gadobenate dimeglumine (Gd-
BOPTA). An overview. Invest Radiol 1998, 33(11):798-809.
13. de Haen C, Ferla RL, Maggioni F: Gadobenate dimeglumine 0.5 M
solution for injection (MultiHance) as contrast agent for magnetic
resonance imaging of the liver: mechanistic studies in animals. J Comput
Assist Tomogr 1999, 23(Suppl 1):S169-79.
14. Rohlfing T, West JB, Beier J, Liebig T, Taschner CA, Thomale UW:
Registration of functional and anatomical MRI: accuracy assessment and
application in navigated neurosurgery. Comput Aided Surg 2000,
5(6):414-25.
15. Burton P, Gurrin L, Sly P: Extending the simple linear regression model to
account for correlated responses: an introduction to generalized
estimating equations and multi-level mixed modelling. Stat Med 1998,
17(11):1261-91.
16. Zeger SL, Liang KY: Longitudinal data analysis for discrete and
continuous outcomes. Biometrics 1986, 42:121-30.
17. Wulf J, Hadinger U, Oppitz U, Olshausen B, Flentje M: Stereotactic
radiotherapy of extracranial targets: CT-simulation and accuracy of
treatment in the stereotactic body frame. Radiother Oncol 2000,
57(2):225-36.
18. Herfarth KK, Debus J, Lohr F, Bahner ML, Fritz P, Hoss A, Schlegel W,
Wannenmacher MF: Extracranial stereotactic radiation therapy: set-up
accuracy of patients treated for liver metastases. Int J Radiat Oncol Biol
Phys 2000, 46(2):329-35.
19. Wulf J, Hadinger U, Oppitz U, Thiele W, Flentje M: Impact of target
reproducibility on tumor dose in stereotactic radiotherapy of targets in
the lung and liver. Radiother Oncol 2003, 66(2):141-50.
20. Foster W, Cunha JA, Hsu IC, Weinberg V, Krishnamurthy D, Pouliot J:
Dosimetric impact of interfraction catheter movement in high-dose rate
prostate brachytherapy. Int J Radiat Oncol Biol Phys 2011, 80:85-90.
21. Simnor T, Li S, Lowe G, Ostler P, Bryant L, Chapman C, Inchley D, Hoskin PJ:
Justification for inter-fraction correction of catheter movement in
fractionated high dose-rate brachytherapy treatment of prostate cancer.
Radiother Oncol 2009, 93(2):253-258.
22. Kim Y, Hsu IC, Pouliot J: Measurement of craniocaudal catheter
displacement between fractions in computed tomography-based high
dose rate brachytherapy of prostate cancer. J Appl Clin Med Phys 2007,
8(4):2415-2415.
23. Brock KK, Dawson LA, Sharpe MB, Moseley DJ, Jaffray DA: Feasibility of a
novel deformable image registration technique to facilitate classification,
targeting, and monitoring of tumor and normal tissue. Int J Radiat Oncol
Biol Phys 2006, 64(4):1245-1254.
24. Voroney JP, Brock KK, Eccles C, Haider M, Dawson LA: Prospective
comparison of computed tomography and magnetic resonance imaging
for liver cancer delineation using deformable image registration. Int J
Radiat Oncol Biol Phys 2006, 66(3):780-791.
25. van Dalen JA, Vogel W, Huisman HJ, Oyen WJ, Jager GJ, Karssemeijer N:
Accuracy of rigid CT-FDG-PET image registration of the liver. Phys Med
Biol 2004, 49(23):5393-5405.
26. Carrillo A, Duerk JL, Lewin JS, Wilson DL: Semiautomatic 3-D image
registration as applied to interventional MRI liver cancer treatment. IEEE
Trans Med Imaging 2000, 19(3):175-185.
27. Christina Lee WC, Tublin ME, Chapman BE: Registration of MR and CT
images of the liver: comparison of voxel similarity and surface based
registration algorithms. Comput Methods Programs Biomed 2005,
78(2):101-114.
28. Elhawary H, Oguro S, Tuncali K, Morrison PR, Tatli S, Shyn PB, Silverman SG,
Hata N: Multimodality non-rigid image registration for planning,
targeting and monitoring during CT-guided percutaneous liver tumor
cryoablation. Acad Radiol 2010, 17(11):1334-1344.
doi:10.1186/1748-717X-6-107
Cite this article as: Lüdemann et al.: In vivo assessment of catheter
positioning accuracy and prolonged irradiation time on liver tolerance
dose after single-fraction
192
Ir high-dose-rate brachytherapy. Radiation
Oncology 2011 6:107.
Submit your next manuscript to BioMed Central
and take full advantage of:
• Convenient online submission
• Thorough peer review
• No space constraints or color figure charges
• Immediate publication on acceptance
• Inclusion in PubMed, CAS, Scopus and Google Scholar
• Research which is freely available for redistribution
Submit your manuscript at
www.biomedcentral.com/submit
Lüdemann et al. Radiation Oncology 2011, 6:107
/>Page 10 of 10