Báo cáo khoa học: " Investigation of the usability of conebeam CT data sets for dose calculation" pptx
Bạn đang xem bản rút gọn của tài liệu. Xem và tải ngay bản đầy đủ của tài liệu tại đây (1.1 MB, 13 trang )
BioMed Central
Page 1 of 13
(page number not for citation purposes)
Radiation Oncology
Open Access
Research
Investigation of the usability of conebeam CT data sets for dose
calculation
Anne Richter*, Qiaoqiao Hu, Doreen Steglich, Kurt Baier, Jürgen Wilbert,
Matthias Guckenberger and Michael Flentje
Address: Julius-Maximilians-University, Department of Radiation Oncology, Wuerzburg, Germany
Email: Anne Richter* - ; Qiaoqiao Hu - ;
Doreen Steglich - ; Kurt Baier - ; Jürgen Wilbert -
wuerzburg.de; Matthias Guckenberger - ; Michael Flentje -
* Corresponding author
Abstract
Background: To investigate the feasibility and accuracy of dose calculation in cone beam CT (CBCT) data sets.
Methods: Kilovoltage CBCT images were acquired with the Elekta XVI system, CT studies generated with a
conventional multi-slice CT scanner (Siemens Somatom Sensation Open) served as reference images. Material
specific volumes of interest (VOI) were defined for commercial CT Phantoms (CATPhan
®
and Gammex RMI
®
)
and CT values were evaluated in CT and CBCT images. For CBCT imaging, the influence of image acquisition
parameters such as tube voltage, with or without filter (F1 or F0) and collimation on the CT values was
investigated. CBCT images of 33 patients (pelvis n = 11, thorax n = 11, head n = 11) were compared with
corresponding planning CT studies. Dose distributions for three different treatment plans were calculated in CT
and CBCT images and differences were evaluated. Four different correction strategies to match CT values (HU)
and density (D) in CBCT images were analysed: standard CT HU-D table without adjustment for CBCT; phantom
based HU-D tables; patient group based HU-D tables (pelvis, thorax, head); and patient specific HU-D tables.
Results: CT values in the CBCT images of the CATPhan
®
were highly variable depending on the image acquisition
parameters: a mean difference of 564 HU ± 377 HU was calculated between CT values determined from the
planning CT and CBCT images. Hence, two protocols were selected for CBCT imaging in the further part of the
study and HU-D tables were always specific for these protocols (pelvis and thorax with M20F1 filter, 120 kV; head
S10F0 no filter, 100 kV). For dose calculation in real patient CBCT images, the largest differences between CT
and CBCT were observed for the standard CT HU-D table: differences were 8.0% ± 5.7%, 10.9% ± 6.8% and
14.5% ± 10.4% respectively for pelvis, thorax and head patients using clinical treatment plans. The use of patient
and group based HU-D tables resulted in small dose differences between planning CT and CBCT: 0.9% ± 0.9%,
1.8% ± 1.6%, 1.5% ± 2.5% for pelvis, thorax and head patients, respectively. The application of the phantom based
HU-D table was acceptable for the head patients but larger deviations were determined for the pelvis and thorax
patient populations.
Conclusion: The generation of three HU-D tables specific for the anatomical regions pelvis, thorax and head
and specific for the corresponding CBCT image acquisition parameters resulted in accurate dose calculation in
CBCT images. Once these HU-D tables are created, direct dose calculation on CBCT datasets is possible without
the need of a reference CT images for pixel value calibration.
Published: 16 December 2008
Radiation Oncology 2008, 3:42 doi:10.1186/1748-717X-3-42
Received: 1 October 2008
Accepted: 16 December 2008
This article is available from: />© 2008 Richter et al; licensee BioMed Central Ltd.
This is an Open Access article distributed under the terms of the Creative Commons Attribution License ( />),
which permits unrestricted use, distribution, and reproduction in any medium, provided the original work is properly cited.
Radiation Oncology 2008, 3:42 />Page 2 of 13
(page number not for citation purposes)
Background
Recently, cone-beam CT (CBCT) technology found on lin-
ear accelerators has enabled three dimensional imaging of
the patient in the treatment position [1]. These images are
most frequently used for image-guidance: positioning of
the patient or target position is evaluated by a comparison
of the CBCT with the planning CT [2-6]. Set-up errors are
then corrected by shifts of the treatment couch. This proc-
ess of image-guidance has been shown to improve the
accuracy of radiotherapy treatment at multiple treatment
sites [7-9]: the major advantage of the CBCT system is kil-
ovoltage (kV) volume imaging with sufficient soft-tissue
contrast to visualize the target itself [10]. This allows
detection and correction of internal target position errors,
which are independent of the bony anatomy.
However, not only spatial changes of the target position
are seen in these verification images. In conventionally
fractionated radiotherapy, regression of the treated mac-
roscopic tumours has been observed especially for head
and neck tumours and lung cancer [11,12]. Adaption of
radiotherapy treatment to such changes of the target vol-
ume is currently being discussed intensely. The use of one-
beam CT images for adaptive radiotherapy would avoid
repeated spiral CT imaging in addition to images acquired
for image-guidance. Avoiding excessive radiation dose to
the patient for image acquisition and reduced work-load
are consequences if CBCT images can be used for treat-
ment planning and dose calculation. Letourneau et al.
presented an approach to use cone-beam CT images for
target definition, online planning and efficient process
integration [13]. For accurate dose calculation based on
CBCT images, the relationship between Hounsfield units
(HU) and density (D) is required. Several authors have
investigated the suitability of the CBCT for dose calcula-
tion and developed different pixel correction strategies
depending on the CBCT system properties [11,13-23].
Megavoltage (MV) and kV CBCTs offer different image
performance with regard to soft tissue contrast, scatter
radiation and image acquisition settings [11,21].
The CBCT imaging technique and its acquisition parame-
ters influence the image quality by the amount of radia-
tion scattered at the level of the flat panel. Image
acquisition for CBCT can be modified by tube voltage,
collimation, filter type, half and full fan mode. A change
of the acquisition parameters for kV CBCT affects the
image quality and pixel value distribution. In addition,
the magnitude of scatter and artefacts are affected by the
scanned object size [22-24], CT value fluctuation due to a
change in scatter irradiation [22]. Compared to planning
CTs, a reduced number of projections is acquired and less
information is available for image reconstruction [17].
The CT values of a CBCT cannot directly be used for dose
calculations, because this might lead to inaccurate dose
calculations [21].
Basic procedures for relating CT values to radiological
parameters and implementing them in treatment plan-
ning systems have been described by several authors
[25,26]. Several methods are described in the literature to
improve image quality of CBCT images [11,13,18,20,21].
Pixel correction strategies range from look-up-tables, his-
togram matching [15,18,20] to pixel calibration based on
phantom measurements [11,20,22,26,27]. Zijtveld et al.
described a method to map HU from planning CT to
CBCT based on a rigid registration algorithm [21] to
account for deformation of the planning and CBCT. A ref-
erence CT is needed to compare and correct the CT values
for all methods using registration procedures. Currently,
two systems offer CBCT for image-guided radiotherapy:
Elekta XVI and Varian OBI. There are differences between
these two systems regarding their usability for dose calcu-
lation. To date most investigations were based on the Var-
ian OBI system. The investigation of Varian OBI system
showed only small differences in density calibration
between planning and CBCT (less than 10 HU) which
makes it easily available for treatment planning [17,23].
In contrast, the Elekta Synergy CBCT system XVI showed
larger deviations in HU which makes correction strategy
necessary [16,21].
This work analyses the suitability of the Elekta CBCT sys-
tem for dose calculation. The impact of CBCT number
accuracy and reproducibility on dose calculation per-
formed with these images is investigated for phantom
data and three patient populations.
Methods
Two CT volume imaging systems were used for image
acquisition and dose calculation: the planning CT
(Somatom Sensation Open, Siemens, Forchheim, Ger-
many) as a reference and the CBCT (Synergy XVI, Elekta,
Crawley, UK). Both systems operate with tube voltages
ranging from 80 to 140 kV. Images with the conventional
helical CT scanner were acquired with the standard presets
of the manufacturer.
For CBCT imaging, the kV panel can be positioned later-
ally (using motorized movements) at three different 'field
of view' (FOV) positions: S, M and L. In the medium FOV
position (M), the centre of the kV detector panel is offset
by 115 mm from the kV central axis and then a full fan
rotation (360°) is necessary for complete image acquisi-
tion. If the panel position is placed in small FOV position
(S), the kV central axis is equal to the panel centre and a
half fan is sufficient [28]. The bow tie filter (F1) is a kV fil-
ter which is inserted between the X-ray source and the
Radiation Oncology 2008, 3:42 />Page 3 of 13
(page number not for citation purposes)
patient to reduce intensity variations across the detector
[23]. For S20F0 the cone beam data set was acquired with
flat panel parked in position S, no filter (F0) was inserted
and 20 cm longitudinal extension.
First the impact of scan parameters (tube voltage, filtering
and collimation) on CT values in the CBCT images was
evaluated for phantom measurements, pixel correction
strategies were developed and dose calculation was per-
formed on a rigid phantom geometry. Afterwards dose
calculations were performed in CBCT studies of real
patients. The patient data was initially required for verifi-
cation of the treatment position and was retrospectively
evaluated for dose calculation.
Phantom measurements
Phantom measurements were performed to eliminate CT
value variations due to deformation processes during radi-
otherapy treatment. In the first part, CT and CBCT images
of 2 phantom geometries were acquired and compared
with respect to their suitability for pixel value calibration:
CATPhan
®
(CATPhan
®
CTP503, Phantom Laboratory,
Salem, NY) and Gammex RMI
®
(Gammex RMI 467
®
,
Gammex RMI, Middleton, WI). The Gammex RMI
®
was
used to establish the relationship between the density of
different materials and their corresponding CT values for
the planning CT. The body of the CATPhan
®
contains
seven different material inserts listed in Table 1. The influ-
ence of various scan parameters (tube voltage, filter and
collimator, rotation angle) on the CT values was investi-
gated using 6 different CBCT presets (M20F1 120 kV,
M10F1 120 kV; S20F0 120 KV 40mA, S20F0 120 KV 25
mA, S10F0 100 kV, S20F0 100 kV). Volumes of interest
(VOI) were defined (figure 1a) in regions of uniform den-
sity in the CATPhan
®
and the corresponding mean CT val-
ues were measured in the planning CT and the CBCT data
sets. Based on these measurements, the density calibration
tables (HU-D table) were determined. The ADAC Pinna-
cle treatment planning system (TPS) v7.6s (Philips/
ADAC, Milpitas, CA, USA) was used for contouring and
dose calculation, details about definition of HU-D table
were previously described by Saw et. al [26].
Phantom pixel correction
Based on the phantom measurements with different
CBCT imaging parameters, different pixel correction strat-
egies were developed which are listed below (see also
table 2):
- A standard HU-D table (HU-D
pCT
) was established for
the Siemens Somatom CT scanner for both phantoms
(Gammex RMI
®
and CATPhan
®
). The mean CT values were
determined in the planning CT for each VOI, i.e. for each
material insert and the corresponding density values were
determined based on the relationship between CT values
and physical density as specified by the phantom manu-
factures.
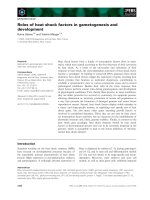
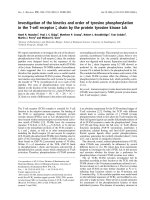
(a) Axial slice of CATPhan
®
geometry acquired with the CBCT system and volumes of interest for each material insert: 1 Acrylic, 2 Air, 3 Polystyrene, 4 LDPE, PMP, 6 Teflon
®
, 7 Delrin
®
Figure 1
(a) Axial slice of CATPhan
®
geometry acquired with the CBCT system and volumes of interest for each material insert: 1
Acrylic, 2 Air, 3 Polystyrene, 4 LDPE, PMP, 6 Teflon
®
, 7 Delrin
®
. (b) Example of volume definition for a pelvis patient: 8 air, 9
fat, 10 fluid, 11 femoral head.
(a) (b)
1
2
3
2
4
5
6
7
1
2
3
2
4
5
6
7
9
10
8
11
9
10
8
11
Radiation Oncology 2008, 3:42 />Page 4 of 13
(page number not for citation purposes)
- HU-D tables were generated from the phantom CBCT
datasets of the CATPhan
®
separately for the different
image acquisition parameters: the mean CT values within
each material insert (e.g. CBCT#
Air
, CBCT#
PMP
) were
measured and the corresponding density values of the
planning CT described the CBCT phantom HU-D table.
HU-D
M20F1
is specific for CBCT images acquired with col-
limation M20, bow tie filter F1 and tube voltage 120 kV.
The procedure was repeated for the preset S10F0 which
resulted in a second HU-D table (HU-D
S10F0
).
Phantom dose calculation
The dose distributions in planning CT and CBCT of the
CATPhan
®
were compared by applying three different iso-
centric plans (one field (1F), four fields (4F) and clinical
seven field IMRT plan) to the planning CT first. The beam
arrangements including the calculated monitor units were
then transferred to the CBCT phantom geometry. For 1F
und 4F techniques, the mean doses within the contoured
VOIs (figure 1a) were compared between dose calculation
in the planning CT and CBCT. Dose deviation was
expressed by the mean of absolute differences and its
standard deviation within the VOIs. For the IMRT beam
arrangement dose distributions were compared with
orthogonal dose planes. For dose plane comparison dose
difference was evaluated in a region of interest surround-
ing the high dose region.
Measurements in real patients data-sets
The second part of this study is based on data sets of 33
patients (11 prostate cancer, 11 head tumour and 11 tho-
rax patients): variability of CT values and the accuracy of
dose calculation was investigated in these CBCT data sets.
According to our clinical protocol, CBCT images of thorax
and pelvis patients were acquired with the following scan-
ning parameters: collimation M20, bow tie filter F1 120
kV and rotation angle 360°. A further CBCT preset was
used for image acquisition of the head patients: collima-
tion S10, no filter (F0) and rotation angle of 180°. Corre-
sponding planning CT datasets were taken for
comparison.
Depending on the tumour location and scan volume, dif-
ferent VOIs in areas of nearly homogenous density were
defined in the planning CT and CBCT. For pelvis patients
air, fat, fluid, symphysis, femoral head and femur were
Table 1: Phantom inserts.
Material specified density (g/cm
3
)HU-D
pCT
density (g/cm
3
)HU-D
pCT
CT value (HU)
Air 0 0 0
PMP C
6
H
12
(CH
2
) 0.83 0.81 800
LDPE C
2
H
4
0.92 0.91 900
Polystyrene C
8
H
8
1.05 0.96 960
Acrylic C
5
H
8
O
2
1.18 1.12 1120
Delrin
®
proprietary 1.41 1.27 1340
Teflon
®
CF
2
2.16 1.61 1950
CATPhan
®
material inserts and their specified density values are listed; for comparison the measured CT values in the planning CT and the
corresponding density determined from the Gammex RMI
®
table HU-D
pCT
.
Table 2: Phantom measurements.
1F 4F IMRT plan
Correction strategy 6 MV 18 MV 6 MV 18 MV 10 MV
(a) CBCT, S10F0
HU-D
pCT
19.9% ± 2.5% 15.5% ± 2.1% 19.5% ± 0.7% 14.7% ± 0.5% 8.8% ± 6.3%
HU-D
S10F0
4.2% ± 1.2% 2.6% ± 0.9% 1.8% ± 0.3% 2.1% ± 0.3% 0.8% ± 0.8%
(b) CBCT, M20F1
HU-D
pCT
18.4% ± 3.7% 13.7% ± 2.4% 12.7% ± 1.0% 11.6% ± 0.5% 6.8% ± 5.6%
HU-D
M20F1
2.6% ± 0.7% 1.9% ± 0.9% 3.2% ± 0.7% 1.1% ± 0.3% 1.0% ± 1.1%
Comparison of dose calculation based on planning CT and CBCT with different correction strategies for the different test plans (1F, 4F and IMRT)
for phantom studies acquired with different presets: (a) collimation S10 and no filter (S10F0) and (b) collimation M20 and bow tie filter (M20F1).
The standard table (HU-D
pCT
) was created based on the CT and densities values of the planning CT phantom scan. The phantom based tables HU-
D
M20F1
, HU-D
S10F0
were based on the CBCT phantom data sets acquired M20F1 and S10F0, respectively. The mean difference between the dose in
the planning CT and the CBCT is given in percentage of the dose based on the planning CT.
Radiation Oncology 2008, 3:42 />Page 5 of 13
(page number not for citation purposes)
delineated; the position of these VOIs was in fixed rela-
tionship to the bony anatomy (Figure 1b). In the thorax
scans the VOIs were contoured in air, lung, fat, blood,
muscle, bone and cortical bone. In the data sets of the
head patients, contours were defined for air, neck support,
eye, brain and skull. The mean CT values of these VOIs in
the planning CT were used as reference for generation of
the HU-D tables.
In addition, organs were contoured for dose comparison
from a clinical point of view. The clinically treated radio-
therapy plans were recalculated employing the CBCT data
sets and doses to target volumes and organs-at-risk were
compared by means of dose-volume histogram (DVH)
comparisons. If the beam arrangement for head patients
included non-coplanar beams and the CBCT patient
model was not complete at the superior end, we excluded
these patients from the patient plan evaluation. Some of
the thorax and pelvis patients showed incomplete patient
models because the body contour exceeded the FOV of the
CBCT- these patients were excluded as well. The following
volumes were contoured in the data sets of the thorax
patients: CTV, PTV, oesophagus, spinal cord, heart and
ipsilateral lung. The contours of PTV, PTV Boost, PTV
Ring1, PTV Ring2, bladder and rectum were delineated for
the pelvis patients. For head patients PTV, PTV Ring1, PTV
Ring2, chiasm and brainstem were contoured. Two rings
(PTV Ring1, PTV Ring2, each having a radial extend of 1
cm) were generated around the PTV to consider the dose
gradient for dose comparison. The mean dose, D05 and
D95 were compared for target volumes, D01 for organs at
risk and the mean dose for the ipsilateral lung.
Patient pixel correction
Different HU-D tables were used for the dose calculation
in the clinical CBCT data sets (see table 3):
- The standard table HU-D
pCT
was based on planning CT
images previously described for the phantom study. No
adjustment of this table for CBCT imaging was performed.
Density values for patient specific VOIs (air, fat, fluid )
in the CATPhan
®
were taken from the relation ship in HU-
D
pCT
in the Gammex RMI
®
density phantom.
- Acquisition parameter specific tables HU-D
M20F1
and
HU-D
S10F0
were based on CBCT images of the CATPhan
®
Table 3: Patient measurements.
1F 4F patient plan
Correction strategy 6 MV 18 MV 6 MV 18 MV dose plane DVH
(a) Pelvis Patients
standard HU-D
pCT
21.6% ± 3.7% 15.7% ± 3.4% 14.1% ± 2.1% 10.5% ± 1.7% 8.0% ± 5.7% 19.1% ± 3.4%
phantom based HU-D
M20F1
7.7% ± 5.2% 5.6% ± 3.9% 11.2% ± 3.7% 8.4% ± 2.9% 5.2% ± 3.7% 12.7% ± 1.5%
group based HU-D
Pelvis
2.7% ± 2.3% 2.4% ± 2.0% 2.2% ± 1.9% 1.9% ± 1.5% 0.9% ± 0.9% 1.3% ± 1.0%
patient based HU-D
Pat_i
2.4% ± 1.7% 2.0% ± 1.4% 1.6% ± 1.3% 1.2% ± 1.1% 0.9% ± 0.9% 1.2% ± 0.9%
(b) Thorax Patients
standard HU-D
pCT
21.6% ± 9.6% 16.4% ± 7.2% 17.1% ± 5.8% 12.6% ± 4.6% 10.9% ± 6.8% 13.8% ± 10.5%
phantom based HU-D
M20F1
11.5% ± 7.1% 8.9% ± 5.4% 10.4% ± 4.6% 7.7% ± 3.7% 8.1% ± 3.7% 6.2% ± 4.7%
group based HU-D
Thorax
4.1% ± 3.5% 3.2% ± 2.8% 3.2% ± 2.2% 2.6% ± 1.9% 1.7% ± 1.7% 1.7% ± 2.4%
patient based HU-D
Pat_i
4.0% ± 3.4% 3.0% ± 2.7% 2.9% ± 1.9% 2.3% ± 1.7% 1.8% ± 1.6% 1.7% ± 2.0%
(c) Head Patients
standard HU-D
pCT
22.4% ± 10.2% 14.9% ± 9.7% 19.1% ± 4.6% 10.9% ± 5.8% 14.5% ± 10.4% 16.2% ± 12.7%
phantom based HU-D
S10F0
3.0% ± 2.7% 2.5% ± 1.0% 2.3% ± 1.9% 2.0% ± 1.7% 1.4% ± 2.4% 1.6% ± 2.2%
group based HU-D
Head
2.1% ± 1.7% 2.1% ± 1.5% 1.6% ± 1.4% 1.5% ± 1.5% 1.3% ± 2.3% 1.4% ± 1.9%
patient based HU-D
Pat_i
2.1% ± 1.7% 1.9% ± 1.5% 1.5% ± 1.3% 1.4% ± 1.4% 1.5% ± 2.5% 1.4% ± 1.9%
Comparison of dose calculation based on planning CT and CBCT with different correction strategies for the different test plans (1F, 4F and IMRT)
for (a) pelvis, (b) thorax and (c) head patients. The mean difference between the dose in the planning CT and the CBCT is given in percentage of
the dose based on the planning CT. The standard table (HU-D
pCT
) was generated from CT and density values measured in the planning CT. The
phantom based tables HU-D
M20F1
, HU-D
S10F0
were based on the CBCT phantom data sets acquired with collimation M20/bow tie filter and
collimation S10/no filter, respectively. The group based tables represent the mean HU-D tables (HU-D
Pelvis
, HU-D
Thorax
, HU-D
Head
) for the specific
patient population (pelvis, thorax, head) while the individual tables (HU-D
Pat_i
) were created based on each patient data set. Dose differences were
calculated in volumes of interest for 1F and 4F techniques. For patient plan the dose was compared based on dose planes and dose volume
histograms (DVH).
Radiation Oncology 2008, 3:42 />Page 6 of 13
(page number not for citation purposes)
as described above. HU-D
M20F1
was used for dose calcula-
tion in the CBCT data sets of the thorax and pelvis patient.
HU-D
S10F0
was applied to the CBCT data sets of the head
patients.
- Tables were generated separately for the three different
patient groups head, thorax and pelvis (HU-D
Pelvis
, HU-
D
Thorax
and HU-D
Head
): these tables were based on the
mean CBCT value of each patient population. The CT val-
ues were taken from the patient CBCT data sets and den-
sity for each VOI was determined in the planning CT and
was listed to the corresponding CBCT value.
- Patient individual tables (HU-D
Pat_i
) were created sepa-
rately for each patient: the mean CBCT value for each VOI
in the patient CBCT data set was calculated and this was
allocated to the corresponding density of the planning CT.
Patient dose calculation
According to the phantom study, the same beam arrange-
ments were applied to both image sets (planning CT and
CBCT) and differences in the dose distribution were ana-
lysed. For incomplete patient models in the thorax popu-
lation, a two beam technique was used instead of 4F.
Comparisons with real patient plans were performed for 5
pelvis, 5 thorax patients and 5 head patients. Treatment
plans of the head patients consisted of three-dimensional
conformal plans with 4 to 9 beams and 6 MV photon
energy. Treatment plans of the thorax patients consisted
of three-dimensional conformal plans with 6 to 9 beams
of 6 and 10 MV photon energy. All plans of the pelvis
patients were based on IMRT for prostate cancer with 7
beams; photon energy was 10 MV, the number of step-
and-shoot segments ranged from 30 to 50.
Planning CT and CBCT image sets were registered and
then the plan geometry was transferred to the CBCT with-
out any changes, i.e. the number of total monitor units
remained unchanged. The dose was recalculated in the
CBCT based on the four different pixel correction strate-
gies described above. The dose distributions were evalu-
ated by DVH and dose planes. Orthogonal dose planes
were calculated in the coronal and sagittal orientation
with a source-plane-distance of 100 cm. For the IMRT
techniques, the dose planes were analysed using Scand-
itronix, Omni Pro-IMRT RT1.5 software (Scanditronix-
Wellhöfer/IBA, Uppsala, Sweden). Dose differences
between dose planes were quantified by the absolute
mean difference within a region of interest which was lim-
ited to the high dose area. Because of organ deformation
between image acquisition of the planning CT and the
CBCT, additional contours were delineated in the CBCT
data set and included in DVH evaluation: for pelvis
patients, rectum or bladder were recontoured and for tho-
rax patients the lung was delineated in the CBCT image
sets.
Results
Phantom Study
The image quality and the CT values of the CBCT data set
were different to the planning CT. This is illustrated in fig-
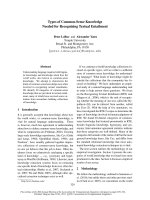
ure 1. Steep gradients in CT values, for example the
peripheral contour of the phantom, were less steep in the
CBCT data set than in the planning CT (figure 2). For the
profile of the CBCT, less high frequency variation of the
CT values was observed and the phantom edge appeared
low pass filtered compared to the planning CT. Due to the
reduced number of projections (400 – 700) for image
reconstruction the CBCT offered a limited image quality
compared to the planning CT (2000 – 4000 projections).
Intensity profile in an axial CT slice for the CATPhan
®
geometry acquired with the planning CT (a) and CBCT system (M20F1) (b)Figure 2
Intensity profile in an axial CT slice for the CATPhan
®
geometry acquired with the planning CT (a) and CBCT system (M20F1)
(b).
(a) (b)
Radiation Oncology 2008, 3:42 />Page 7 of 13
(page number not for citation purposes)
The CT values in the CBCT were determined for the most
frequently used CBCT acquisition parameters. A wide var-
iation of CT values within the isodense VOIs was observed
depending on image acquisition parameters of the CBCT
tube voltage, collimation and filter type. The variation was
evident for all seven subvolumes (material inserts) in the
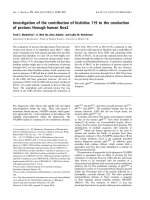
phantom (564 HU ± 377 HU). Figure 3 shows the mean
CT value for each material insert depending on the six dif-
ferent presets for CBCT acquisition. For all presets, the
largest difference between planning CT and CBCT was
observed for the air-insert. The CT value in the planning
CT was nearly zero while the pixels in the CBCT were rang-
ing from 540 to 1300 HU depending on the preset type.
For the presets M20F1 and S10F0, the difference in CT val-
ues was reduced for denser materials like Delrin
®
and
Teflon
®
(Figure 4).
The effect of different pixel correction strategies for dose
calculation was investigated. The HU-D tables were inter-
polated bilinearly. For the standard table HU-D
pCT
, the CT
values were determined in CATPhan
®
and Gammex RMI
®
geometry. Both resulting tables for HU-D
pCT
were in good
agreement for densities ranging from 0 – 1.18 g/cm
3
(Air,
polymethylpentene PMP, low-density polyethylene
LDPE, Polystyrene and Acrylic). The measured CT values
for Delrin
®
and Teflon
®
(1340 HU and 1990 HU) were in
agreement with the literature values but the specified den-
sity values (1.41 g/cm
3
and 2.16 g/cm
3
) did not agree with
the HU-D table of Gammex RMI
®
. Gammex RMI
®
is espe-
cially made for electron density calibration and contains
tissue equivalent materials (Brain, Bone, Liver) while the
CATPhan
®
is made of tissue substitutes (Acryil, Delrin
®
,
Teflon
®
). Schneider et al obtained different HU-D tables
depending on calibration material: Mylar/Melinex/
Teflon
®
and biological tissue inhomogeneities [29]. For
the current investigation, we established the HU-D
pCT
relationship based on the Gammex RMI
®
. Dose calcula-
tions in the CBCT of the CATPhan
®
were performed with
HU-D
pCT
, HU-D
M20F1
and HU-D
S10F0
and dose distribu-
tions were compared with the planning CT. The results for
the phantom geometry are listed in table 2. For all simple
field arrangements (1F and 4F), the accuracy of dose cal-
culation was not acceptable for HU-D
pCT
. Results were
considerably improved for the preset based correction
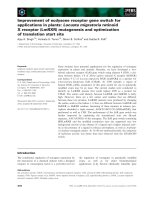
Variation of CT values in Hounsfield units (HU) for seven different materials measured in the planning CT and the CBCTFigure 3
Variation of CT values in Hounsfield units (HU) for seven different materials measured in the planning CT and the CBCT. Six
presets for CBCT image acquisition were compared. Large variations in HU were observed for each material insert depending
on the CBCT acquisition parameters.
0
500
1000
1500
2000
2500
3000
Air PMP LDPE Polystyrene Acrylic Delrin® Teflon®
material inserts
CT value (HU)
planning CT
M20F1 120kV
M10F1 120kV
S20F0 120kV 40mA
S20F0 120kV 25mA
S10F0 100kV
S20F0 100kV
Radiation Oncology 2008, 3:42 />Page 8 of 13
(page number not for citation purposes)
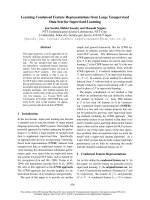
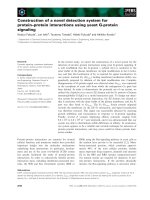
Generated HU-D tables for planning CT (blue filled circles) and the group based CBCT (red open circles) based on three patient populations: (a) pelvis patients, (b) thorax patients and (c) head patientsFigure 4
Generated HU-D tables for planning CT (blue filled circles) and the group based CBCT (red open circles) based on three
patient populations: (a) pelvis patients, (b) thorax patients and (c) head patients.
(a)
0.0
0.5
1.0
1.5
2.0
0 500 1000 1500 2000 2500 3000
CT value (HU)
physical density (g/cm³)
planning CT
CBCT
(b)
0.0
0.5
1.0
1.5
2.0
0 500 1000 1500 2000 2500 3000
CT value (HU)
physical density (g/cm³)
planning CT
CBCT
(c)
0.0
0.5
1.0
1.5
2.0
0 500 1000 1500 2000 2500 3000
CT value (HU)
physical density (g/cm³)
planning CT
CBCT
Radiation Oncology 2008, 3:42 />Page 9 of 13
(page number not for citation purposes)
strategy (HU-D
M20F1
and HU-D
S10F0
). If 1F 6 MV was
applied to the phantom images acquired with S10F0 and
M20F1 using the corresponding preset based tables (HU-
D
S10F0
, HU-D
M20F1
) the mean difference in dose was
reduced from 19.9% ± 2.5% and 18.4% ± 3.7% to 4.2% ±
1.2% and 2.6 ± 0.7%. Larger deviations were found for the
1F techniques than for the 4F techniques because of the
location of the VOIs within areas of the inhomogeneous
dose distribution for the 1F technique. For the IMRT tech-
nique, the dose deviation was determined by evaluating
the dose planes within a region of interest surrounding
the high dose region. IMRT dose calculation in the phan-
tom geometry (displayed in figure 1) showed the largest
deviation for HU-D
pCT
: 8.8% ± 6.3% and 6.8% ± 5.6% for
CBCT images acquired with presets S10F0 and M20F1.
When the preset based tables (HU-D
S10F0
, HU-D
M20F1
)
were applied for dose calculation the deviations decreased
and the accuracy of dose calculation was improved to dif-
ferences of 0.8% ± 0.8% and 1.0% ± 1.1%.
Patient study
The HU-D tables calculated for the three patient groups
(pelvis, thorax and head) and the standard HU-D
pCT
are
shown in figure 4. For the planning CT, the mean CT val-
ues within the VOIs and the corresponding density values
are plotted with filled circles: identical HU-D
pCT
relation-
ship was observed for the pelvis, thorax and head patient
group. The density values of the planning CT were taken
as reference for calibration of the CBCT curves. The mean
regression curve of the CBCT data defined the patient
group based tables HU-D
Pelvis
, HU-D
Thorax
and HU-D
Head
.
The planning CT data shows CT values ranging from 0 to
2400 HU while the CBCT offers a limited data range from
666 to 2484 HU. The HU-D table was interpolated bilin-
early. This was based on the finding of several investiga-
tors [26,27]. The quality of the bilinear fit was estimated
by the coefficient of determination (COD). The data fits
for the generated tables (HU-D
pCT
, HU-D
Pelvis
, HU-D
Thorax
and HU-D
Head
) showed good correlation with COD
between 0.99 and 1.
Table 3 summarizes the comparison of the dose distribu-
tions in the planning CT and the corresponding CBCT for
three patient populations using the four different pixel
correction strategies described above. The largest dose
deviation was observed with 1F 6 MV using the standard
CT table HU-D
pCT
: differences to dose distributions in the
planning CT were 21.6% ± 3.7%, 22.4% ± 10.2% and
21.6% ± 9.6% for the pelvis, thorax and head patients.
Application of CATPhan
®
tables HU-D
M20F1
and HU-
D
S10F0
improved dose calculation accuracy in the CBCTs
significantly: differences were about 10% for the pelvis
and thorax group compared to differences less than 5%
for the head group. The use of patient and group based
HU-D tables resulted in small dose differences between
planning CT and CBCT: differences were less than 5%.
Nearly the same precision in dose calculation was
achieved with the averaged group tables (HU-D
Pelvis
, HU-
D
Thorax
and HU-D
Head
) compared to patient specific tables
HU-D
Pat_i
.
Dose distribution and DVH for planning and CBCT are
shown in figures 5, 6 and 7 for one selected patient of each
population. These dose calculations were based on the
patient specific HU-D tables (HU-D
Pat_i
). DVH compari-
son showed good correlation between the calculated
doses in planning and CBCT: mean dose differences was
1.20% ± 0.91%, 1.72% ± 0.99% and 1.36% ± 1.96% in all
contoured volumes for pelvis, thorax and head patients.
The dose distribution in the ring contours around the PTV
was similar for planning CT and CBCT which implies the
same dose gradient around the PTV. The dose plane eval-
uation showed small deviations: 0.9% ± 0.9%, 1.8% ±
1.6% and 1.5% ± 2.5% for pelvis, thorax and head
patients.
Figure 5 shows the comparison of the IMRT dose distribu-
tion for one pelvis patient using the patient specific table
HU-DPat_i: differences in the dose planes were small with
0.7% ± 0.5% for the selected patient. Almost the same
accuracy was attained by using the patient group based
table HU-DPelvis. Changes in rectum and bladder filling
at the time of CBCT image acquisition for the selected
patient necessitated an additional rectum and bladder
contour delineation in the CBCT and evaluation in the
DVH. An increased volume of the adjusted rectum in the
CBCT was exposed to doses larger than 20 Gy and simul-
taneously the low dose region was reduced. The bladder
volume was increased by 30 cm3 which resulted in a
mean dose reduction of 11%.
Dose comparison for one thorax patient is shown in figure
6 based on the patient specific table HU-D
Pat_i
. Despite an
incomplete patient model, the patient was selected for
dose comparison because no beam entered the patient at
this site. The patient was treated with an extracranial ster-
eotactic technique which was transferred to the CBCT.
Only small differences were detected in the DVH for the
deformed lung volumes. The changes in lung volume
were 356 cm
3
and 340 cm
3
for the left and right lung,
respectively which increased the mean dose by 3% in the
CBCT.
Figure 7 shows the dose distribution in planning and
CBCT for a head patient. We assumed there was no organ
deformation for the head patient population. The dose
was based on a 5 field IMRT technique with 30 step-and-
shoot segments. The use of phantom, group or patient
based HU-D tables resulted in similar precision of 1.3% to
1.6% for the 5 selected patients of the head population.
Radiation Oncology 2008, 3:42 />Page 10 of 13
(page number not for citation purposes)
The surface of the head was more precise in the planning
CT than in the CBCT. Consequently, we observed larger
dose deviations near patient outline due to the smoother
pixel gradient in the CBCT.
Discussion
Recent progress in imaging and radiotherapy treatment
planning has made adaptive radiotherapy a focus of
research. Its aim is to adjust the radiotherapy treatment
plan to changes occurring during the course of treatment:
regression of the tumour due to radio (chemo-) therapy
and loss of patient weight are considered to be the most
significant. Adaptive radiotherapy requires frequent and
repetitive imaging of the patient to visualize and quantify
these changes. Using CBCT studies, which were acquired
for image-guidance, for plan adaptation is a logical step to
keep patient radiation dose and work-load within accept-
able limits. Consequently, it was the aim of this study to
establish techniques for accurate dose calculation in CBCT
studies.
Large deviations of CT values between planning CT and
CBCT were observed: this was similar for phantom and
clinical CBCT studies. This is in agreement with data from
Zijtveld et al. and Yang et al. [21,22]. In consequence the
use of HU-D
pCT
is associated with unacceptable inaccurate
dose calculation in the CBCT studies. Additionally, CT
values were highly influenced by the CBCT image acquisi-
tion parameters tube voltage, filtering and collimation.
This suggests that a single HU-D table will not be applica-
ble to different imaging presets, as used for head or pelvis
CBCT imaging for example. As a consequence we devel-
oped specific HU-D tables for the two CBCT image acqui-
sition presets, which are most frequently used in our
clinical practice.
The use of phantom based HU-D tables (HU-D
M20F1
, HU-
D
S10F0
) resulted in small errors for CBCT dose calculation
in the cranial region. This is explained by a similar geom-
etry and size of the CATPhan
®
compared to the patients
heads. However, these phantom based HU-D tables were
inaccurate for thorax and pelvis patients resulting in errors
larger than 5%. This clearly shows the influence of the
patient geometry on CT values in the CBCT and the sub-
sequent influence on dose calculation. The influence of
the scan object size was previously investigated by Yang et
al who observed an increasing scatter contribution for
larger objects [22]. This is borne out by our results: we
observed higher CT values for outside patient air with
increasing body size.
Isodose distribution in axial slices for IMRT technique of a pelvis patient: (a) dose calculation based on planning CT and stand-ard HU-D table and (b) dose in CBCT using the patient based HU-D table and (c) DVH for the contoured ROIs in the planning CT (solid) and CBCT (dashed)Figure 5
Isodose distribution in axial slices for IMRT technique of a pelvis patient: (a) dose calculation based on planning CT and stand-
ard HU-D table and (b) dose in CBCT using the patient based HU-D table and (c) DVH for the contoured ROIs in the planning
CT (solid) and CBCT (dashed). An additional rectum volume was contoured and evaluated in the DVH (dashed-dotted) due to
a reduced rectum filling in the CBCT data set.
(a)
(b)
(c)
0%
20%
40%
60%
80%
100%
0 10203040506070
Dose in Gy
Volume in %
pCT PTV Boost pCT PTV1
pCT PTVring1 pCT PTVring2
pCT Rektum CBCT Rektum deform
pCT Blase CBCT Blase deform
Radiation Oncology 2008, 3:42 />Page 11 of 13
(page number not for citation purposes)
We observed only small differences between CBCT dose
calculation with HU-D tables specific for the patient
group or specific for each individual patient: errors were
less than 5%. Consequently, the generation of three differ-
ent HU-D tables would be sufficient for accurate dose cal-
culation in the head, thorax and pelvis region.
Furthermore, we expect applicability of HU-D
Head
for
CBCT dose calculation in the head and neck region and
HU-D
Pelvis
for dose calculation in the abdominal region.
Once the patient group based HU-D tables are created, no
reference data set (such as a planning CT) is needed for
comparison and/or rescaling of the pixel value. For the
presented approach, no segmentation of the CBCT
[14,19] for rescaling of the pixel values is necessary. The
dose calculation can be performed directly on the CBCT
dataset and no additional software tool is needed for dose
calculation. The method requires the possibility in the
TPS to create individual HU-D tables for dose calculation
based on CBCTs, which is not the case for all TPS (some
TPS use a formula to calculate the density from the CT
numbers instead of lookup tables).
We could not confirm the findings of Yoo et al. and Lee et
al. who observed only small differences between HU val-
ues of CBCT and planning CT based on the OBI system
[17,23]. Parker stated, that 5% uncertainty in determina-
tion of CT scanner density will result in deviation of 1%
in the calculated dose [27]. The comparison of HU in
planning CT and CBCT (M20F1) showed average differ-
ences of 40% for density 1 g/cm
3
. Uncertainty of 40% in
determination of CT scanner density resulted in dose
plane deviation of 8% for IMRT cases of the pelvis popu-
lation without any correction of CT values. This is in
agreement to the findings of Parker et al
Users of the Varian OBI system who developed correction
strategies reported dose deviation of 3% [17] for phan-
toms and 5% [17], 1% [22], 0.3% [15] for patient data.
Pixel correction of images acquired with the Elekta XVI
system resulted in dose differences of less than 1%
[16,21]. We achieved an accuracy of nearly 1 – 2% on
average which is comparable to the published data.
It should be noted that a full acquisition of the patient
model is needed to allow a complete dose calculation in
the process of adaptive radiotherapy. If some parts of the
patient model are out of the FOV in the CBCT, a reference
image set with the whole information is necessary to
replace missing pixels as demonstrated by van Zijtveld et
al. [21]. In our study we typically observed incomplete
patient models for thorax patients. Most of these patients
Isodose distribution in axial slices for IMRT technique of a thorax patient: (a) dose calculation based on planning CT and stand-ard HU-D table and (b) dose in CBCT using the patient based HU-D table and (c) DVH for contoured ROIs in the planning CT (solid) and CBCT (dashed)Figure 6
Isodose distribution in axial slices for IMRT technique of a thorax patient: (a) dose calculation based on planning CT and stand-
ard HU-D table and (b) dose in CBCT using the patient based HU-D table and (c) DVH for contoured ROIs in the planning CT
(solid) and CBCT (dashed). The lungs were recontoured in the CBCT data set and included in the DVH evaluation (dashed-
dotted).
(a)
(b)
(c)
0%
20%
40%
60%
80%
100%
0 10203040
Dose in Gy
Volume in %
pCT PTV pCT Ring1
pCT Ring2 pCT lung right
CBCT lung right deform pCT lung left
CBCT lung left deform pCT oesophagus
pCT cord
Radiation Oncology 2008, 3:42 />Page 12 of 13
(page number not for citation purposes)
were treated with stereotactic body-radiotherapy for
peripheral lesions. Consequently, the treatment isocentre
was not in the centre of the patient but in the centroid of
the peripheral lesion. Incomplete patient models were
acquired due to the FOV size of 41 cm in diameter for the
M collimation. The L collimation offers a larger FOV and
would ensure a complete acquisition of the patient
model; however, image quality is significantly decreased
with this large FOV. Currently, the M collimation is used
in our clinical protocol for thorax patients as a compro-
mise between image quality and FOV.
We found that the slope of the HU-D table varied depend-
ing on the tube voltage. The CBCT data sets were addition-
ally influenced by collimation and filter type. Therefore it
is important to ensure that for the generation of the group
based tables HU-D (HU-D
Pelvis
, HU-D
Thorax
, HU-D
Head
) all
data of the used patient population is acquired with the
same parameters and is consistent with parameters used
for the examined dataset for dose calculation.
The presented pixel correction strategies were based on
look-up-tables and did not consider any organ deforma-
tion. The time span between the acquisition of planning
CT and CBCT was about 3–5 days and organ deformation
can occur due to variations in organ fillings. Yang showed
that non-rigid image registration is a useful tool to con-
sider organ deformation between the reference and the
CBCT data set [22]. Additionally, such deformable image
registration will be necessary in the further process of
adaptive radiotherapy.
Conclusion
A correction of CT values was necessary for dose calcula-
tion with the cone beam data sets. The best accuracy of
dose calculation in CBCT images was achieved with
patient specific HU-D table; however differences to
patient group specific HU-D tables were clinically negligi-
ble. Three HU-D tables specific to CBCT image acquisition
parameters and specific to anatomical regions pelvis, tho-
rax and head and neck are considered to be sufficient.
Once the group based HU-D tables are created, direct dose
calculation on CBCT datasets is possible without the need
of a reference CT for pixel value calibration.
Competing interests
Presented in part at the Congress of "Deutschen Gesells-
chaft für Radioonkologie" (DEGRO – ÖGRO) 2008,
Vienna, Austria.
Authors' contributions
All authors read and approved the final manuscript. AR
designed the study and the analysis, performed the simu-
lations and revised the manuscript. QH participated in
Isodose distribution in axial slices for IMRT technique of a head patient: (a) dose calculation based on planning CT and standard HU-D table and (b) dose in CBCT using the patient based HU-D table and (c) DVH for contoured ROIs in the planning CT (solid) and CBCT (dashed)Figure 7
Isodose distribution in axial slices for IMRT technique of a head patient: (a) dose calculation based on planning CT and standard
HU-D table and (b) dose in CBCT using the patient based HU-D table and (c) DVH for contoured ROIs in the planning CT
(solid) and CBCT (dashed).
(a)
(b)
(c)
0%
20%
40%
60%
80%
100%
0 102030405060
Dose in Gy
Volume in %
pCT PTV pCT Ring1 pCT Ring2
pCT Hirnstamm pCT Chiasma
Publish with BioMed Central and every
scientist can read your work free of charge
"BioMed Central will be the most significant development for
disseminating the results of biomedical research in our lifetime."
Sir Paul Nurse, Cancer Research UK
Your research papers will be:
available free of charge to the entire biomedical community
peer reviewed and published immediately upon acceptance
cited in PubMed and archived on PubMed Central
yours — you keep the copyright
Submit your manuscript here:
/>BioMedcentral
Radiation Oncology 2008, 3:42 />Page 13 of 13
(page number not for citation purposes)
data collection and analysis. DS participated in data col-
lection and analysis. KB participated in the study design
and revised the manuscript. JW revised the manuscript.
MG revised the manuscript. MF revised the manuscript.
Acknowledgements
This work was partially supported by a grant from Elekta Oncology Sys-
tems, UK. We would like to thank Mark Gainey for proof reading of the
manuscript.
References
1. Jaffray DA, Siewerdsen JH, Wong JW, et al.: Flat-panel cone-beam
computed tomography for image-guided radiation therapy.
Int J Radiat Oncol Biol Phys 2002, 53:1337-1349.
2. Gong Y, Wang J, Bai S, et al.: Conventionally-fractionated image-
guided intensity modulated radiotherapy (IG-IMRT): a safe
and effective treatment for cancer spinal metastasis. Radiat
Oncol 2008, 3:11.
3. Meyer J, Wilbert J, Baier K, et al.: Positioning accuracy of cone-
beam computed tomography in combination with a Hexa-
POD robot treatment table. Int J Radiat Oncol Biol Phys 2007,
67:1220-1228.
4. Oldham M, Letourneau D, Watt L, et al.: Cone-beam-CT guided
radiation therapy: A model for on-line application. Radiother
Oncol 2005, 75:271-278.
5. Paskalev K, Ma CM, Jacob R, et al.: Daily target localization for
prostate patients based on 3D image correlation. Phys Med
Biol 2004, 49:931-939.
6. Polat B, Wilbert J, Baier K, et al.: Nonrigid patient setup errors in
the head-and-neck region. Strahlenther Onkol 2007, 183:506-511.
7. Jensen HR, Hansen O, Hjelm-Hansen M, et al.: Inter- and intrafrac-
tional movement of the tumour in extracranial stereotactic
radiotherapy of NSCLC. Acta Oncol 2008, 47:1432-1437.
8. Verellen D, De Ridder M, Storme G: A (short) history of image-
guided radiotherapy. Radiother Oncol 2008, 86:4-13.
9. Verellen D, Ridder MD, Linthout N, et al.: Innovations in image-
guided radiotherapy. Nat Rev Cancer 2007, 7:949-960.
10. Guckenberger M, Meyer J, Wilbert J, et al.: Cone-beam CT based
image-guidance for extracranial stereotactic radiotherapy of
intrapulmonary tumors. Acta Oncol 2006, 45:897-906.
11. Morin O, Chen J, Aubin M, et al.: Dose calculation using mega-
voltage cone-beam CT. Int J Radiat Oncol Biol Phys 2007,
67:1201-1210.
12. Tanyi JA, Fuss MH: Volumetric image-guidance: Does routine
usage prompt adaptive re-planning? An institutional review.
Acta Oncol 2008, 47:1444-1453.
13. Letourneau D, Wong R, Moseley D, et al.: Online planning and
delivery technique for radiotherapy of spinal metastases
using cone-beam CT: image quality and system perform-
ance. Int J Radiat Oncol Biol Phys 2007, 67:1229-1237.
14. Chi Y, Wu Q, Yan D: Dose calculation on cone beam CT
(CBCT). Medical Physics 2007, 34:2438.
15. Depuydt T, Hrbacek J, Slagmolen P, et al.: Cone-beam CT Houns-
field unit correction method and application on images of
the pelvic region. Radiotherapy and oncology 2006, 81(Supple-
ment 1):29.
16. Houser C, Nawaz AO, Galvin J, et al.: Quantitive Evaluation of
Cone Beam CT Data Used for Treatment Planning. Medical
Physics 2006, 33:2285-2286.
17. Lee L, Le QT, Xing L: Retrospective IMRT Dose Reconstruction
Based on Cone-Beam CT and MLC Log-File. Int J Radiat Oncol
Biol Phys 2008, 70:634-644.
18. Marchant TE, Moore CJ, Rowbottom CG, et al.: Shading correc-
tion algorithm for improvement of cone-beam CT images in
radiotherapy. Phys Med Biol 2008, 53:5719-5733.
19. Paliwal B, Tewatia D, Orton N, et al.: Cone beam CT based treat-
ment planning. Medical Physics 2006, 33:
2029.
20. Tucking T, Nill S, Oelfke U: Dose calculation on linac integrated
KV-cone beam CT. Radiotherapy and oncology 2006, 81(Supple-
ment 1):26.
21. van Zijtveld M, Dirkx M, Heijmen B: Correction of conebeam CT
values using a planning CT for derivation of the "dose of the
day". Radiother Oncol 2007, 85:195-200.
22. Yang Y, Schreibmann E, Li T, et al.: Evaluation of on-board kV
cone beam CT (CBCT)-based dose calculation. Phys Med Biol
2007, 52:685-705.
23. Yoo S, Yin FF: Dosimetric feasibility of cone-beam CT-based
treatment planning compared to CT-based treatment plan-
ning. Int J Radiat Oncol Biol Phys 2006, 66:1553-1561.
24. Siewerdsen JH, Jaffray DA: Cone-beam computed tomography
with a flat-panel imager: magnitude and effects of x-ray scat-
ter. Med Phys 2001, 28:220-231.
25. Parker RP, Hobday PA, Cassell KJ: The direct use of CT numbers
in radiotherapy dosage calculations for inhomogeneous
media. Phys Med Biol 1979, 24:802-809.
26. Saw CB, Loper A, Komanduri K, et al.: Determination of CT-to-
density conversion relationship for image-based treatment
planning systems. Med Dosim 2005, 30:145-148.
27. Constantinou C, Harrington JC, DeWerd LA: An electron density
calibration phantom for CT-based treatment planning com-
puters. Med Phys 1992, 19:325-327.
28. Elekta: Clinical User Manual for XVI R3.5 General Release 2006.
29. Schneider U, Pedroni E, Lomax A: The calibration of CT Houns-
field units for radiotherapy treatment planning. Phys Med Biol
1996, 41:111-124.