Báo cáo khoa học: " A dosimetric comparison of four treatment planning methods for high grade glioma" pptx
Bạn đang xem bản rút gọn của tài liệu. Xem và tải ngay bản đầy đủ của tài liệu tại đây (680.37 KB, 7 trang )
BioMed Central
Open Access
Page 1 of 7
(page number not for citation purposes)
Radiation Oncology
Research
A dosimetric comparison of four treatment planning
methods for high grade glioma
Leor Zach, Bronwyn Stall, Holly Ning, John Ondos, Barbara Arora,
Shankavaram Uma, Robert W Miller, Deborah Citrin and
Kevin Camphausen*
Address: Radiation Oncology Branch, National Cancer Institute, 10 Center Drive Building 10, CRC, Bethesda, MD, 20892 USA
Email: Leor Zach - ; Bronwyn Stall - ; Holly Ning - ;
John Ondos - ; Barbara Arora - ; Shankavaram Uma - ;
Robert W Miller - ; Deborah Citrin - ; Kevin Camphausen* -
* Corresponding author
Abstract
Background: High grade gliomas (HGG) are typically treated with a combination of surgery,
radiotherapy and chemotherapy. Three dimensional (3D) conformal radiotherapy treatment
planning is still the main stay of treatment for these patients. New treatment planning methods
suggest better dose distributions and organ sparing but their clinical benefit is unclear. The purpose
of the current study was to compare normal tissue sparing and tumor coverage using four different
radiotherapy planning methods in patients with high grade glioma.
Methods: Three dimensional conformal (3D), sequential boost IMRT, integrated boost (IB) IMRT
and Tomotherapy (TOMO) treatment plans were generated for 20 high grade glioma patients. T1
and T2 MRI abnormalities were used to define GTV and CTV with 2 and 2.5 cm margins to define
PTV1 and PTV2 respectively.
Results: The mean dose to PTV2 but not to PTV1 was less then 95% of the prescribed dose with
IB and IMRT plans. The mean doses to the optic chiasm and the ipsilateral globe were highest with
3D plans and least with IB plans. The mean dose to the contralateral globe was highest with TOMO
plans. The mean of the integral dose (ID) to the brain was least with the IB plan and was lower with
IMRT compared to 3D plans. The TOMO plans had the least mean D10 to the normal brain but
higher mean D50 and D90 compared to IB and IMRT plans. The mean D10 and D50 but not D90
were significantly lower with the IMRT plans compared to the 3D plans.
Conclusion: No single treatment planning method was found to be superior to all others and a
personalized approach is advised for planning and treating high-grade glioma patients with
radiotherapy. Integral dose did not reflect accurately the dose volume histogram (DVH) of the
normal brain and may not be a good indicator of delayed radiation toxicity.
Published: 21 October 2009
Radiation Oncology 2009, 4:45 doi:10.1186/1748-717X-4-45
Received: 14 July 2009
Accepted: 21 October 2009
This article is available from: />© 2009 Zach et al; licensee BioMed Central Ltd.
This is an Open Access article distributed under the terms of the Creative Commons Attribution License ( />),
which permits unrestricted use, distribution, and reproduction in any medium, provided the original work is properly cited.
Radiation Oncology 2009, 4:45 />Page 2 of 7
(page number not for citation purposes)
Background
High grade gliomas (HGG) are the most prevalent pri-
mary malignant brain tumors in adults. These malignan-
cies are typically treated with a combination of surgery,
radiotherapy and chemotherapy. Three dimensional (3D)
conformal radiotherapy treatment planning is still the
main stay of treatment for these patients with treatment
volume delineation based on Magnetic Resonance Images
(MRI) fused to the patient's simulation computed tomog-
raphy. New technologies for radiotherapy planning and
treatment such as Intensity Modulated Radiotherapy
(IMRT) and new treatment instruments such as Tomo-
therapy are becoming widely used. These provide better
dose conformality, add certainty to dose delivery to the
target volumes, and allow sparing of sensitive organs adja-
cent to the treatment field and/or escalation of the dose to
the target volumes [1-7]. Although technically feasible,
the clinical benefit of the use of these technologies in the
treatment of HGG patients is unclear. Dose escalation in
patients with HGG has thus far yielded disappointing
results [1,2] and the use of advanced planning techniques
to spare a presumably healthy tissue surrounding the pri-
mary lesions to reduce toxicity is of uncertain benefit [8].
Furthermore, the problematic quality assurance and
reproducibility of some of these advanced treatment plan-
ning methods may compromise the ability to test them in
a controlled randomized trial [3]. In the current study, we
aimed to compare the dose distribution in target volumes
as well as normal tissues with four treatment planning
methods, done for the same patients with HGG. Our pur-
pose for conducting this dosimetric comparison was to
discover the benefits and drawbacks of each planning
method. We also aimed to evaluate the ability of the cal-
culated integral dose (ID) to reflect the actual dose distri-
bution in the normal brain. A conformal three
dimensional (3D) plan as well as a Linear Accelerator
(LINAC, Varian Clinac-21EX equipped with the
Millennium120 Multi Leaf Collimator) based sequential
boost IMRT plan were generated. We generated a third
LINAC based plan that was also an IMRT plan but was pre-
scribed as an Integrated Boost (IB) plan. Tomotherapy
(TOMO) plans were also generated for each patient using
IB dose prescription.
Methods
Twenty adult patients with high grade glioma, previously
treated with conventional 3D conformal radiotherapy at
the Radiation Oncology Branch of the National Cancer
Institute during the period 2004-2008, were included in
this study. Available treatment planning simulation CT
images and diagnostic contrast enhanced pre-operative T1
and T2 MR Images were mandatory for the patients to be
included.
The contrast enhanced MR images were fused to the sim-
ulation CT images using the Eclipse planning system (Var-
ian Medical Systems, Palo Alto, CA). For each patient, a
Gross Tumor Volume (GTV) and a Clinical Target Volume
(CTV) [9] were contoured using the contrast enhanced T1
and the T2 MRI abnormalities, respectively. A 2-cm mar-
gin to the CTV was used to define the Planning Target Vol-
ume 1 (PTV1 [9]), and a 2.5-cm margin to the GTV was
used to define PTV2. Areas of the PTV1 and PTV2 that
were outside the skull were trimmed with 0.5 cm inner
margin to the body contour. The globes and the optic chi-
asm were contoured and were designated as organs at risk
during the treatment planning. The brain stem, subven-
tricular zones (SVZ) and the normal brain (the volume of
brain that was left after excluding the PTV1 and PTV2 vol-
umes using the software Boolean operators) were also
contoured for toxicity evaluation, but were not taken into
consideration during treatment planning as organs at risk.
The SVZs, which are believed to harbor the brain progen-
itor cells [10], were contoured as previously described
[11]. Briefly, the lateral ventricles were contoured in both
sides of the brain. The lateral edges of the ventricles were
marked using a brush tool with the width of 0.5 cm. Treat-
ment volumes and normal structures were contoured by a
single physician and verified by a second physician.
For each patient, four treatment plans were generated.
Three LINAC based treatment plans included a 3D plan,
an IMRT plan and an IB IMRT plan. These were done for
Varian Clinac-21EX beams. This machine is equipped
with the Millennium120 multi leaf collimator (MLC). The
leaf width for the central 40 pairs is 5 mm and for the
outer 20 pairs is 1 cm. The simulation CT images and asso-
ciated contours were then transferred from the Eclipse
treatment planning software to the Tomotherapy treat-
ment planning software (TomoTherapy Inc., Madison,
WI) using the DICOM-RT protocol to generate the fourth
treatment plan with the Tomotherapy treatment planning
station. The optimal beam arrangement that delivered
optimal tumor coverage and normal tissue sparing was
selected after comparisons of various beam arrangements.
Dose constrains and priorities were modified as needed in
the IMRT, IB and Tomotherapy algorithms during the
optimization process. The 3D LINAC plans typically
included 3-5 treatment fields to conform the dose for each
target volume and the IMRT plans included typically 4-5
non co-planar treatment fields. If possible the dose to con-
tra-lateral brain was limited, when this did not compro-
mise the dose to critical structures. The beams were
chosen accordingly. The IMRT and IB plans were identical
in field arrangement and differed only by the dose pre-
scription parameters. The helical Tomotherapy parame-
ters definitions were 1 cm for the field size (slice
thickness) and 0.2-0.3 for pitch (the ratio of the distance
the couch travels to the field width per one full rotation of
the gantry). The Planning Modulation Factor (the ratio
between the longest time a leaf is opened to the mean leaf
opening time) was 2.00 and the mean actual modulation
Radiation Oncology 2009, 4:45 />Page 3 of 7
(page number not for citation purposes)
factor was 1.71 (range 1.22-1.96). The Plan Calculation
Grid (image resolution for dose calculations) was typi-
cally 0.274*0.274 cm (range 0.196*0.196 cm to
0.424*0.424 cm).
Dose calculations for all plans were based on photon
beams with maximal energy of 6-15 MV. The 3D and
IMRT plans included two sequential plans each, using the
PTV1 and PTV2 (boost) as the target volumes, with 46 Gy
in 23 fractions and 14 Gy in 7 fractions, respectively, as
the prescribed doses. Both the LINAC based IB plan and
the TOMO plan were prescribed as integrated boost plans
as previously described [4]. Briefly, the integrated boost
included 23 fractions in a single plan, with a differential
dose prescription to the target volumes. A total dose of 46
Gy in 2 Gy fractions was prescribed to PTV1 and a total
dose of 53.8 Gy in 2.34 Gy fractions was prescribed for
PTV2. The PTV2 total dose was calculated as the bioequiv-
alent dose of 30 fractions of 2 Gy given in 23 fractions
according to the linear quadratic model with a α/β ratio of
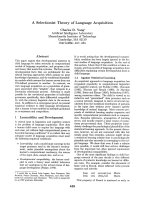
3. The integrated boost concept is illustrated in figure 1.
Acceptable inhomogeneity was defined as 5% above and
7% below the prescribed dose inside the target volumes.
An inhomogeneity coefficient (IC) of the dose in the tar-
get volumes was calculated using the formula (Dmax-
Dmin)/Dmean as previously described [12]. The closer
the IC to zero, the more homogenous the plan was con-
sidered.
The maximal dose allowed to the optic chiasm was 54 Gy,
in the 3D and IMRT plans and 51.5 Gy in the IB and
TOMO plans. An effort was made to keep the dose to the
globes below 5 Gy. Chiasm but not globes constrains had
higher priority than the target volume inhomogeneities in
the IMRT, IB and TOMO optimization algorithms when
there was an overlap of the structures. The brain stem, the
subventricular zones and the normal brain did not have
dose constrains during treatment planning. Bioequivalent
dose calculations were used to allow the comparison of
the IB and TOMO plans to the 3D and IMRT plans.
Two methods were used to compare the dose distribution
in the normal brain. First, the Integral Dose (ID) was cal-
culated as previously described. Briefly, the volume of the
normal brain was multiplied by the mean dose to the
brain [12,13]. Since different dose volume histogram
(DVH) curves can generate the same ID value (figure 2)
we decided to compare three points on the DVH of the
normal brain in each plan. D10, D50 and D90 represent
the dose received by 10%, 50% and 90% of the normal
brain volume, respectively
The mean percent volume coverage of the target volumes
as well as the mean of the maximal dose to normal organs
were calculated for each plan. The means of the IC, the
normal brain ID and D10, D50 and D90 to the brain were
also calculated. Since all these values relate to the same
volumes, there was no need to normalize them for the
purpose of this comparison.
An Excel based (Microsoft Office) two-tailed paired stu-
dent T test was used to determine if there was a statistically
Schematic illustration of the Integrated Boost target volumes and dose prescriptionFigure 1
Schematic illustration of the Integrated Boost target
volumes and dose prescription. Abbreviation: PTV1 -
Planning Treatment Volume 1 (corresponds with T2 MR
Image abnormality with 2 cm margins), PTV2 - Planning
Treatment Volume 2 (corresponds with T1+ contrast MR
Image abnormality with 2.5 cm margins).
PTV 2, 53.8 Gy
2.34Gy/fraction
PTV 1, 46Gy
2Gy/fraction
A sample Dose Volume Histograms (DVH) of normal brain dose with two different plansFigure 2
A sample Dose Volume Histograms (DVH) of normal
brain dose with two different plans. Although the Inte-
gral Dose to the brain according to these to DVH's is the
same (15.4 Gyxcm
3
× 1000), it is obvious that these histo-
grams are different in both high and low dose areas. The
dose received by 10% of the brain volume (D10) and 90% of
the brain volume (D90) can describe more accurately such a
difference. Abbreviation: NA-not applicable. SD-Standard
Deviation.
Radiation Oncology 2009, 4:45 />Page 4 of 7
(page number not for citation purposes)
significant difference between the means of the above val-
ues accomplished by each treatment planning method. A
statistically significant difference was defined when the T
test resulted in a p value of < 0.05.
Results
Patients' characteristics
A total of 20 patients were included in our study, 11 males
and 9 females with a mean age of 54 y (range 37-71).
Nineteen patients had a pathological diagnosis of Gliob-
lastoma Multiforme (GBM, World Health Organization
grade IV) and one had Anaplastic Astrocytoma (AA, World
Health Organization grade III).
Target volumes' coverage
The mean PTV1 and PTV2 volumes were 452 cm
3
(range
276-1074 cm
3
) and 300 cm
3
(range 137-567 cm
3
) respec-
tively. A mean of >98% (range 92-100%) of the PTV1
received 100% of the prescribed dose in all planning
methods. A mean of 95.5% and 95.7% of the PTV2
received 100% of the prescribed dose with TOMO and
IMRT plans respectively. A mean of 94% and 92% of the
PTV2 received 100% of the prescribed dose with IB and
3D treatment plans, respectively. The mean IB and 3D
plans PTV2 coverage was significantly inferior then the
IMRT and TOMO plans (p < 0.02, for all comparisons).
The mean Inhomogeneity Coefficient (IC) was signifi-
cantly lower (better) with the TOMO plans, compared to
all other plans for both PTV1 and PTV2 (p < 0.0003 for all
comparisons) (figure 3). The mean IC of the IMRT plans
was significantly higher (worse) than the mean IC of the
3D plans regarding PTV 1 (p < 0.02) and higher (worse)
then the mean IC of the IB plans regarding PTV2 (p <
0.03) (figure 3). No significant difference was found
between the means of the IC of the 3D and IB plans.
Normal tissue sparing
The mean of the maximal dose to the normal structures
with the various treatment plans was used as a surrogate
to normal tissue sparing [14] (figure 4). The optic chiasm,
which was designated as organ at risk during treatment
planning, was better spared with all other planning meth-
ods compared to the 3D plan (p < 0.05 for all compari-
sons). The IB plan (p < 0.00002) but not the TOMO plan
(p > 0.5) spared the optic chiasm significantly better then
the IMRT plan. All plans met the pre defined dose con-
strains for the optic chiasm.
The TOMO and IB plans spared the ipsilateral globe sig-
nificantly better then the 3D plans (p < 0.002, p < 0.0008
respectively) but only the IB plan spared that globe signif-
icantly better then the IMRT plan (p < 0.005). No signifi-
cant difference was found between the IB and the TOMO
sparing of these organs (p > 0.3).
The contralateral globe in contrast, was not spared with
the TOMO plan which had the highest mean maximal
dose compared to all other plans (p value < 0.0001 com-
pared to the IMRT and IB plans and p > 0.05 compared to
the 3D plan). No other significant difference was found
between the plans in respect to the ability to spare the con-
The mean Inhomogeneity Coefficient (IC) achieved by the different planning methodsFigure 3
The mean Inhomogeneity Coefficient (IC) achieved
by the different planning methods. The mean of the
Inhomogeneity Coefficient is a measure of dose inhomogene-
ity in the target volumes. The closer the IC to zero, the
more homogenous the dose is.
3D
IMRT
IB
TOMO
PTV 2
PTV 1
0.35
0.41
0.38
0.23
0.26 0.28
0.25
0.12
0.00
0.10
0.20
0.30
0.40
0.50
Inhomogeneity
Coefficient (IC)
The mean maximal dose (cGy) in normal tissues found with each treatment planning methodFigure 4
The mean maximal dose (cGy) in normal tissues
found with each treatment planning method. Abbrevi-
ations: SVZ- sub ventricular zone, 3D- conformal three
dimensional, IMRT-Intensity Modulated Radio Therapy, IB-
Integrated Boost, TOMO - Tomo Therapy.
0
1000
2000
3000
4000
5000
6000
7000
Dose (cGy)
3D
6176 5733 5319 3737 2758 756
IMRT
6380 5675 4999 3383 2024 480
IB
6593 5887 5269 3036 1706 443
TOMO
6425 5842 4750 3117 1837 796
Ipsi
lateral
SVZ
Brain
Stem
Contra
lateral
Optic
Chiasm
Ipsi
lateral
globe
Contra
lateral
Radiation Oncology 2009, 4:45 />Page 5 of 7
(page number not for citation purposes)
tralateral globe. Although the mean dose of the IMRT and
IB plans to the contralateral globe was lower then the 3D
plan, a careful evaluation of the dose to that globe in some
individual cases was lowest with the 3D plan compared to
all others (data not shown).
The mean maximal dose to the ipsilateral subventricular
zone (SVZ) was the highest with the IB treatment plan-
ning followed by TOMO, IMRT and 3D (p < 0.05 for all
comparisons except IMRT vs. TOMO plans). The contral-
ateral SVZ was best spared using the IMRT (p < 0.05 com-
pared to every other planning method). No significant
difference was found between the IB, 3D and TOMO
plans in this respect.
The mean maximal dose to the brain stem with IMRT plan
was significantly lower than with IB and TOMO (p <
0.008 for both comparisons) but not the 3D plan (p >
0.6).
The mean of the integral dose (ID) to the brain was signif-
icantly lower (range 10-17.5%) with the IB plan com-
pared to all other plans (p < 0.006) (table 1). No
significant difference in the ID to the brain was found
among the other plans. A different pattern was noted
when the D10, 50 and 90 were extracted out of the DVHs
of the various plans and compared. The mean dose to 10
percent of the normal brain was consistently lowest with
the TOMO plans followed by the IB, IMRT and 3D plans.
Conversely, the D50 and D90 values were significantly
higher with the TOMO plans compared to both IB and
IMRT plans and the D50 but not the D90 was significantly
lower in the IB plan compared to the IMRT and 3D plans.
Interestingly, IMRT D10 and D50 were significantly lower
than the 3D doses, but no significant difference was found
between these plans regarding D90 (figure 5).
Discussion
In this study, we compared the delivery of radiation dose
to the target volumes and the adjacent normal structures
in high-grade glioma patients by using four treatment
planning methods. This kind of comparison harbors
numerous biases due to the use of different planning soft-
ware, different optimization algorithms and different
dose prescriptions. The use of mean values to compare
these plans harbors another potential bias since it fails to
reflect a better dose profile offered for individual patients
by a specific planning method (e.g. target volume dose
goals). Furthermore, a lower dose to a normal tissue is an
important goal in treatment planning (e.g. SVZ or normal
brain), but does not necessarily give an advantage if the
tolerance of that tissue is not met (e.g. the optic chiasm).
A qualitative comparison of the various plans is summa-
rized in table 2. According to our results, there is no single
treatment planning method that is superior to all others in
all aspects compared.
Target volumes' coverage
Sequential boost plans assume 100% dose coverage to the
boost volume by the initial part of the treatment. In gli-
oma patients, were this is not always the case (PTV2 is not
a geometrical cone down of PTV1); cold spots might be
noticed within the boost volume. Non standard target vol-
umes [4,5] can overcome this problem but these were not
tested prospectively [15].
More treatment fields may suggest some advantage in the
PTV2 dose coverage (IMRT plan was better then the 3D
plan).
Surprisingly, the PTV2 dose coverage with the IB plan was
worse then the IMRT plan despite the use of the same
beam arrangement and dose constrains. As previously
reported [4], there is a trade off between the target volume
coverage and the homogeneity of the dose (which is sup-
ported by our IC results). Prescribing the IB plans to a
lower isodose line improved the coverage but compro-
mised the homogeneity of the dose in the target volume
(data not shown). The beam weighing algorithm used to
produce a plan sum in a sequential boost (IMRT) com-
pared to an integrated boost (IB) gives another explana-
tion to the different PTV2 coverage [4].
The TOMO plan did not result in an inferior PTV2 cover-
age and achieved the best IC as well since it uses infinite
number of fields by definition.
The mean D10, D50, and D90 found with each treatment planning methodFigure 5
The mean D10, D50, and D90 found with each treat-
ment planning method. The mean dose to 10% (D10),
50% (D50) and 90% (D90) of the normal brain volume (after
the PTV1 and PTV2 volumes were excluded using the soft-
ware Boolean Operators) with each treatment planning
method.
D
1
0
D
5
0
D
9
0
0
1000
2000
3000
4000
5000
6000
Dose (cGy)
IB
4167 1676 375
TOMO
3931 2152 583
IMRT
4762 1791 435
3D
5467 2008 425
D10 D50 D90
Radiation Oncology 2009, 4:45 />Page 6 of 7
(page number not for citation purposes)
Normal tissue sparing
The TOMO plans were able to spare best small organs
which usually lie close to the target volumes and were
highly prioritized (e.g. the chiasm and ipsilateral globe)
but the advantage was relatively small compared to the
IMRT and IB plans. The ability of the TOMO to spare these
organs in patients with tumors located distant from them
is questionable since blocking both the entering and exit
doses to a distant volume without compromising the tar-
get volume coverage, is unlikely with the helical beam
arrangement.
No benefit and even a potential disadvantage was found
with the IB and TOMO plans for structures with larger vol-
umes that often overlap with the target volumes, such as
the SVZ and the brain stem (due to a higher dose per frac-
tion translated into higher total BED in these areas). We
chose not to give dose constrains to these structures and
compared their dose distribution after the plans were gen-
erated. The SVZs (believed to harbor the normal brain
progenitor cells [10]) viability is correlated with late radi-
ation toxicity [11,16,17] on one hand justifying an
attempt to lower their dose [11,18] but are also suspected
as the source of cancerous stem cells in primary brain
tumors, associated with the tumor ability to resist radia-
tion treatment and recur[19-21]. Higher radiosensitivity
of the brain stem compared to other parts of the brain is
not reported and its tolerance to fractionated radiotherapy
appears to be a function of the volume receiving high dose
rather than the maximum point dose [22].
Integral Dose (ID) is the value usually used to compare
the dose received by healthy tissues outside the target vol-
umes [12-14]. We added an analysis of three points in the
DVH curve (D10, D50 and D90) of the normal brain to
evaluate the validity of the ID as a tool for this kind of
comparisons since different DVH curves may result in the
same ID. The TOMO plans, with the high conformality
and a rapid fall off of the dose around the target volumes
had the lowest D10 to the normal brain (only a small vol-
ume around the target volume received a high dose). At
the same time, larger volumes of normal brain received
irradiation at all (high D50 and D90). This significant
dose of irradiation received by the normal brain was not
demonstrated when the ID values were compared. Along
with the expected longer survival of HGG patients in the
future these differences may translate to toxicity. Lower ID
values with IMRT compared to 3D plans were used to jus-
tify its use for HGG patients [14]. Our mean ID failed to
indicate such a difference but it is in line with the lower
D10 and D50 for the IMRT plans we found. We suggest
caution in the use and interpretation of ID for treatment
plans comparisons due to its failure to predict differences
in DVH curves which might have significant implications
in the future.
Conclusion
Our data suggest a distinctive approach in the use of new
treatment planning tools. Further investigation is indi-
cated to better choose the correct tool for each patient.
Larger series might suggest a decision algorithm according
to the patient's tumor size, location and prognosis. Long
follow up periods with HGG patients are becoming a
widespread phenomenon, and may allow better under-
standing of the effect of the different DVH curves of the
normal brain and the SVZ. A close follow up on patient's
toxicity profiles and correlations with a specific treatment
planning method are indicated. The use of imprecise and
Table 1: The mean Integral Dose (ID) to the brain with each treatment planning method.
% Difference (p value)
Integral Dose ± SD (Gy × cm
3
× 1000) Plan 3D IMRT IB
22.8 ± 7.2 3D NA
21.1 ± 3.7 IMRT 7.5 (0.2) NA
18.8 ± 3.1 IB 17.5 (0.006)* 10.9 (8.7E-09)* NA
21 ± 2.3 TOMO 7.8 (0.3) 0.3 (0.6) 10.6 (0.003)*
* Statistically significant
Table 2: A qualitative comparison of the four treatment planning
methods.
3D IMRT IB TOMO
Target Volumes
PTV1 coverage +++ +
PTV2 coverage -+- +
Inhomogeneity Coefficient -+
Normal Tissues Sparing
Optic Chiasm -+
Ipsilateral Globe -++
Contralateral Globe +-
Ipsilateral SVZ +-
Contralateral SVZ +
Brainstem +- -
Normal Brain ID +
Normal Brain D10 -+
Normal Brain D50 -+-
Normal Brain D90 -
+ Significant advantage - Significant disadvantage
Publish with BioMed Central and every
scientist can read your work free of charge
"BioMed Central will be the most significant development for
disseminating the results of biomedical research in our lifetime."
Sir Paul Nurse, Cancer Research UK
Your research papers will be:
available free of charge to the entire biomedical community
peer reviewed and published immediately upon acceptance
cited in PubMed and archived on PubMed Central
yours — you keep the copyright
Submit your manuscript here:
/>BioMedcentral
Radiation Oncology 2009, 4:45 />Page 7 of 7
(page number not for citation purposes)
insensitive tools like ID to compare potential toxicity due
to large irradiated volumes should be discouraged and
better tools should be developed.
Competing interests
The authors declare that they have no competing interests.
Authors' contributions
LZ carried out the contouring, and participated in the
study design, coordination, treatment planning and writ-
ing of the manuscript. BS participated in contouring and
helped revising the draft manuscript. HN carried out the
treatment planning. JO carried out MRI fusions and par-
ticipated in treatment planning. BA participated in treat-
ment planning. US participated in the statistical analysis
of the results and helped revising the draft manuscript.
RWM participated in treatment planning. DC participated
in the data analysis and helped revising the draft manu-
script. KC conceived of the study, and participated in its
design and coordination and helped to draft the manu-
script. All authors read and approved the final manu-
script.
References
1. Souhami L, Seiferheld W, Brachman D, Podgorsak P, Werner-Wasik
M, Lustig R, Schultz C, Sause W, Okunieff P, Buckner J: Randomized
comparison of stereotactic radiosurgery followed by conven-
tional radiotherapy with carmustine to conventional radio-
therapy with carmustine for patients with glioblastoma
multiforme: Report of radiation therapy oncology group 93-
05 protocol. IJROBP 2004, 60(3):853-60.
2. Cardinale R, Won M, Choucair A, Gillin M, Chakravarti A, Schultz C,
Souhami L, Chen A, Pham H, Mehta M: A phase II trial of acceler-
ated radiotherapy using weekly stereotactic conformal
boost for supratentorial glioblastoma multiforme: RTOG
0023. IJROBP 2006, 65(5):1422-8.
3. Hartford AC, Palisca MG, Eichler TJ, Beyer D, Devineni V, Ibbott G,
Kavanagh B, Kent J, Rosenthal S, Schultz C, Tripuraneni P, Gaspar L:
American society for therapeutic radiology and oncology
(ASTRO) and american college of radiology (ACR) practice
guidelines for intensity-modulated radiation therapy
(IMRT). IJROBP 2009, 73(1):9-14.
4. Thilmann C, Zabel A, Grosser KH, Hoess A, Wannenmacher M,
Debus J: Intensity-modulated radiotherapy with an integrated
boost to the macroscopic tumor volume in the treatment of
high-grade gliomas. Int J Cancer 2001, 96(6):341-9.
5. Suzuki M, Nakamatsu K, Kanamori S, Okumra M, Uchiyama T, Akai F,
Nishimura Y: Feasibility study of the simultaneous integrated
boost (SIB) method for malignant gliomas using intensity-
modulated radiotherapy (IMRT). Jpn J Clin Oncol 2003,
33(6):271-7.
6. Suzuki M, Nakamatsu K, Kanamori S, Okajima K, Okumura M,
Nishimura Y: Comparison of outcomes between overlapping
structure-based and non-overlapping structure-based opti-
mization for simultaneous integrated boost IMRT for malig-
nant gliomas. Int J Clin Oncol 2004, 9(6):491-7.
7. Iuchi T, Hatano K, Narita Y, Kodama T, Yamaki T, Osato K: Hypof-
ractionated high-dose irradiation for the treatment of malig-
nant astrocytomas using simultaneous integrated boost
technique by IMRT. IJROBP 2006, 64(5):1317-24.
8. Chan JL, Lee SW, Fraass BA, Normolle DP, Greenberg HS, Junck LR,
Gebarski SS, Sandler HM: Survival and failure patterns of high-
grade gliomas after three-dimensional conformal radiother-
apy. JCO
2002, 20(6):1635-42.
9. ICRU report 50, prescribing, recording, and reporting pho-
ton beam therapy. International commission on Radiatrion
units and Measurments. Bethesda, MD 1993.
10. Doetsch F, Caille I, Lim DA, Garcia-Verdugo JM, Alvarez-Buylla A:
Subventricular zone astrocytes are neural stem cells in the
adult mammalian brain. Cell 1999, 97(6):703-16.
11. Barani IJ, Cuttino LW, Benedict SH, Todor D, Bump E, Wu Y, Chung
T, Broaddus W, Lin P: Neural stem cell-preserving external-
beam radiotherapy of central nervous system malignancies.
IJROBP 2007, 68(4):978-85.
12. Shi C, Peñagarìcano J, Papanikolaou N: Comparison of IMRT
treatment plans between linac and helical tomotherapy
based on integral dose and inhomogeneity index. Med Dosim
2008, 33(3):215-21.
13. Aoyama H, Westerly DC, MacKie TR, Olivera G, Bentzen S, Patel R,
Jaradat H, Tome W, Ritter M, Mehta M: Integral radiation dose to
normal structures with conformal external beam radiation.
IJROBP 2006, 64(3):962-7.
14. Hermanto U, Frija EK, Lii MJ, Chang E, Mhajan A, Woo S: Intensity-
modulated radiotherapy (IMRT) and conventional three-
dimensional conformal radiotherapy for high-grade gliomas:
Does IMRT increase the integral dose to normal brain?
IJROBP 2007, 67(4):1135-44.
15. Fiveash JB, Nordal JM, Markert RS, Ahmed RS, Nabors LB: High
Grade Gliomas. In Clinical Radiation Oncology 2nd edition. Edited by:
Gunderson L, Tepper J. Churchill Livingstone, Philadelphia, (PA);
2006:515-537.
16. Barani IJ, Benedict SH, Lin P: Neural stem cells: Implications for
the conventional radiotherapy of central nervous system
malignancies. IJROBP 2007, 68(2):324-33.
17. Mizumatsu S, Monje ML, Morhardt DR, Rola R, Palmer T, Fike J:
Extreme sensitivity of adult neurogenesis to low doses of X-
irradiation. Cancer Res 2003, 63(14):4021-7.
18. Gutieìrrez AN, Westerly DC, Tomeì WA, Jaradat H, Mackie T,
Bentzen S, Khuntia D, Mehta M: Whole brain radiotherapy with
hippocampal avoidance and simultaneously integrated brain
metastases boost: A planning study. IJROBP 2007, 69(2):
589-97.
19. Quiñones-Hinojosa A, Chaichana K: The human subventricular
zone: A source of new cells and a potential source of brain
tumors. Exp Neurol 2007, 205(2):313-24.
20. Lim DA, Cha S, Mayo MC, Chen MH, Keles E, VandenBerg S, Berger
M: Relationship of glioblastoma multiforme to neural stem
cell regions predicts invasive and multifocal tumor pheno-
type. Neuro Oncol 2007, 9(4):424-9.
21. Sanai N, Alvarez-Buylla A, Berger MS: Mechanisms of disease:
Neural stem cells and the origin of gliomas. N Engl J Med 2005,
353(8):811-22.
22. Debus J, Hug EB, Liebsch NJ, O'farrel D, Finkelstein D, Efird J,
Munzenrider J: Brainstem tolerance to conformal radiother-
apy of skull base tumors. IJROBP 1997, 39(5):967-75.