Báo cáo y học: "Molecular discrimination of responders and nonresponders to anti-TNFalpha therapy in rheumatoid arthritis by etanercept" docx
Bạn đang xem bản rút gọn của tài liệu. Xem và tải ngay bản đầy đủ của tài liệu tại đây (564.1 KB, 10 trang )
Open Access
Available online />Page 1 of 10
(page number not for citation purposes)
Vol 10 No 3
Research article
Molecular discrimination of responders and nonresponders to
anti-TNFalpha therapy in rheumatoid arthritis by etanercept
Dirk Koczan
1
, Susanne Drynda
2
, Michael Hecker
3
, Andreas Drynda
2
, Reinhard Guthke
3
,
Joern Kekow
2
and Hans-Juergen Thiesen
1
1
Department of Immunology, University of Rostock, Schillingallee 70, 18055 Rostock, Germany
2
Clinic of Rheumatology, University of Magdeburg, Sophie-von-Boetticher-Straße 1, 39245 Vogelsang, Germany
3
Leibnitz Institute for Natural Product Research and Infection Biology – Hans-Knoell-Institute e.V., Beutenbergstraße 11a, 07745 Jena, Germany
Corresponding author: Hans-Juergen Thiesen,
Received: 26 Oct 2007 Revisions requested: 14 Dec 2007 Revisions received: 18 Apr 2008 Accepted: 2 May 2008 Published: 2 May 2008
Arthritis Research & Therapy 2008, 10:R50 (doi:10.1186/ar2419)
This article is online at: />© 2008 Koczan et al.; licensee BioMed Central Ltd.
This is an open access article distributed under the terms of the Creative Commons Attribution License ( />),
which permits unrestricted use, distribution, and reproduction in any medium, provided the original work is properly cited.
Abstract
Introduction About 30% of rheumatoid arthritis patients fail to
respond adequately to TNFα-blocking therapy. There is a
medical and socioeconomic need to identify molecular markers
for an early prediction of responders and nonresponders.
Methods RNA was extracted from peripheral blood
mononuclear cells of 19 rheumatoid arthritis patients before the
first application of the TNFα blocker etanercept as well as after
72 hours. Clinical response was assessed over 3 months using
the 28-joint-count Disease Activity Score and X-ray scans.
Supervised learning methods were applied to Affymetrix Human
Genome U133 microarray data analysis to determine highly
selective discriminatory gene pairs or triplets with prognostic
relevance for the clinical outcome evinced by a decline of the
28-joint-count Disease Activity Score by 1.2.
Results Early downregulation of expression levels secondary to
TNFα neutralization was associated with good clinical
responses, as shown by a decline in overall disease activity 3
months after the start of treatment. Informative gene sets include
genes (for example, NFKBIA, CCL4, IL8, IL1B, TNFAIP3,
PDE4B, PPP1R15A and ADM) involved in different pathways
and cellular processes such as TNFα signalling via NFκB,
NFκB-independent signalling via cAMP, and the regulation of
cellular and oxidative stress response. Pairs and triplets within
these genes were found to have a high prognostic value,
reflected by prediction accuracies of over 89% for seven
selected gene pairs and of 95% for 10 specific gene triplets.
Conclusion Our data underline that early gene expression
profiling is instrumental in identifying candidate biomarkers to
predict therapeutic outcomes of anti-TNFα treatment regimes.
Introduction
Rheumatoid arthritis (RA) is an autoimmune disease of
unknown aetiology that is characterized by recruitment and
activation of inflammatory cells, synovial hyperplasia, and
destruction of cartilage and bone. The proinflammatory
cytokine TNFα is a key mediator in the pathogenesis of RA [1].
Etanercept (Enbrel
®
; Wyeth, Cambridge, MA, USA), a soluble
TNFα receptor immunoglobulin fusion protein, has been rec-
ognized as a potent biological that neutralizes TNFα [2-4].
Clinical studies on the efficacy of TNFα-blocking agents
clearly show that about 30% of patients receiving this expen-
sive therapy are nonresponders [3,5]. Although many efforts
have been made to identify biomarkers for therapy response
[6], no clinical or single laboratory marker exists today that
allows a prediction of TNFα therapy efficacy in the individual
patient. This lack of biomarker includes the newly identified
specific serological marker for RA – antibodies to cyclic citrull-
inated peptides [7,8] – as well as genetic markers [9-12].
A number of studies have shown that the expression of individ-
ual proteins – particularly cytokines such as TNFα, IL-1β, IL-6
and IFNγ [13,14], chemokines like IL-8 and MCP1, as well as
matrix metalloproteinases such as MMP1 and MMP3 [15,16]
– changes during etanercept therapy. These studies were lim-
ited to a small number of genes and their corresponding pro-
teins, and were not able to identify new markers for
characterizing disease activity or to determine discriminatory
markers for the prediction of therapy outcome. Van der Pouw
C
T
= treshold cycle; DAS = 28-joint-count Disease Activity Score; IFN = interferon; IL = interleukin; NF = nuclear factor; PCR = polymerase chain
reaction; Q = prediction accuracy; RA = rheumatoid arthritis; RT = reverse transcription; TNF = tumour necrosis factor.
Arthritis Research & Therapy Vol 10 No 3 Koczan et al.
Page 2 of 10
(page number not for citation purposes)
and coworkers [17] used gene expression profiling of synovial
tissue to identify subsets of RA based on molecular criteria;
see also Glocker and colleagues [18].
Lequerre and colleagues described changes in gene expres-
sion signatures of mononuclear cells in RA patients 3 months
after the start of treatment that were correlated with the treat-
ment response to another TNFα inhibitor, infliximab, in combi-
nation with methotrexate [19]. They reported a significant
decrease of transcript levels of eight genes regulated by
TNFα-dependent pathways in nonresponders, whereas tran-
script levels in responders did not change significantly but
were slightly increased. The effects of infliximab treatment on
the long-term changes of gene expression pattern of synovial
tissue and their potential to predict the outcome of infliximab-
treated RA patients was investigated by Lindberg and cowork-
ers [20]. Differentially expressed genes were involved in proc-
esses such as chemotaxis, immune function, signal
transduction and inflammatory responses. The value of tissue
biopsies is still under debate, and biopsies repeated in quick
succession are not feasible.
The present study uses global transcriptome analysis to deter-
mine RNA expression signatures in peripheral blood cells that
specify the response to anti-TNFα therapy within the first days
of treatment. The objective of our approach is to discover pre-
dictive markers by analysing gene sets that are distinctly regu-
lated in the first 3 days after anti-TNF (etanercept)
administration. This short time interval was chosen to identify
initially perturbed gene expression not influenced by possible
changes in comedication and environmental factors occurring
during longer follow-up.
We report the application of established DNA array technol-
ogy (Affymetrix
®
; St. Clara, CA, USA) to monitor changes in
the expression levels of mononuclear cells from peripheral
blood during etanercept treatment. Among about 14,500
genes, 42 candidate genes were found suitable for use as
prognostic markers for the therapeutic outcome. Using super-
vised learning methods, pairs and triplets derived from these
genes were found to have a high prognostic value – reflected
by prediction accuracies of over 89% for seven gene pairs and
of 95% for 10 specific gene triplets.
Patients and methods
Patients
Nineteen patients (15 females, four males; mean age, 50.8 ±
11.0 years; mean duration of disease, 15.8 ± 9.4 years; all
Caucasian) who met the American College of Rheumatology
criteria for RA [21] were studied; for details, refer to Table 1.
More than three different disease-modifying antirheumatic
drugs had failed to control disease activity before etanercept
was administered. The study was approved by the ethics com-
mittee of the University of Magdeburg (71/99) and all patients
were asked for written consent.
Each patient was given a standard dose of 2 × 25 mg etaner-
cept per week subcutaneously. Disease-modifying antirheu-
matic drugs and steroids remained unchanged in all patients
for the first week of TNF-blocking therapy. Blood samples
were taken at 7:00 a.m. before treatment (time t
0
; baseline),
and at 72 hours after the first application of etanercept (time
t
1
). Comedication was given after blood was taken.
Patients were assessed for overall disease activity using the
28-joint-count Disease Activity Score (DAS28) as described
elsewhere [22]. Patients were categorized according to the
European Leage against Rheumatism (EULAR) recommenda-
tions 3 months after the start of treatment, considering an
improvement of the DAS28 >1.2 a good response. X-ray
scans were read by two independent experienced physicians,
but the sequence of the X-ray scans was not blinded. After
reviewing X-ray scans of hands and feet, the responder group
was further characterized by the absence of new bone ero-
sions after a time interval of at least 9 to 12 months of follow
up.
Sample preparation
Peripheral blood mononuclear cells from 25 ml blood were
separated on a Ficoll density gradient [23]. Using a FACSCal-
ibur Flow Cytometer (Becton Dickinson, San Diego, CA, USA)
the populations of CD3
+
, CD14
+
, CD19
+
and CD56
+
cells
were determined to ensure comparability of peripheral blood
mononuclear cell fractions of individual patients in the course
of the study. Extraction of total RNA was performed using the
Qiagen RNeasy kit (Qiagen, Hilden, Germany) including a
DNA digest on-column according to the manufacturer's
instructions.
Microarray analysis
Affymetrix
®
microarray technology (Human Genome U133A
gene chip) was used to analyse the expression levels of about
18,400 transcripts interrogated by more than 22,000 probe
sets. The Human Genome U95A gene chip was applied to
verify array data with selected patients. Labelling and microar-
ray processing was performed according to the manufac-
turer's protocol. The scanning was carried out with 3 μm
resolution, 488 nm excitation and 570 nm emission wave-
lengths employing the GeneArray Scanner (Affymetrix, St.
Clara, CA, USA). The microarray data were stored according
to the MIAME standard and are available from ArrayExpress
[24] (accession number E-MTAB-11).
Quantitative real-time RT-PCR
Expression levels of a subset of genes were measured by
quantitative real-time RT-PCR performed with TaqMan assay
reagents according to the manufacturer's instructions on a
7900 High Throughput Sequence Detection System (Applied
Biosystems, Foster City, CA, USA) using predesigned primers
and probes (GAPDH Hs99999905_m1, ICAM1
Hs00164932_m1, TNFAIP3 Hs00234713_m1, IL1β
Available online />Page 3 of 10
(page number not for citation purposes)
Hs00174097_m1, PDE4B Hs00277080_m1, PPP1R15A
Hs00169585_m1, NFKBIA Hs00153283_m1, CCL4
Hs00237011_m1, IL-8 Hs00174103_m1, ADM
Hs00181605_m1).
To calculate the gene expression change of selected genes,
the ΔΔC
T
method was used. According to this method, the
threshold cycle values (C
T
) for specific mRNA expression in
each sample were normalized to the C
T
values of GAPDH
mRNA in the same sample. This provides ΔC
T
values that were
used to calculate the changes of gene expression levels.
Thereby, for each gene, the gene expression change in the first
3 days (ΔΔC
T
) is defined by the difference of the ΔC
T
value at
day 3 (t
1
) and the ΔC
T
value before treatment (t
0
).
Data processing and analysis
The microarray data were preprocessed using the Microarray
Suite, version 5.0 (MAS5.0; Affymetrix, Santa Clara, CA, USA)
in the default configuration, and were analysed by a set of
algorithms.
First, an algorithm for calculation of a score J to rank differen-
tially regulated genes. Basically, the J score introduced here is
a t statistic, which compares the logarithm of the expression
ratios t
1
/t
0
(signal log ratios) between responders and nonre-
sponders. Thereby, the confidence intervals of the signal log
ratios provided by MAS5.0 are used. In this way, the J score
considers interindividual differences as well as measurement
errors. A higher J score represents a more significant differen-
tial regulation. J > 0 was used as the cutoff point to define
genes as differentially regulated.
Second, an algorithm for learning of classifiers used for predic-
tion of the therapy outcome on evaluation of the fold change
of pairs and triplets of genes (Support-Vector Machine algo-
rithm together with cross-validation by the leave-one-out
method).
Finally, an algorithm for inference of hypothetic gene regula-
tory networks (modified LASSO algorithm).
Table 1
Patient characteristics
Patient
number
Age (years) Gender RA duration
(years)
Disease-modifying
antirheumatic drugs
Steroids
(mg/day)
CCP-Ab
(U/ml) (t
0
)
DAS28 X-ray
progression
Response after
3 months
Baseline 3 months
1 77 Male 21 None 5.0 644 5.45 4.69 No Nonresponder
2 64 Male 27 Leflunomide 10.0 610 5.18 4.61 No Nonresponder
3 43 Female 33 Methotrexate 7.5 81 4.82 0.69 No Responder
4 65 Female 45 None 15.0 187 6.00 6.44 Yes Nonresponder
5 63 Female 8 None 15.0 >1,600 5.83 8.37 Yes Nonresponder
6 51 Female 17 Methotrexate 20.0 Negative 6.16 4.40 Yes Nonresponder
7 34 Female 9 None 0.0 806 5.37 5.47 Yes Nonresponder
8 44 Male 9 None 15.0 Negative 5.51 2.55 No Responder
9 39 Male 1 Methotrexate 5.0 Negative 5.12 2.09 No Responder
10 42 Female 29 Methotrexate 7.5 Negative 6.52 1.79 No Responder
11 26 Female 2 None 0.0 Negative 4.47 1.50 No Responder
12 48 Female 24 Leflunomide 8.0 429 5.57 2.73 No Responder
13 47 Female 13 Cyclosporin A 10.0 96 7.11 5.29 No Responder
14 53 Female 5 Leflunomide 8.0 1064 3.29 2.42 No Nonresponder
15 62 Female 13 Methotrexate 0.0 Neg. 5.88 4.40 No Responder
16 65 Female 2 Sulfasalazine/
hydroxychloroquin
15.0 >1,600 7.68 5.90 No Responder
17 42 Female 14 None 5.0 61 5.6 3.36 No Responder
18 52 Female 8 Methotrexate 0.0 436 5.59 2.38 No Responder
19 70 Female 14 Leflunomide 7.5 855 5.08 2.55 No Responder
Therapeutic response was defined clinically by changes of 28-joint-count Disease Activity Score (DAS28) determined at the beginning of the study (baseline) and 3
months after the start of etanercept treatment and additionally by X-ray analysis of hands and feet after 9 to 12 months. An improvement of the DAS28 by >1.2 was
considered a good response (if no progression of joint destruction were observed by X-ray analysis), a DAS28 reduction by ≤ 1.2 was considered a nonresponse.
Serum antibodies to cyclic citrullinated peptide (CCP-Ab) were analysed using the Immunoscan RA ELISA CCP2 test (Euro-Diagnostica, Malmö, Sweden) according
to the manufacturer's instructions (cutoff point = 25 U/ml). RA, rheumatoid arthritis.
Arthritis Research & Therapy Vol 10 No 3 Koczan et al.
Page 4 of 10
(page number not for citation purposes)
These three algorithms are described in detail in Additional file
1.
Methods of multiple testing to control the type I error rates tak-
ing into account the large multiplicity (more than 22,000 probe
sets) were not applied. This feature was circumvented by vali-
dating expression patterns of a selected set of genes (ICAM1,
TNFAIP3, IL1B, PDE4B, PPP1R15A, NFKBIA, CCL4, IL8,
ADM).
Results
Clinical evaluation
Before the start of treatment, all RA patients presented with a
high disease activity reflected by a DAS28 (mean ± standard
deviation) of 5.7 ± 0.7. Within 3 months of TNFα-blocking
therapy, the disease activity decreased significantly looking at
all patients as a group (DAS28 = 3.8 ± 2.1) (Table 1).
Twelve patients (patients 3, 8 to 13, and 15 to 19) were char-
acterized by a good therapy response, as indicated by a signif-
icant reduction of the DAS28 >1.2 without progression of
bone erosions as shown by X-ray scans of hands and feet.
Three out of seven nonresponders (patients 4, 5 and 7)
showed mild progression of bone erosion by X-ray reviewing.
One patient (patient 6) was considered a nonresponder
despite a good DAS28 response due to a progressive joint
destruction as demonstrated by the X-ray scan. None of the
clinical characteristics at baseline was significantly associated
with the clinical outcome (Table 2)
Gene expression profiling using the U133A array
Application of Affymetrix DNA-chip technology to monitor
changes in the expression profile of about 14,500 known
genes in peripheral blood mononuclear cells during anti-TNFα
therapy reflected a differential response by our patients as
evinced by changes in the DAS28 greater than 1.2. Forty-two
genes represented by 46 probe sets (Table 3) were found to
be differentially regulated in therapy responders and nonre-
sponders. The majority (40 probe sets representing 36 genes)
was stronger downregulated or lesser upregulated in
responders compared with nonresponders.
The mean of expression signals at t
0
averaged over the
responders (n = 12) and over the nonresponders (n = 7) did
not differ significantly in these genes, with the exception of
SCN2B with P < 0.05 (Additional file 1, Table S3a). A subset
of 23 genes (represented by 27 probe sets) were approved to
be differentially expressed according to the permutation test,
with a significance level α = 0.05.
All 1,035 gene pairs resulting from the 46 preselected probe
sets of differentially expressed genes were examined accord-
ing to their ability to clearly discriminate responders and non-
responders. For each gene pair, a set of classifiers was
constructed and evaluated by cross-validation using the leave-
one-out method. Seven gene pairs (Table 4) produced a pre-
diction accuracy Q > 89%. Baseline levels of the selected
gene pairs were not reliable in predicting the outcome as
reflected by Q
t0log
values between 42.1% and 79.0% (Addi-
tional file 1, Table S4a). The classification performance was
also insufficient when using expression levels at t
1
(Q
t1log
). Fig-
ure 1 shows a representative example of a discriminating gene
Table 2
Comparison of clinical characteristics at baseline
Characteristic Responder Nonresponder P value
Age (years) 48.33 (± 12.29) 58.14 (± 13.67) 0.125
a
Gender (male) 2/12 2/7 0.603
b
Rheumatoid arthritis duration (years) 13.5 (± 10.46) 18.86 (± 13.93) 0.353
a
Steroids (mg/d) 6.71 (± 5.16) 10.43 (± 6.80) 0.195
a
28-joint-count Disease Activity Score baseline 5.75 (± 0.94) 5.33 (± 0.97) 0.364
a
Antibodies to cyclic citrullinated peptide-negative 5/12 1/7 0.333
b
Disease-modifying antirheumatic drugs
None 3/12 4/7 0.326
b
Leflunomide 2/12 2/7 0.603
b
Methotrexate 5/12 1/7 0.333
b
Cyclosporin A 1/12 0/7 1.000
b
Sulfasalazine/hydroxychloroquin 1/12 0/7 1.000
b
Both patient groups show similar characteristics before therapy onset (mean ± standard deviation and number of patients, respectively).
Statistical tests (
a
two-sample t test,
b
exact Fisher test) were applied to check whether any of the parameters are associated with clinical outcome.
Available online />Page 5 of 10
(page number not for citation purposes)
Table 3
Differentially regulated genes (probe sets) in responders and nonresponders
Symbol Accession
number
Probe set Function J value Direction
a
Significance
b
Transcription/regulation
of transcription
TNFAIP3 AI738896 202643_s_at TNFα-induced protein 3 1.1830 - +
TNFAIP3 NM_006290 202644_s_at TNFα-induced protein 3 0.9956 - +
NFKBIA AI078167 201502_s_at NFκB enhancer in B-cell inhibitor alpha 0.4762 - +
RUNX1 L21756 211620_x_at Runt-related transcription factor 1 0.3940 + +
JUN BG491844 201464_x_at c-jun proto-oncogene 0.1352 - -
ZFP36L2 AI356398 201367_s_at Zinc finger protein 36, C3H type-like 2 0.1308 - +
SRRM2 AI655799 208610_s_at Serine/arginine repetitive matrix 2 0.0081 + -
ASCL1 AW950513 213768_s_at Achaete-scute complex-like 1 0.0444 - -
FOXO3A AF041336 210655_s_at Forkhead box O3A 0.0131 - -
Immune response
IL1B NM_000576 205067_at IL-1β 0.9716 - +
IL1B M15330 39402_ IL-1β 0.9523 - +
CCL4 NM_002984 204103_at Chemokine (C-C motif) ligand 4 0.8002 - +
CCL3 NM_002983 205114_s_at Chemokine (C-C motif) ligand 3 0.4621 - +
CXCR4 AF348491 211919_s_at Chemokine (C-X-C motif) receptor 4 0.2589 - -
CXCL2 M57731 209774_x_at Chemokine (C-X-C motif) ligand 2 0.2532 - +
LTF NM_002343 202018_s_at Lactotransferrin 0.1884 - -
PBEF1 NM_005746 217739_s_at Pre-B-cell colony-enhancing factor 1 0.0751 - -
IGHA1 S55735 217022_s_at Immunoglobulin heavy constant alpha 1 0.0475 - -
IER3 NM_003897 201631_s_at Immediate early response 3 0.0284 - -
Receptors, cell surface
antigens, cell adhesion
ADAM12 AU145357 215613_at ADAM metallopeptidase domain 12 (meltrin
alpha)
0.5538 - +
ICAM1 AI608725 202637_s_at Intercellular adhesion molecule 1 (CD54) 0.5399 - -
SCN2B U87555 210364_at Sodium channel, voltage-gated, type II, beta 0.2294 + +
Signal transduction
PDE4B L20966 211302_s_at Phosphodiesterase 4B, cAMP-specific 0.4374 - +
RAPGEF1 NM_005312 204543_at Rap guanine nucleotide-exchange factor 1 0.2890 - +
MYO10 AI1561354 216222_s_at Myosin X 0.2066 - +
PTPRD NM_002839 205712_at Protein tyrosine phosphatase, receptor type, D 0.1822 + +
SOCS1 AI056051 209999_x_at Suppressor of cytokine signaling 1 0.1239 - -
PDE4B NM_002600 203708_at Phosphodiesterase 4B, cAMP-specific 0.0593 - +
Metabolism
LGALS13 NM_013268 220440_at Lectin, galactose-binding, soluble, 13 (galectin
13)
0.5013 + +
SNCA BG260394 204466_s_at Synuclein, alpha 0.0568 - -
CHST3 AB017915 32094_at Carbohydrate sulfotransferase 3 0.0366 - +
Arthritis Research & Therapy Vol 10 No 3 Koczan et al.
Page 6 of 10
(page number not for citation purposes)
pair (Q = 90.5%). Only one of the 19 patients (patient 16 –
preclassified to be a clinical responder) matches with the pool
of nonresponders. Owing to a DAS28 score that remained
reasonably high, patient 16 eventually resembles a nonre-
sponder according to EULAR criteria.
Finally, the separation strength of classification could be fur-
ther improved by taking triplets of differentially regulated
genes. Thereto, 15,180 triplets as combinations of the 46
selected probe sets were computed. Ten triplets were identi-
fied to express a prediction accuracy >95%. Figure 2 shows
a three-dimensional plot of one representative triplet gene set
as presented in Table 4.
Validation of GeneChip U133A microarray data
Expression levels of a subset of genes were measured by
quantitative real-time PCR for each patient and were com-
pared with Human Genome arrays U133A and U95A (patients
1 to 11). As shown in Table 5, high correlations between the
datasets obtained by three different methods of gene expres-
sion analysis were found.
In eight out of 20 genes selected for real-time quantitative RT-
PCR (NFKBIA, CCL4, IL8, IL1B, PDE4B, TNFAIP3,
PPP1R15A and ADM), the means of the gene expression
change differed significantly for responders and nonrespond-
ers at significance level α < 0.05, as shown in Table 6. For all
these genes, the means of the gene expression changes
measured by quantitative real-time RT-PCR averaged over the
seven nonresponders are positive, whereas those averaged
over the 12 responders are negative or less positive than for
the nonresponders.
Genetic network modelling
A hypothetic dynamic network was calculated (Figure 3) to
reveal the underlying regulatory network that characterizes
responders to the TNFα inhibitor therapy. This responder
Cellular and oxidative
stress response
CROP AW089673 208835_s_at Cisplatin resistance-associated overexpressed
protein
0.7500 + +
PPP1R15A NM_014330 202014_at Protein phosphatase 1, regulatory (inhibitor)
subunit 15A
0.6886 - +
PPP1R15A U83981 37028_at Protein phosphatase 1, regulatory (inhibitor)
subunit 15A
0.5939 - -
DDIT4 M_019058 202887_s_at DNA-damage-inducible transcript 4 0.2366 - -
SOD2 W46388 215223_s_at Superoxide dismutase 2, mitochondrial 0.0724 - -
ADM NM_001124 202912_at Adrenomedullin 0.0459 - +
Transport
ATP2A3 AF068220 207521_s_at ATPase, Ca
2+
transporting, ubiquitous 0.227 - -
CHRND NM_000751 207024_at Cholinergic receptor, nicotinic, delta 0.1977 - +
Protein binding
PIGO AC004472 214990_at Phosphatidylinositol glycan, class O 0.5216 - +
IBRDC3 W27419 36564_at IBR domain containing 3 0.1194 - +
EBP49 NM_001978 204505_s_at Erythrocyte membrane protein band 4.9
(dematin)
0.0804 - -
FBX07 NM_012179 201178_at F-box protein 7 0.0080 - -
Unknown
FSD1 NM_024333 219170_at Fibronectin type III and SPRY domain
containing 1
0.2935 - +
HCG4P6 AF036973 215974_at HLA complex group 4 pseudogene 6 0.1518 - +
C20orf103 NM_013361 219463_at Chromosome 20 open reading frame 103 0.0022 - -
Genes were identified as differentially regulated using a modified t-statistic score, J (see Additional file 1), calculated using signal log ratios at t
1
versus t
0
considering 12 responders and seven nonresponders to etanercept therapy.
a
Direction denotes genes as stronger downregulated or
lesser upregulated in responders compared with nonresponders (-), and vice versa (+).
b
+, significance approved by the resampling method with
the modified t statistic on the significance level α = 0.05 (see Data processing and analysis section).
Table 3 (Continued)
Differentially regulated genes (probe sets) in responders and nonresponders
Available online />Page 7 of 10
(page number not for citation purposes)
model accentuates IL-6 functions through the highest number
of edges (vertex degree of 22) (see Additional file 1).
Discussion
The goal of the present study was to identify reliable biomark-
ers for predicting therapy outcomes in RA patients treated
with the TNFα-blocking agent etanercept. Changes of the pre-
existing gene activities were monitored following the neutrali-
zation of TNFα. The Affymetrix microarray technique produced
reliable semiquantitative results confirmed by comparing real-
time RT-PCR results of selected genes with Affymetrix micro-
array results.
By applying a newly implemented criterion that takes into
account the confidence intervals of the signal log ratios of
gene expression [25] (see Additional file 1), 42 candidate
genes (46 probe sets) were found to be differentially regulated
following a single application of etanercept (Table 2). The early
downregulation of expression levels secondary to TNFα neu-
tralization includes genes involved in different pathways and
cellular processes such as TNFα signalling via NFκB
(TNFAIP3, NFKBIA), NFκB-independent signalling via cAMP
(PDE4B), and in the regulation of cellular and oxidative stress
response (PPP1R15A, DDIT4, CROP, adrenomedullin,
MnSOD). The differential expression of this gene set was
associated with distinct clinical responses as evinced by
changes in overall disease activities 3 months after the start of
treatment. The majority of the identified genes (40 probe sets)
were found to be downregulated in responders compared with
nonresponders. The differential expression of 27 probe sets
was confirmed to be significant using a resampling method.
Most importantly, changes in the expression profiles of these
selected genes, particularly of pairs or triplets of genes
detected 3 days after the start of treatment, were identified as
being closely associated with the outcome of therapy (Addi-
tional file 1, Tables S3a, S3b). Flow cytometry analysis ruled
out that changes of the expression pattern within the first 3
days of treatment were due to an altered cellular distribution of
peripheral blood cells.
Two patients (patients 2 and 16) who were not predicted
properly were classified as outliers by correlating clinical data
and gene expression changes. Patient 2 presents a highly
destructive RA, making it difficult to distinguish joint destruc-
tions in RA from destructions due to secondary osteoarthritis.
Patient 16 displays the highest DAS28 score of the cohort,
Table 4
Combinations of genes predictive for the clinical outcome: gene pairs and gene triplets
Combination Gene 1 Gene 2 Gene 3 Q (%)
Gene pair
1 TNFAIP3 202643_s_at RAPGEF1 204543_at 90.5
2 TNFAIP3 202643_s_at PTPRD 205712_at 90.5
3 TNFAIP3 202644_s_at PTPRD 205712_at 90.5
4 IL1B 205067_at LGALS13 220440_at 90.5
5 CCL4 204103_at ADAM12 215613_at 89.5
6 ADAM12 215613_at CCL3 205114_s_at 89.5
7 FSD1 219170_at HCG4P6 215974_at 89.5
Gene triplet
1 CCL4 204103_at PDE4B 211302_s_at RAPGEF1 204543_at 99.0
2 PDE4B 211302_s_at RAPGEF1 204543_at CXCR4 211919_s_at 98.0
3 CCL4 204103_at PIGO 214990_at RAPGEF1 204543_at 96.8
4 CCL4 204103_at FSD1 219170_at RAPGEF1 204543_at 96.8
5 CCL4 204103_at CCL3 205114_s_at RAPGEF1 204543_at 96.8
6 PDE4B 211302_s_at RUNX1 211620_x_at RAPGEF1 204543_at 96.8
7 CCL4 204103_at LGALS13 220440_at RAPGEF1 204543_at 95.8
8 TNFAIP3 202643_s_at CCL4 204103_at RAPGEF1 204543_at 95.8
9 TNFAIP3 202643_s_at PDE4B 211302_s_at RAPGEF1 204543_at 95.8
10 TNFAIP3 202644_s_at PDE4B 211302_s_at RAPGEF1 204543_at 95.8
Gene pairs and triplets of genes with prognostic relevance for etanercept therapy in rheumatoid arthritis determined using support vector
machines based on 46 selected probe sets of differentially regulated genes. Gene pairs with prediction accuracy Q > 89% and triplets of genes
with prediction accuracy Q > 95% are shown. For gene function refer to Table 3.
Arthritis Research & Therapy Vol 10 No 3 Koczan et al.
Page 8 of 10
(page number not for citation purposes)
making it difficult to classify the patient as responder when
reaching a DAS28 of 5.9, which is exceptionally high. The
stratification of these two cases is hampered in their overall
assessment by the limitation of tools such as the DAS28.
In contrast to changes in gene expression pattern in the first
days of treatment, gene expression signatures at a single time
point, here at baseline, were not reliable in predicting the clin-
ical outcome. Diversities between RA patients on the genetic,
molecular and clinical levels [17] evinced by the presence of
autoantibodies (rheumatoid factor, anti-cyclic citrullinated
peptide antibodies) [26] probably underline the difficulty to
predict therapy outcome solely based on pretreatment expres-
sion profiles. Eventually, the differences seen in transcriptional
responses to etanercept administration might either reflect the
state or type of the RA disease or describe epigenomic/
genomic variabilities within the patient cohort.
The reconstructed dynamic network representing responders
(Figure 3) indicates that not only TNFα may play a significant
role in the response to TNFα inhibitors such as etanercept. IL-
6-related functionalities seem to play a key role in the
responder model, while TNFα-related mechanisms are under-
scored in nonresponders. The functional dynamics of TNFα
and IL-6 might be crucial for the outcome of an etanercept
therapy. In biological terms, functionalities of anti-TNFα
responses observed in nonresponding patients in comparison
with responding patients might emerge due to a differential
dynamic regulation of TNFα and of TNFα-dependent target
gene expression, possibly also flanked by TNFα-independent
mechanisms.
Responders show complex network functions of cytokines
including IL-6-mediated, IL-1-mediated, and IL-8-mediated
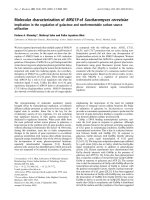
Figure 1
Gene expression changes of a representative predictive gene pairGene expression changes of a representative predictive gene pair.
Shown is the pair PTPRD [205712_at], TNFAIP3 [202643_s_at]. The
pair is presented in Table 4 with a prediction accuracy of 90.5% deter-
mined using the support vector machine algorithm (signal log ratios for
t
1
versus t
0
: (❍) 12 responders and (●) seven nonresponders, defined
due to clinical response; bars denote the confidence intervals of the
signal log ratios). Patient 16 was classified as a nonresponder based
on gene expression data, but as a responder from clinical status.
Figure 2
Gene expression changes of a representative predictive gene tripletGene expression changes of a representative predictive gene triplet.
The triplet of genes TNFAIP3, PDE4B, RAPGEF1 is shown. The triplet
is presented in Table 4 with a prediction accuracy of 95.8% deter-
mined using support vector machines (signal log ratios for t
1
versus t
0
:
(❍) 12 responders and (●) seven nonresponders).
Table 5
Validation of array data by real-time quantitative RT-PCR
Gene Probe set Correlation coefficient
U133A U95A U133A versus RT-PCR (n = 19) U133A versus U95A (n = 11) U95A versus RT-PCR (n = 11)
ICAM1 202637_s_at 32640_at 0.9329 0.8916 0.8560
TNFAIP3 202643_s_at 595_at 0.9437 0.9537 0.9792
IL1B 39402_at 39402_at 0.9443 0.9623 0.9667
PDE4B 211302_s_at 33705_at 0.8880 0.9583 0.6307
PPP1R15A 37028_at 37028_at 0.9519 0.9869 0.7649
Pearson correlation coefficients between real-time quantitative RT-PCR data (-ΔΔC
T
t
1
versus t
0
) and the microarray data from the GeneChip
U133A and U95A for five selected genes found to be differentially regulated in responders and nonresponders are presented.
Available online />Page 9 of 10
(page number not for citation purposes)
activities. Once TNFα signals are therapeutically downregu-
lated, cytokines such as IL-6 and IL-8 become visible, possibly
modulating and eventually attenuating TNF-driven inflamma-
tory processes. This observation is in line with reports on the
pleiotropic/anti-inflammatory actions of IL-6 [27], which dem-
onstrated the role of endogenous IL-6 in controlling the levels
of proinflammatory cytokines in acute inflammatory responses.
The particular role of IL-6 in inflammatory conditions such as
RA is presently considered in therapeutic interventions that
target IL-6 or its receptor [28. Differential changes in the
expression pattern following anti-TNFα treatment can most
probably be attributed to the pre]sence of genetic heteroge-
neities within the group of RA patients, suggesting the pres-
ence of polymorphisms (single nucleotide polymorphisms)
and/or epigenetic differences (DNA methylation patterns) in
the identified genes. These polymorphisms – found in regula-
tory gene elements of central cytokines or downstream cas-
cades – or the combination of single nucleotide
polymorphisms as well as other types of genetic variations
within these differentially regulated or associated genes, such
as copy number variations, might possibly turn out to be
responsible for mediating therapeutic responses as observed.
This hypothesis is supported by findings that some population
differences in gene expressions are attributable to allele fre-
quency differences, in particular at regulatory polymorphisms
[29].
Conclusion
The present findings demonstrate that it is possible to predict
the response of RA patients to anti-TNFα therapy at an early
stage of treatment with likelihood >89% (95%) based on dif-
ferentially expressed gene pairs or gene triplets. By knowing
gene sets differentially regulated by TNFα-blocking therapy,
additional epigenetic/genetic marker information might be
obtained to circumvent the necessity of conducting cost-inten-
sive expression studies. Along these lines, the real challenge
of the listed predictory gene sets (pairs and triplets) is to vali-
date in prospectively designed clinical trials the true accuracy
and clinical value of this approach in selecting patients that
profit most from a TNFα-blocking therapy.
Competing interests
Based on these studies a patent has been applied for (PCT
Patent PCT/EP03/05701, submitted 30 May 2003). The
authors declare that they have no further competing interests.
Authors' contributions
H-JT initiated and coordinated the project. JK directed the
study design and the patient recruitment and clinical assess-
ment. SD and DK played a very substantial part in the experi-
mental work, data collection and interpretation. RG was
responsible for data entry and bioinformatic analysis, assisted
by MH. AD was involved in the quantitative real-time RT-PCR
analysis. All authors contributed to discussions and to several
drafts of the paper. All authors have seen and approved the
final version.
Additional files
Table 6
Gene expression analysis by real-time quantitative RT-PCR
Gene Responder Nonresponder P value
NFKBIA -0.227 (± 0.749) 1.053 (± 1.128) 0.008
CCL4 -0.142 (± 1.184) 1.144 (± 0.924) 0.025
IL8 -0.025 (± 1.871) 2.429 (± 2.489) 0.028
IL1B -0.595 (± 1.680) 1.487 (± 2.191) 0.032
TNFAIP3 0.002 (± 0.895) 1.266 (± 1.510) 0.034
PDE4B -0.276 (± 0.846) 0.534 (± 0.544) 0.037
PPP1R15
A
-0.280 (± 0.935) 0.825 (± 1.225) 0.040
ADM -0.931 (± 1.289) 0.279 (± 1.016) 0.049
Data shown are the changes of gene expression (-ΔΔC
T
t
1
versus t
0
;
mean ± standard deviation) of eight selected genes averaged over
the 12 responders and seven nonresponders, and the corresponding
P values determined by two-sample t test comparing the means of
responders and nonresponders.
Figure 3
Visualization of the inferred dynamic gene regulatory network for the responder groupVisualization of the inferred dynamic gene regulatory network for the
responder group. Each gene is represented by a node, and gene regu-
latory interactions are shown by directed edges. Solid lines, activating
effects; dashed lines, inhibitory effects. The hypothesized network was
reconstructed from quantitative real-time RT-PCR data by the modified
LASSO method.
The following Additional files are available online:
Additional file 1
describing in detail the microarray hybridization as well
as the data processing and analysis.
See />supplementary/ar2419-S1.doc
Arthritis Research & Therapy Vol 10 No 3 Koczan et al.
Page 10 of 10
(page number not for citation purposes)
Acknowledgements
The present study was supported by grants from the German Federal
Ministry of Education and Research (BMBF) (01GG0201), BioChance-
Plus/BMBF (0313692D), and BMBF-Leitprojekt Proteom-Analyse des
Menschen (FKZ 01GG9831).
References
1. Brennan FM, Maini RN, Feldmann M: Role of pro-inflammatory
cytokines in rheumatoid arthritis. Springer Semin
Immunopathol 1998, 20:133-147.
2. Bathon JM, Genovese MC: The Early Rheumatoid Arthritis
(ERA) trial comparing the efficacy and safety of etanercept and
methotrexate. Clin Exp Rheumatol 2003, 21:S195-S197.
3. Keystone EC, Schiff MH, Kremer JM, Kafka S, Lovy M, DeVries T,
Burge DJ: Once-weekly administration of 50 mg etanercept in
patients with active rheumatoid arthritis: results of a multi-
center, randomized, double-blind, placebo-controlled trial.
Arthritis Rheum 2004, 50:353-363.
4. Brennan A, Bansback N, Reynolds A, Conway P: Modelling the
cost-effectiveness of etanercept in adults with rheumatoid
arthritis in the UK. Rheumatology 2004, 43:62-72.
5. Klareskog L, Heijde D van der, de Jager JP, Gough A, Kalden J,
Malaise M, Martín Mola E, Pavelka K, Sany J, Settas L, Wajdula J,
Pedersen R, Fatenejad S, Sanda M: Therapeutic effect of the
combination of etanercept and methotrexate compared with
each treatment alone in patients with rheumatoid arthritis:
double-blind randomised controlled trial. Lancet 2004,
363:675-681.
6. Hyrich KL, Watson KD, Silman AJ, Symmons DP: Predictors of
response to anti-TNF-α therapy among patients with rheuma-
toid arthritis: results from the British Society for Rheumatol-
ogy Biologics Register. Rheumatology 2006, 45:1558-1565.
7. Bobbio-Pallavicini F, Alpini C, Caporali R, Avalle S, Bugatti S, Mon-
tecucco C: Autoantibody profile in rheumatoid arthritis during
long-term infliximab treatment. Arthritis Res Ther 2004,
6:R264-R272.
8. Kekow J, Wollenberg H, Kühne C, Drynda A, Drynda S: Clinical
significance of anti-cyclic citrullinated peptide (CCP) antibod-
ies in monitoring patients with rheumatoid arthritis (RA)
treated with etanercept. Arthritis Rheum 2005, 52:s550.
abstract
9. Ranganathan P: Pharmacogenomics of tumor necrosis factor
antagonists in rheumatoid arthritis. Pharmacogenomics 2005,
6:481-490.
10. Kang CP, Lee KW, Yoo DH, Kang C, Bae SC: The influence of a
polymorphism at position -857 of the tumour necrosis factor
alpha gene on clinical response to etanercept therapy in rheu-
matoid arthritis. Rheumatology 2005,
44:547-552.
11. Lee YH, Rho YH, Choi SJ, Ji JD, Song GG: Association of TNF-
alpha -308 G/A polymorphism with responsiveness to TNF-
alpha-blockers in rheumatoid arthritis: a meta-analysis. Rheu-
matol Int 2006, 27:157-161.
12. Schotte H, Schluter B, Drynda S, Willeke P, Tidow N, Assmann G,
Domschke W, Kekow J, Gaubitz M: Interleukin 10 promoter mic-
rosatellite polymorphisms are associated with response to
long term treatment with etanercept in patients with rheuma-
toid arthritis. Ann Rheum Dis 2005, 64:575-581.
13. Ulfgren AK, Andersson U, Engstrom M, Klareskog L, Maini RN,
Taylor PC: Systemic anti-tumor necrosis factor alpha therapy
in rheumatoid arthritis down-regulates synovial tumor necro-
sis factor alpha synthesis. Arthritis Rheum 2000,
43:2391-2396.
14. Schotte H, Schluter B, Willeke P, Mickholz E, Schorat MA, Dom-
schke W, Gaubitz M: Long-term treatment with etanercept sig-
nificantly reduces the number of proinflammatory cytokine-
secreting peripheral blood mononuclear cells in patients with
rheumatoid arthritis. Rheumatology (Oxford). 2004,
43:960-964.
15. Drynda S, Kuhne C, Kekow J: Soluble tumour necrosis factor
receptor treatment does not affect raised transforming growth
factor beta levels in rheumatoid arthritis. Ann Rheum Dis
2002, 61:254-256.
16. Catrina AI, Lampa J, Ernestam S, af Klint E, Bratt J, Klareskog L, Ulf-
gren AK: Anti-tumour necrosis factor (TNF)-alpha therapy
(etanercept) down-regulates serum matrix metalloproteinase
(MMP)-3 and MMP-1 in rheumatoid arthritis. Rheumatology
2002, 41:484-489.
17. Pouw Kraan TC van der, van Gaalen FA, Kasperkovitz PV, Verbeet
NL, Smeets TJ, Kraan MC: Rheumatoid arthritis is a heteroge-
neous disease: evidence for differences in the activation of the
STAT-1 pathway between rheumatoid tissues. Arthritis Rheum
2003, 48:2132-2145.
18. Glocker MO, Guthke R, Kekow J, Thiesen HJ: Rheumatoid arthri-
tis, a complex multifactorial disease: on the way toward indi-
vidualized medicine. Med Res Rev 2006, 26:63-87.
19. Lequerre T, Gauthier-Jauneau AC, Bansard C, Derambure C, Hiron
M, Vittecoq O, Daveau M, Mejjad O, Daragon A, Tron F, Le Loët X,
Salier JP: Gene profiling in white blood cells predicts infliximab
responsiveness in rheumatoid arthritis.
Arthritis Res Ther
2006, 8:R105.
20. Lindberg J, af Klint E, Catrina AI, Nilsson P, Klareskog L, Ulfgren
AK, Lundeberg J: Effect of infliximab on mRNA expression pro-
files in synovial tissue of rheumatoid arthritis patients. Arthritis
Res Ther 2006, 8:R179.
21. Arnett FC, Edworthy SM, Bloch DA, McShane DJ, Fries JF, Cooper
NS, Healey LA, Kaplan SR, Liang MH, Luthra HS: The American
Rheumatism Association 1987 revised criteria for the classifi-
cation of rheumatoid arthritis. Arthritis Rheum 1988,
31:315-324.
22. Prevoo ML, van 't Hof MA, Kuper HH, van Leeuwen MA, Putte LB
van de, van Riel PL: Modified disease activity scores that
include twenty-eight-joint counts. Development and validation
in a prospective longitudinal study of patients with rheumatoid
arthritis. Arthritis Rheum 1995, 38:44-48.
23. Boyum A: Isolation of lymphocytes, granulocytes and
macrophages. Scand J Immunol 1976:9-15.
24. ArrayExpress [ />]
25. Thiesen HJ, Glocker MO, Guthke R, Kekow J: Patent PCT/EP03/
05701. . 30 May 2003
26. van Boekel MA, Vossenaar ER, Hoogen FH van den, van Venrooij
WJ: Autoantibody systems in rheumatoid arthritis: specificity,
sensitivity and diagnostic value. Arthritis Res 2002, 4:87-93.
27. Kishimoto T: Interleukin-6: discovery of a pleiotropic cytokine.
Arthritis Res Ther 2006, 8(Suppl 2):S2.
28. Maini RN, Taylor PC, Szechinski J, Pavelka K, Broll J, Balint G,
Emery P, Raemen F, Petersen J, Smolen J, Thomson D, Kishimoto
T, CHARISMA Study Group: Double-blind randomized control-
led clinical trial of the interleukin-6 receptor antagonist, tocili-
zumab, in European patients with rheumatoid arthritis who
had an incomplete response to methotrexate. Arthritis Rheum
2006, 54:2817-2829.
29. Spielman RS, Bastone LA, Burdick JT, Morley M, Ewens WJ, Che-
ung VG: Common genetic variants account for differences in
gene expression among ethnic groups. Nat Genet 2007,
39:226-231.