Báo cáo y học: "Development of a health care utilisation data-based index for rheumatoid arthritis severity: a preliminary study" ppt
Bạn đang xem bản rút gọn của tài liệu. Xem và tải ngay bản đầy đủ của tài liệu tại đây (155.78 KB, 9 trang )
Open Access
Available online />Page 1 of 9
(page number not for citation purposes)
Vol 10 No 4
Research article
Development of a health care utilisation data-based index for
rheumatoid arthritis severity: a preliminary study
Gladys Ting
1
, Sebastian Schneeweiss
1
, Richard Scranton
2
, Jeffrey N Katz
3
, Michael E Weinblatt
3
,
Melissa Young
2
, Jerry Avorn
1
and Daniel H Solomon
1,3
1
Division of Pharmacoepidemiology, Department of Medicine, Brigham and Women's Hospital, Harvard Medical School, 1620 Tremont Street, Suite
3030, Boston, MA 02120, USA
2
Masschusetts Veterans Epidemiology Research and Information Center, VA Cooperative Studies Program, VA Boston Healthcare System, 150
South Huntington Avenue, Jamaica Plain, MA 02130, USA
3
Division of Rheumatology, Immunology and Allergy, Department of Medicine, Brigham and Women's Hospital, Harvard Medical School, 75 Francis
Street, Boston, MA 02115, USA
Corresponding author: Daniel H Solomon,
Received: 12 May 2008 Revisions requested: 20 Jun 2008 Revisions received: 25 Jul 2008 Accepted: 21 Aug 2008 Published: 21 Aug 2008
Arthritis Research & Therapy 2008, 10:R95 (doi:10.1186/ar2482)
This article is online at: />© 2008 Ting et al.; licensee BioMed Central Ltd.
This is an open access article distributed under the terms of the Creative Commons Attribution License ( />),
which permits unrestricted use, distribution, and reproduction in any medium, provided the original work is properly cited.
Abstract
Introduction Health care utilisation ('claims') databases contain
information about millions of patients and are an important
source of information for a variety of study types. However, they
typically do not contain information about disease severity. The
goal of the present study was to develop a health care claims
index for rheumatoid arthritis (RA) severity using a previously
developed medical records-based index for RA severity (RA
medical records-based index of severity [RARBIS]).
Methods The study population consisted of 120 patients from
the Veteran's Administration (VA) Health System. We previously
demonstrated the construct validity of the RARBIS and
established its convergent validity with the Disease Activity
Score (DAS28). Potential claims-based indicators were entered
into a linear regression model as independent variables and the
RARBIS as the dependent variable. The claims-based index for
RA severity (CIRAS) was created using the coefficients from
models with the highest coefficient of determination (R
2
) values
selected by automated modelling procedures. To compare our
claims-based index with our medical records-based index, we
examined the correlation between the CIRAS and the RARBIS
using Spearman non-parametric tests.
Results The forward selection models yielded the highest
model R
2
for both the RARBIS with medications (R
2
= 0.31) and
the RARBIS without medications (R
2
= 0.26). Components of
the CIRAS included tests for inflammatory markers, number of
chemistry panels and platelet counts ordered, rheumatoid
factor, the number of rehabilitation and rheumatology visits, and
Felty's syndrome diagnosis. The CIRAS demonstrated
moderate correlations with the RARBIS with medication and the
RARBIS without medication sub-scales.
Conclusion We developed the CIRAS that showed moderate
correlations with a previously validated records-based index of
severity. The CIRAS may serve as a potentially important tool in
adjusting for RA severity in pharmacoepidemiology studies of
RA treatment and complications using health care utilisation
data.
Introduction
Rheumatoid arthritis (RA) is an autoimmune disease charac-
terised by pain, morning stiffness, joint swelling, deformity and
functional impairments. Patients with RA have an increased
risk of mortality and several adverse outcomes such as infec-
tions and cancer compared with those who do not have RA
[1-4]. Several studies, however, suggest that complications in
RA patients may not be attributable to the disease itself, but to
the use of disease-modifying anti-rheumatic drugs (DMARD).
For instance, tumour necrosis factor (TNF) α blocking agents
have an association with specific types of infections and may
be related to an excess risk of lymphomas and neurological
ACR = American College of Rheumatology; CIRAS = claims-based index of rheumatoid arthritis severity; CRP = C-reactive protein; DAS = disease
activity score; DMARD = disease modifying anti-rheumatic drug; ESR = erythrocyte sedimentation rate; RA = rheumatoid arthritis; RARBIS = rheu-
matoid arthritis records-based index of severity; TNF = tumour necrosis factor; VA = Veterans Administration
Arthritis Research & Therapy Vol 10 No 4 Ting et al.
Page 2 of 9
(page number not for citation purposes)
complications [5-9]. Conventional DMARDs may also
increase the incidence of lymphoma [10,11].
In studies that seek to determine the relationship between
drug therapy and adverse events, disease severity is an impor-
tant confounder. That is, disease severity is known to increase
the risk of many adverse events and is probably associated
with a higher likelihood of receiving more immunomodulating
DMARDs. Failure to adjust for such confounding by indication
can create false associations between the exposure and study
outcome [12].
Health care utilisation ('claims') data are routinely collected for
insurance and are commonly used in health services research
[13,14]. Because adverse outcomes of RA are relatively rare,
health care utilisation databases are an ideal source of infor-
mation for studies of the relationship between DMARDs and
adverse events such as cancer and infections. Thus, the devel-
opment of an RA disease severity measure from claims merits
high priority. We believe that health care claims data contain
information such as physician visits, surgeries and laboratory
tests that correlate with RA disease severity. Thus, to develop
a claims-based severity index, we first created an RA medical
records-based index of severity (RARBIS) from ratings by a
Delphi panel on potential markers of RA severity commonly
found in medical charts [15]. We then assessed the perform-
ance of the RARBIS in a cohort of Veteran's Administration
(VA) patients and showed that the RARBIS correlated moder-
ately well with RA treatment intensity and thus exhibited con-
struct validity [16]. Next, we established the convergent
validity of the RARBIS against a widely-used and accepted RA
clinical measure, the Disease Activity Score (DAS28) [17].
The goal of the present study was to develop a claims-based
severity index (claims-based index for RA severity [CIRAS])
using the previously validated RARBIS, not the DAS28. If val-
idated as a measure of RA disease severity, the CIRAS may
serve as a potentially important tool in adjusting for RA severity
in pharmacoepidemiology studies of RA treatment and compli-
cations using health care utilisation data.
Materials and methods
Study population and data source
The study population consisted of 120 patients from the New
England region of the VA Health System who had at least two
recorded visits with a diagnosis of RA (International Classifica-
tion of Disease-9-CM 714.0), at least two outpatient visits
from hospitals within the New England VA Health System from
July 1999 to June 2001 and had sufficient evidence of RA
from their medical record. The VA maintains a comprehensive
electronic medical records database containing information on
demographic characteristics, surgical history, prescriptions,
laboratory results, discharge summaries, radiology reports and
progress notes. A review of the VA electronic medical records
of the study population was conducted to obtain information
on individual components of the RARBIS. The current study
was approved by the VA Health System Human Subjects
Committee.
RA records-based index of severity
A records-based index of severity was developed based on
ratings from a Delphi panel of six New England board certified
rheumatologists of potential indicators of RA severity [15]. The
potential indicators were divided into the following categories:
radiological and laboratory results; surgeries; extra-articular
manifestations; clinical and functional status; and medications
(see Table 1). Indicators that were ranked by the panel as hav-
ing strong or very strong associations with RA severity and are
typically found in medical charts were incorporated into the
RARBIS. Sub-scales and individual components of the RAR-
BIS were weighted according to how strongly they were
regarded by the panel as being correlated with disease sever-
ity. Because we wanted to develop an administrative-based
severity score that could be used to study drug-outcome rela-
tionships, we created the RARBIS with the option to exclude
the medication sub-scale.
Data on clinical status indicators (number of flares, physician
global rating, functional and ambulatory status, presence of
swollen joints, receipt of intra-articular and intramuscular injec-
tions, and hours of morning stiffness) and medication use from
the VA medical records visit notes were collected for the chart
review study period, 30 June 2000 to 30 June 2001. Data on
medication use were derived from pharmacy records. We
obtained information on surgical history (C1–C2 fusion and
joint surgery), laboratory values (rheumatoid factor, erythrocyte
sedimentation rate [ESR], C-reactive protein [CRP] and plate-
let counts), extra-articular manifestations (subcutaneous nod-
ules and vasculitis) and X-rays (C1–C2 subluxation, erosions)
from all available data in the medical record.
Potential health care utilisation data indicators of RA
severity
We extracted the following information from the VA data-
bases: rehabilitation visits (physical and occupational therapy),
rheumatology visits, plain radiographs (hand, wrist, foot, ankle
and cervical spine), extra-articular manifestations (pulmonary,
soft tissue nodules, Felty's syndrome and Sjogren's syn-
drome), number of inflammatory marker (CRP and ESR) tests,
number of platelet counts and chemistry panels ordered, rheu-
matoid factor testing, joint surgery (hand, wrist, knee, foot,
ankle, elbow, cervical spine and shoulder) and DMARD use.
The administrative study data period included both the one-
year (1 July 1999 to 29 June 2000) and two-year (1 July 1
1998 to 29 June 2000) period before the one-year chart
review study period.
Each physical therapy and occupational therapy visit was
counted as a rehabilitation visit. Tests for CRP and ESR were
aggregated into one category. Tests performed on the same
day counted as separate tests. The number of hand, wrist,
Available online />Page 3 of 9
(page number not for citation purposes)
Table 1
Rheumatoid arthritis medical records-based index of severity
Sub-scale Points
1. Surgery sub-scale:
C1–C2 fusion 3 points
Any hand joint 1 point
Any foot joint 1 point
Major joints (hips, knees, shoulder, elbow, wrist, ankle) 1 point each (max of 2)
Maximum score for category: 5 points
2. X-ray sub-scale:
C1–C2 subluxation 3 points
Any erosions 1 point
Maximum score for category: 4 points
3. Extra-articular manifestations sub-scale:
Vasculitis 1 point
Pulmonary nodule 1 point
Maximum score for category: 1 point
4. Clinical status sub-scale:
Arthritis flares
1 1 point
2 to 4 2 points
5 + 3 points
Worst physician global rating: "doing poor" 2 points
Functional status
Unable to do hobbies 1 point
Unable to work 2 points
Unable to care for self 3 points
Hours of morning stiffness
<1 0 point
1 to 4 1 point
>4 2 points
Maximum score for category: 3 points
5. Laboratory sub-scale:
Rheumatoid factor titre > upper limit normal 1 point
Erythrocyte sedimentation rate > age/2 or C-reactive protein > upper limit normal or platelets > 450 K 1 point
Maximum score for category: 2 points
Summary score for primary index Maximum 15 points
6. Optional medication sub-scale:
Any of the following medications: hydroxychloroquine, gold, sulfasalazine 1 point
Any of the following medications: methotrexate, leflunomide 2 points
Any of the following medications: cyclophosphamide, azathioprine, cyclosporin, anakinra, adalimumab, etanercept,
infliximab
3 points
Maximum score for category: 3 points
Summary score for extended index: Maximum 18 points
Arthritis Research & Therapy Vol 10 No 4 Ting et al.
Page 4 of 9
(page number not for citation purposes)
Table 2
Patient characteristics based on information from the medical records review
N (%) or mean (SD)
Age, years 70.6 (11.1)
No of rheumatology visits 3.0 (2.1)
Male 109 (91)
ACR functional classification
Class I (no limitation) 93 (78)
Class II (self-care, working, no hobbies) 8 (7)
Class III (self care, not working, no hobbies) 6 (5)
Class IV (limited self care, bed-bound) 4 (3)
Ambulatory status
Independent 79 (66)
With device 25 (21)
Wheelchair 5 (4)
Morning stiffness, hours
<1 70 (58)
1 to 4 25 (21)
>4 8 (7)
Flares
0 65 (54)
1 22 (18)
1 to 4 11 (9)
5+ 3 (3)
Hospitalised 7 (6)
Swollen joints 64 (53)
Rheumatoid nodules 41 (34)
Vasculitis 1 (1)
Physician global: poor 7 (6)
Patient global: poor 11 (9)
Employed out of home 10 (8)
Received intraarticular injections 11 (9)
Received intramuscular injections 1 (1)
Presence of C1–C2 subluxation 2 (2)
Joint space narrowing 74 (62)
Joint erosions 61 (51)
Pulmonary nodule 11 (9)
RARBIS score (with medication sub-scale) 4.4
RARBIS score (without medication sub-scale) 3.0
ACR, American College of Rheumatology; RARBIS, rheumatoid arthritis records-based index of severity.
Available online />Page 5 of 9
(page number not for citation purposes)
Table 3
Unadjusted Spearman correlations with the rheumatoid arthritis records-based index of severity (RARBIS) with and without
medication sub-scale
RARBIS with medication sub-scale RARBIS without medication sub-scale
Claims-based variables Correlation coefficient p value Correlation coefficient p value
Rheumatology visits 0.32472 < 0.001 0.1859 0.04
Rehabilitation visits 0.11249 0.22 0.19199 0.04
X-ray 0.07798 0.40 0.01623 0.86
Rheumatoid lung involvement -0.02654 0.77 -0.0428 0.64
Felty's syndrome 0.16301 0.08 0.18168 0.047
Hand surgery 0.07074 0.44 0.05358 0.56
Number of inflammatory marker tests ordered 0.38775 <.0001 0.28664 0.002
Rheumatoid factor test 0.22267 0.01 0.22 0.02
Number of platelet counts ordered 0.29883 <0.0001 0.21888 0.02
Number of chemistry panels ordered 0.26246 0.004 0.15374 0.0936
Medication count 0.21497 0.0184
Table 4
Adjusted correlations between claims-based variables and rheumatoid arthritis records-based index of severity (RARBIS) with and
without medication sub-scale
RARBIS with medication sub-scale RARBIS without medication sub-scale
Claims-based variables Partial R
2
Age and gender 0.08 0.05
Rheumatologist visits 0.01 N/A
Rehabilitation visits 0.01 0.04
Felty's syndrome 0.01 0.03
Number of inflammatory Marker tests ordered 0.14 0.08
Rheumatoid factor test 0.02 0.04
Number of platelet counts ordered 0.03 0.01
Number of chemistry panels ordered 0.01 0.02
Model R
2
0.31 0.26
Arthritis Research & Therapy Vol 10 No 4 Ting et al.
Page 6 of 9
(page number not for citation purposes)
foot, ankle and cervical spine radiographs were also added
together into one category. Three methods were used to count
the number of prescriptions in a given year. First, we counted
the total number of prescriptions (including repeat prescrip-
tions) for the following 10 medications: auranofin, aurothioglu-
cose, azathioprine, cyclosporine, etanercept (Enbrel, Amgen),
hydroxychloroquine, infliximab (Remicade, Centocor), lefluno-
mide, methotrexate and sulfasalazine (adalimumab, abatacept
and rituximab were not yet available for RA). For the second
method, prescriptions for each DMARD were counted once
and added to obtain the total number of different DMARDs.
For the third method, synthetic DMARDs and biological
DMARDs were counted separately. Prescription for each type
of DMARD was counted only once and then added together
to obtain the total number of different synthetic DMARDs and
biological DMARDs.
Statistical analyses
For each patient, scores were calculated for the RARBIS with
and without the medication sub-scale using data from the
medical chart review. Using Spearman non-parametric tests,
the correlations between the RARBIS and various forms of
administrative data variables were then analysed. Data taken
from one year before the chart review and from two years
before the chart review were examined.
We then built linear regression models with the RARBIS as the
dependent variable and the administrative data variables as
the independent variables using SAS (Cary NC) automated
procedures and the forward, backward and stepwise selection
methods to select the best model. Administrative data varia-
bles were entered into the model in the form that gave the
highest Spearman correlation with the RARBIS. The inclusion
criterion for model selection was p < 0.2.
We added the regression parameters based on each patient's
covariate values using PROC Score (SAS, Cary NC) to calcu-
late claims-based severity scores (with and without the medi-
cation variables) for each patient in the study cohort. Finally,
we examined the correlation between the CIRAS and the
RARBIS using the non-parametric Spearman correlation coef-
ficient.
Results
Characteristics of the study population are summarised in
Table 2. The study cohort was predominantly male with a
mean age of 71 years. During the chart review study period,
most had no functional limitations (78%) and did not require a
device or wheelchair for ambulatory purposes (66%). About
one-half of the population had swollen joints, morning stiffness
that lasted less than one hour, but did not have an arthritis
flare. The mean score for the RARBIS with medications was
4.4 (range 0 to 11) and without medications was 3.0 (range 0
to 8).
Table 3 provides the unadjusted Spearman correlations for the
claims-based RA severity variables and the RARBIS with and
without the medication sub-scale using data from one year
before the chart review study period. The variables for rheuma-
tology visits, inflammatory markers and other laboratory mark-
ers yielded the highest correlation with the RARBIS. In our
analysis using administrative data from one year before the
chart review period, the highest correlation between the RAR-
BIS and the medication variable were obtained using the med-
ication variable created from the sum of all DMARD
prescriptions in method one. For both the RARBIS with and
without medication scale, having data from two years before
the chart review period did not substantially increase the
Spearman correlation coefficients and, in some cases, even
decreased the value of the coefficients (data not shown).
Table 4 presents the adjusted correlations between the
claims-based RA severity variables and the RARBIS with and
without the medication sub-scale with data from one year
before the chart review study period. The forward selection
models yielded the highest model R
2
for both the RARBIS with
the medication sub-scale (R
2
= 0.31) and the RARBIS without
the medication sub-scale (R
2
= 0.26). Using two years of data
resulted in lower model R
2
s (data not shown).
Table 5 includes the means and ranges for the CIRAS scores
and the Spearman correlation coefficients between the
CIRAS and the RARBIS. The CIRAS score with the highest
correlation with the RARBIS included the following compo-
nents: orders for inflammatory markers, rehabilitation visits,
Table 5
Claims-based index of rheumatoid arthritis severity (CIRAS) score (mean, range) and Spearman correlation of CIRAS score with
rheumatoid arthritis records-based index of severity (RARBIS)
RARBIS with medication RARBIS without medication
CIRAS (mean) 4.38 3.03
CIRAS (range) 1.18–8.11 1.17–6.02
CIRAS (Spearman, (pvalue)) 0.56 (<0.0001) 0.51 (<0.0001)
Available online />Page 7 of 9
(page number not for citation purposes)
age and gender, rheumatoid factor, presence of Felty's syn-
drome, number of platelet counts and chemistry panels
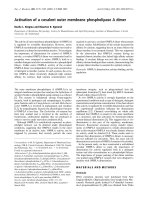
ordered, and rheumatology visits. Figure 1 is a graphic repre-
sentation of this CIRAS score in tertiles versus the median and
interquartile range for the RARBIS with medication sub-scale.
Table 6 presents the suggested scoring method for the
CIRAS.
Discussion
We developed a claims-based RA severity index (CIRAS) that
demonstrated moderate correlation with a previously validated
medical records-based index, the RARBIS. The RARBIS has
been previously shown to have good construct validity and
moderate convergent validity with the DAS28 [16,17].
Because health care utilisation databases are a valuable
source of data for studying health outcomes, other investiga-
tors have also used medical records-based indices to create
indices for administrative databases. For instance, Deyo and
colleagues adapted the Charlson Comorbidity Index, a well-
validated index designed for medical records, so that Interna-
tional Classification of Diseases, Ninth Revision codes could
be used to calculate the Charlson Comorbidity Index from
administrative data [18]. Components of the administrative-
based index we developed for RA include orders for inflamma-
tory markers, number of platelet counts and chemistry panels
ordered, rheumatoid factor, rehabilitation visits, age and gen-
der, presence of Felty's syndrome and number of rheumatol-
ogy visits. If the CIRAS is found to be valid in other
populations, then it might be used to partially adjust for an
important confounder, disease severity, in claims-based epide-
miology studies. In our analysis, we used data taken from one
and two years before the chart review study period. However,
using two years of data resulted in lower R
2
and Spearman
correlation values. Including another year of older data might
have caused a dilution effect. Additionally, to compute scores
on the CIRAS, we used weights from the regression models
with the RARBIS. Other methods of weighting could have
been chosen, for example, assigning a value of one to admin-
istrative variables that had significant correlations with the
RARBIS. However, we believe that the method we selected,
using beta coefficients as weights, better captures the rela-
tionship between the CIRAS and the RARBIS.
Because administrative data are collected primarily for reim-
bursement purposes, some question the use of claims data for
clinical research regarding disease severity [19]. However,
administrative data are gaining increasing acceptance in
health care research, because they represent typical popula-
tions, contain large cohorts of patients with given conditions
and are readily available. We also demonstrate in the present
study that indicators of RA severity from claims data are mod-
erately well related to clinical indicators of RA severity. Thus, it
is possible to capture RA disease severity to some degree in
claims data. Other proxies for severity of illness measures
using claims data such as the diagnosis related group, the all
Table 6
Suggested scoring method for claims-based index of
rheumatoid arthritis severity (CIRAS)
Claims-based variables Score
Age (continuous) -0.066
Gender -0.092
0: male
1: female
Number of inflammatory marker tests ordered
a
0.60
0: no
1: yes
Rehabilitation visits
a
0.69
0: no
1: yes
Rheumatoid factor test
a
2.1
0: no
1: yes
Felty's syndrome
a
2.3
0: no
1: yes
Number of platelet counts ordered
a
0.42
0: platelet count = 0
1: platelet count = 1
2: platelet count = 2
3: platelet count = 3
4: platelet count ≥ 4
Number of chemistry panels ordered
a
-0.14
0: chemistry panels = 0
1: chemistry panels = 1
2: chemistry panels = 2
3: chemistry panels = 3
4: chemistry panels = 4
5: chemistry panels ≥ 5
Rheumatologist visits
a
0.52
1: number of rheumatology visits = 0
2: number of rheumatology visits = 1, 2, 3, or 4
3: number of rheumatology visits>4
Intercept 6.5
a
Time period for which data was captured for these variables is one
year. Claims-based variables shown are included in the model
selected from automated modeling procedures with rheumatoid
arthritis records-based index of severity (RARBIS) as the dependent
variable and potential claims-based variables as independent
variables. Scores represent parameter estimates for these
explanatory variables and can be used as weights when computing
the CIRAS. To obtain an overall CIRAS score, multiply the value of
each claims-based variable with its corresponding score and then
sum all the scores and the value for the intercept.
Arthritis Research & Therapy Vol 10 No 4 Ting et al.
Page 8 of 9
(page number not for citation purposes)
patients refined diagnosis related group and the International
Classification of Diseases Ninth Revision-Based Illness
Severity Score have been developed [20]. Unlike the CIRAS,
these other measures are not specific to RA.
The present study has important limitations. Our data source
for this study was the New England VA Health system. The
VA's population is mostly older men. Older male patients with
RA may not represent typical RA patients. This highlights the
need to consider these findings as preliminary and requiring
replication in other settings. Additionally, data from the VA
might be gathered differently from other health care systems,
again highlighting the preliminary nature of our findings. How-
ever, because the VA contains rich data from both medical
record and health care utilisation databases, it is a unique and
ideal data source for our analysis. Additionally, the RARBIS,
which we used to create the CIRAS, was developed using
standard nominal group technique methods, followed by
assessing its convergent validity with the DAS28. However,
the DAS28 is a measure of disease activity not disease sever-
ity. While disease activity is an important component of dis-
ease severity, it is not the same. Currently, there is no standard
RA disease severity measure.
In our cohort of 120 VA patients, the CIRAS showed moderate
correlations with a validated medical records-based index and
can be used for improved adjustment of RA disease severity in
claims data studies. We do not believe that the value of the
CIRAS will be limited to the VA population. We plan on
assessing its validity in other populations, such as Medicare
patients, and will examine its ability to adjust for confounding
and predictive validity for outcomes known to be associated
with severe RA, such as future joint surgeries, higher medical
care costs and use of combination DMARDs. Additionally, we
will explore whether different variations of the CIRAS should
be used depending on the study outcome of interest. Ulti-
mately, the CIRAS may be an important methodological tool
for researchers studying RA treatment and complications
using health care utilisation data, but further tests need to be
conducted in other populations.
Conclusion
We developed a claims-based severity index (CIRAS) from a
previously validated medical records-based index (RARBIS).
The CIRAS can potentially be used for improved adjustment of
RA severity in studies of RA medication use and adverse out-
comes using claims data, but future studies should examine its
validity in other populations.
Competing interests
The authors declare that they have no competing interests.
Authors' contributions
GT analysed the data and drafted the manuscript. SS provided
support on the statistical analyses, interpretation of data and
helped edit the manuscript. RS provided access to the data
and helped edit the manuscript. JNK and MEW provided
advice on the conceptual design and helped edit the manu-
script. MY provided access to the data and helped edit the
manuscript. JA contributed conceptual advice and helped edit
the manuscript. DHS provided conceptual design, analytic
support, access to the data and helped edit the manuscript.
Acknowledgements
This work was supported by the Engalitcheff Arthritis Outcomes Initia-
tive. Dr. Solomon's work is also supported by National Institute of Health
grants (P60 AR47782 and K24 AR055989). Dr Katz's work is sup-
ported by National Institute of Health grants (P60 AR47782 and K24
AR02123). This material is the result of work supported with resources
and the use of facilities at the VA Boston Healthcare System and VA
Cooperative Studies Program.
References
1. Doran MF, Crowson CS, Pond GR, O'Fallon WM, Gabriel SE:
Predictors of infection in rheumatoid arthritis. Arthritis Rheum
2002, 46:2294-2300.
2. Sihvonen S, Korpela M, Laippala P, Mustonen J, Pasternack A:
Death rates and causes of death in patients with rheumatoid
arthritis: a population-based study. Scand J Rheumatol 2004,
33:221-227.
3. Wolfe F, Michaud K: Lymphoma in rheumatoid arthritis: the
effect of methotrexate and anti-tumor necrosis factor therapy
in 18,572 Patients. Arthritis Rheum 2004, 50:1740-1751.
4. Gridley G, McLaughlin JK, Ekbom A, Klareskog L, Adami HO,
Hacker DG, Hoover R, Fraumeni JF Jr: Incidence of cancer
among patients with rheumatoid arthritis. J Natl Cancer Inst
1993, 85:307-311.
5. Keane J, Gershon S, Wise RP, Mirabile-Levens E, Kasznica J,
Schwieterman WD, Siegel JN, Braun MM: Tuberculosis associ-
ated with infliximab, a tumor necrosis factor alpha-neutralizing
agent. N Engl J Med 2001, 345:1098-1104.
6. Bongartz T, Sutton AJ, Sweeting MJ, Buchan I, Matteson EL, Mon-
tori V: Anti-TNF antibody therapy in rheumatoid arthritis and
Figure 1
This plot illustrates the median and interquartile range for the tertiles of the claims-based index of rheumatoid arthritis severity (CIRAS)This plot illustrates the median and interquartile range for the tertiles of
the claims-based index of rheumatoid arthritis severity (CIRAS). These
values are plotted against the records-based index of rheumatoid arthri-
tis severity (RARBIS). The CIRAS exhibits a moderate linear correlation
with the RARBIS.
Available online />Page 9 of 9
(page number not for citation purposes)
the risk of serious infections and malignancies: systematic
review and meta-analysis of rare harmful effects in rand-
omized controlled trials. JAMA 2006, 295:2275-2285.
7. Geborek P, Bladström A, Turesson C, Gulfe A, Petersson IF,
Saxne T, Olsson H, Jacobsson LT: Tumour necrosis factor
blockers do not increase overall tumour risk in patients with
rheumatoid arthritis, but may be associated with an increased
risk of lymphomas. Ann Rheum Dis 2005, 64:699-703.
8. Jarand J, Zochodne DW, Martin LO, Voll C: Neurological compli-
cations of infliximab. J Rheumatol 2006, 33:1018-1020.
9. Mohan N, Edwards ET, Cupps TR, Oliverio PJ, Sandberg G, Cray-
ton H, Richert JR, Siegel JN: Demyelination occurring during
anti-tumor necrosis factor alpha therapy for inflammatory
arthritides. Arthritis Rheum 2001, 44:2862-2869.
10. Silman AJ, Petrie J, Hazleman B, Evans SJ: Lymphoproliferative
cancer and other malignancy in patients with rheumatoid
arthritis treated with azathioprine: a 20 year follow up study.
Ann Rheum Dis 1988, 47:988-992.
11. Brown SL, Greene MH, Gershon SK, Edwards ET, Braun MM:
Tumor necrosis factor antagonist therapy and lymphoma
development: twenty-six cases reported to the Food and Drug
Administration. Arthritis Rheum 2002, 46:3151-3158.
12. Walker AM: Confounding by indication. Epidemiology 1996,
7:335-336.
13. Setoguchi S, Solomon DH, Weinblatt ME, Katz JN, Avorn J, Glynn
RJ, Cook EF, Carney G, Schneeweiss S: Tumor necrosis factor
alpha antagonist use and cancer in patients with rheumatoid
arthritis. Arthritis Rheum 2006, 54:2757-2764.
14. Schneeweiss S, Setoguchi S, Weinblatt ME, Katz JN, Avorn J, Sax
PE, Levin R, Solomon DH: Anti-tumor necrosis factor alpha
therapy and the risk of serious bacterial infections in elderly
patients with rheumatoid arthritis. Arthritis Rheum 2007,
56:1754-1764.
15. Cabral D, Katz JN, Weinblatt ME, Ting G, Avorn J, Solomon DH:
Development and assessment of indicators of rheumatoid
arthritis severity: results of a Delphi panel. Arthritis Rheum
2005, 53:61-66.
16. Ting G, Schneeweiss S, Katz JN, Weinblatt ME, Cabral D, Scran-
ton RE, Solomon DH: Performance of a rheumatoid arthritis
records-based index of severity. J Rheumatol 2005,
32:1679-1687.
17. Sato M, Schneeweiss S, Scranton R, Katz JN, Weinblatt ME, Avorn
J, Ting G, Shadick NA, Solomon DH: The validity of a rheumatoid
arthritis medical records-based index of severity compared
with the DAS28. Arthritis Res Ther 2006, 8:R57.
18. Deyo RA, Cherkin DC, Ciol MA: Adapting a clinical comorbidity
index for use with ICD-9-CM administrative databases. J Clin
Epidemiol 1992, 45:613-619.
19. Poses RM, Smith WR, McClish DK, Anthony M: Controlling for
confounding by indication for treatment. Are administrative
data equivalent to clinical data? Med Care 1995, 33(Suppl
4AS36-46.
20. Rutledge R, Osler T: The ICD-9-based illness severity score: a
new model that outperforms both DRG and APR-DRG as pre-
dictors of survival and resource utilization. J Trauma 1998,
45:791-799.