Beginning Linux Programming Third Edition phần 6 pps
Bạn đang xem bản rút gọn của tài liệu. Xem và tải ngay bản đầy đủ của tài liệu tại đây (1.41 MB, 89 trang )
This directory is specific to Red Hat Linux. Other Linux distributions will use other directories, such as
/usr/src/packages.
Once we have gathered the sources for your RPM package, the next step is to create a spec file, the file
that describes to the
rpmbuild command exactly how to build our package.
Creating an RPM Spec File
Creating a spec file can be daunting, given that the RPM system supports thousands of options. Luckily,
the RPM system provides reasonable defaults for most options. You can follow the simple example in
this section, which should suffice for most packages you will build. In addition, you can copy com-
mands from other spec files.
Good sources for spec file examples are other RPM packages. Look at source RPMs, which are stored
in files ending in
.src.rpm. Install these RPMs and look through the spec files. You should find
more complicated examples than you will ever need. Interesting spec files include those for
anonftp,
telnet, vnc, and sendmail.
In addition, the designers of the RPM system wisely decided not to try to replace common build tools
such as
make or configure. The RPM system contains many shorthand features to take advantage of
makefiles and
configure scripts.
In this example, we will create a spec file for the simple
myapp application. Name your spec file
myapp.spec. Start the spec file with a set of definitions of the name, version number, and other
information about your package. For example,
Vendor: Wrox Press
Distribution: Any
Name: myapp
Version: 1.0
Release: 1
Packager:
License: Copyright 2003 by Wrox Press
Group: Applications/Media
This section of an RPM spec file is often called a preamble. In our preamble, the most important settings
are the
Name, Version, and Release. This example sets the name to myapp, the version number to 1.0,
and the release of the RPM package at
1, our first attempt at making an RPM package.
The
Group setting is used to help graphical installation programs sort the thousands of Linux applica-
tions by type. The
Distribution is important if you build a package just for one Linux distribution,
such as Red Hat or SuSE Linux.
Adding comments to your spec file is a good idea. Like shell scripts and makefiles, the
rpmbuild com-
mand treats any line starting with a
# character as a comment. For example,
# This line is a comment.
403
Development Tools
b544977 Ch09.qxd 12/1/03 8:56 AM Page 403
To help users decide whether to install your package, provide a Summary and a %description (note the
inconsistency in the RPM syntax, with a percent sign before description). For example, we can describe
our package as follows:
Summary: Trivial application
%description
MyApp Trivial Application
A trivial application used to demonstrate development tools.
This version pretends it requires MySQL at or above 3.23.
Authors: Neil Matthew and Richard Stones
The %description section can take up multiple lines (and normally should).
The spec file can contain dependency information, both what your package provides and what your
package depends on. (You can also define what the source package depends on, such as special header
files necessary for compiling.)
The
Provides setting defines what capabilities your system provides. For example,
Provides: goodness
This example states that our package provides the imaginary capability called goodness. The RPM sys-
tem will also automatically add a
Provides entry for the name of the package, myapp in our case. The
Provides settings are useful for multiple packages that may provide the same thing. For example, the
Apache Web server package provides the capability
webserver. Other packages, such as Thy, may also
provide the same capability. (To help deal with conflicting packages, RPM allows you to specify
Conflicts and Obsoletes information as well.)
The most important dependency information, though, is the
Requires settings. You can state all the
packages your package requires for operation. For example, a Web server requires networking and secu-
rity packages. In our example, we define a requirement for the MySQL database, at version 3.23 or
higher. The syntax for this follows:
Requires: mysql >= 3.23
If you only want to require the MySQL database, at any version, you can use a setting like the following:
Requires: mysql
RPM will prevent users from installing packages if the required packages are not also installed. (Users
can override this behavior, though.)
The RPM system will automatically add dependencies such as
/bin/sh for shell scripts, the Perl inter-
preter for Perl scripts, and any shared libraries (
.so files) your application calls. Each release of the RPM
system adds more smarts to the automatic dependency checks.
After you have defined the requirements, you need to define the sources that make up your application.
For most applications, you can simply copy the following setting:
source: %{name}-%{version}.tar.gz
404
Chapter 9
b544977 Ch09.qxd 12/1/03 8:56 AM Page 404
The %{name} syntax refers to an RPM macro, in this case, the name of the package. Since we previously
set the name to
myapp, the rpmbuild command will expand %{name} to myapp, and similarly expand
%{version} to 1.0, making for a file named myapp-1.0.tar.gz. The rpmbuild command will look for
this file in the
SOURCES directory described previously.
Our example sets up a
Buildroot, which defines a staging area to test the installation. You can copy the
following for your packages:
Buildroot: %{_tmppath}/%{name}-%{version}-root
Once a Buildroot is set up, install your applications to the Buildroot directory. You can use the handy
variable
$RPM_BUILD_ROOT, which is defined for all the shell scripts in the spec file.
After defining all these settings about the package, the next step is to define how to build the package.
There are four main sections for building:
%prep, %build, %install, and %clean.
As the name implies, the
%prep section is for preparing to build. In most cases, you can run the %setup
macro, shown here with a -q parameter to set it to quiet mode:
%prep
%setup -q
The %build section builds your application. In most cases, you can use a simple make command. For
example,
%build
make
This is one way that the RPM system takes advantage of the work you’ve already done in creating your
makefile.
The
%install section installs your application, any manual pages, and any support files. You can often
use the RPM macro
%makeinstall, which calls the install target of the makefile. In our case, though,
we can manually install the files to show more RPM macros:
%install
mkdir -p $RPM_BUILD_ROOT%{_bindir}
mkdir -p $RPM_BUILD_ROOT%{_mandir}
install -m755 myapp $RPM_BUILD_ROOT%{_bindir}/myapp
install -m755 myapp.1 $RPM_BUILD_ROOT%{_mandir}/myapp.1
This example creates the directories for the files, if needed, and then installs the myapp executable and
myapp.1 manual page. The $RPM_BUILD_ROOT environment variable holds the Buildroot location set
previously. The
%{_bindir} and %{_mandir} macros expand to the current binary directory and man-
ual page directory, respectively.
If you use a configure script to create the makefile, all the various directories get set properly into your
makefile. In most cases, you will not need to set up all the installation commands manually in the spec
file as shown in the previous example.
405
Development Tools
b544977 Ch09.qxd 12/1/03 8:56 AM Page 405
The %clean target cleans up the files created by the rpmbuild command. For example,
%clean
rm -rf $RPM_BUILD_ROOT
After specifying how to build the package, you need to define all the files that will be installed. RPM is
very rigid on this; it has to be rigid so that it can properly track every file from every package. The
%files section names the files to include in the package. In our case, we have only two files to distribute
in the binary package: the
myapp executable and myapp.1 manual page. For example,
%files
%{_bindir}/myapp
%{_mandir}/myapp.1
The RPM system can run scripts before and after your package is installed. For example, if your package
is a daemon process, you probably need to modify the system initialization scripts to start your daemon.
Do that with a
%post script. A simple example that merely sends an e-mail message follows:
%post
mail root -s “myapp installed - please register” </dev/null
Look for examples in server RPM spec files.
The complete spec file for our trivial application follows:
#
# spec file for package myapp (Version 1.0)
#
Vendor: Wrox Press
Distribution: Any
Name: myapp
Version: 1.0
Release: 1
Packager:
License: Copyright 2003 by Wrox Press
Group: Applications/Media
Provides: goodness
Requires: mysql >= 3.23
Buildroot: %{_tmppath}/%{name}-%{version}-root
source: %{name}-%{version}.tar.gz
Summary: Trivial application
%description
MyApp Trivial Application
A trivial application used to demonstrate development tools.
This version pretends it requires MySQL at or above 3.23.
Authors: Neil Matthew and Richard Stones
406
Chapter 9
b544977 Ch09.qxd 12/1/03 8:56 AM Page 406
%prep
%setup -q
%build
make
%install
mkdir -p $RPM_BUILD_ROOT%{_bindir}
mkdir -p $RPM_BUILD_ROOT%{_mandir}
install -m755 myapp $RPM_BUILD_ROOT%{_bindir}/myapp
install -m755 myapp.1 $RPM_BUILD_ROOT%{_mandir}/myapp.1
%clean
rm -rf $RPM_BUILD_ROOT
%post
mail root -s “myapp installed - please register” </dev/null
%files
%{_bindir}/myapp
%{_mandir}/myapp.1
We are now ready to build the RPM package.
Building an RPM Package with rpmbuild
Build packages with the rpmbuild command, which uses the following syntax:
rpmbuild -bBuildStage spec_file
The -b option tells rpmbuild to build an RPM. The extra BuildStage option is a special code that tells the
rpmbuild command how far to go when building. We list the options in the following table.
Option Usage
-ba Build all, both a binary and source RPM.
-bb Build a binary RPM.
-bc Build (compile) the program but do not make the full RPM.
-bp Prepare for building a binary RPM.
-bi Create a binary RPM and install it.
-bl Check the listing of files for the RPM.
-bs Build a source RPM only.
Older versions of the RPM system used the
rpm command to build packages in place of the rpmbuild
command. With the more recent RPM releases, though, the rpm command will no longer build RPM
packages. You must use the
rpmbuild command.
407
Development Tools
b544977 Ch09.qxd 12/1/03 8:56 AM Page 407
To build both a binary and a source RPM, use the -ba option. The source RPM allows you to recreate the
binary RPM.
The following shows the output from building our package:
$ rpmbuild -ba myapp.spec
Executing(%prep): /bin/sh -e /var/tmp/rpm-tmp.71108
+ umask 022
+ cd /usr/src/redhat/BUILD
+ LANG=C
+ export LANG
+ cd /usr/src/redhat/BUILD
+ rm -rf myapp-1.0
+ /usr/bin/gzip -dc /usr/src/redhat/SOURCES/myapp-1.0.tar.gz
+ tar -xf -
+ STATUS=0
+ ‘[‘ 0 -ne 0 ‘]’
+ cd myapp-1.0
++ /usr/bin/id -u
+ ‘[‘ 0 = 0 ‘]’
+ /bin/chown -Rhf root .
++ /usr/bin/id -u
+ ‘[‘ 0 = 0 ‘]’
+ /bin/chgrp -Rhf root .
+ /bin/chmod -Rf a+rX,g-w,o-w .
+ exit 0
Executing(%build): /bin/sh -e /var/tmp/rpm-tmp.43788
+ umask 022
+ cd /usr/src/redhat/BUILD
+ cd myapp-1.0
+ LANG=C
+ export LANG
+ make
gcc -g -Wall -ansi -c -o main.o main.c
gcc -g -Wall -ansi -c -o 2.o 2.c
ar rv mylib.a 2.o
a - 2.o
gcc -g -Wall -ansi -c -o 3.o 3.c
ar rv mylib.a 3.o
a - 3.o
gcc -o myapp main.o mylib.a
+ exit 0
Executing(%install): /bin/sh -e /var/tmp/rpm-tmp.90688
+ umask 022
+ cd /usr/src/redhat/BUILD
+ cd myapp-1.0
+ LANG=C
+ export LANG
+ mkdir -p /var/tmp/myapp-1.0-root/usr/bin
+ mkdir -p /var/tmp/myapp-1.0-root/usr/share/man
+ install -m755 myapp /var/tmp/myapp-1.0-root/usr/bin/myapp
408
Chapter 9
b544977 Ch09.qxd 12/1/03 8:56 AM Page 408
+ install -m755 myapp.1 /var/tmp/myapp-1.0-root/usr/share/man/myapp.1
+ /usr/lib/rpm/find-debuginfo.sh /usr/src/redhat/BUILD/myapp-1.0
extracting debug info from /var/tmp/myapp-1.0-root/usr/bin/myapp
1 block
+ /usr/lib/rpm/redhat/brp-compress
+ /usr/lib/rpm/redhat/brp-strip /usr/bin/strip
+ /usr/lib/rpm/redhat/brp-strip-static-archive /usr/bin/strip
+ /usr/lib/rpm/redhat/brp-strip-comment-note /usr/bin/strip /usr/bin/objdump
Processing files: myapp-1.0-1
Provides: goodness
Requires(interp): /bin/sh
Requires(rpmlib): rpmlib(CompressedFileNames) <= 3.0.4-1
rpmlib(PayloadFilesHavePrefix) <= 4.0-1
Requires(post): /bin/sh
Requires: libc.so.6 libc.so.6(GLIBC_2.0) mysql >= 3.23
Processing files: myapp-debuginfo-1.0-1
Requires(rpmlib): rpmlib(CompressedFileNames) <= 3.0.4-1
rpmlib(PayloadFilesHavePrefix) <= 4.0-1
Checking for unpackaged file(s): /usr/lib/rpm/check-files /var/tmp/myapp-1.0-root
Wrote: /usr/src/redhat/SRPMS/myapp-1.0-1.src.rpm
Wrote: /usr/src/redhat/RPMS/i386/myapp-1.0-1.i386.rpm
Wrote: /usr/src/redhat/RPMS/i386/myapp-debuginfo-1.0-1.i386.rpm
Executing(%clean): /bin/sh -e /var/tmp/rpm-tmp.17422
+ umask 022
+ cd /usr/src/redhat/BUILD
+ cd myapp-1.0
+ rm -rf /var/tmp/myapp-1.0-root
+ exit 0
When the build is complete, you should see two packages: the binary RPM in the RPMS directory, under
an architecture subdirectory such as
RPMS/i386, and a source RPM in SRPMS.
The binary RPM filename will appear something like the following:
myapp-1.0-1.i386.rpm
The architecture on your system may be different.
The source RPM filename will appear as follows:
myapp-1.0-1.src.rpm
You need to install packages as the superuser. You do not have to build packages as
root, so long as you have write access to the RPM directories, typically /usr/src/
redhat. Normally, you should not create RPM packages as root, since a spec file
could have commands that may damage your system.
409
Development Tools
b544977 Ch09.qxd 12/1/03 8:56 AM Page 409
Other Package Formats
Although RPM is fast becoming the most popular way of distributing applications in a way that allows
the user to control their installation, and deinstallation, there are competing packages out there. Some
software is still distributed as
gzipped tar files (tgz). Typically the installation steps consist of unpack-
ing the archive into a temporary directory and running a script to perform the actual installation.
The Debian Linux distributions (and some others) support another package format, similar in function-
ality to RPM, called
dpkg. The dpkg utility on Debian unpacks and installs package files that usually
have a
.deb extension. If you need to distribute an application using .deb file packages, it is possible to
convert an RPM package to
dpkg format using a utility called Alien. More details on Alien can be found
at
/>Development Environments
Almost all of the tools we have looked at so far in this chapter are essentially command line tools.
Developers that have experience with Windows will no doubt have some experience with integrated
development environments, or IDEs for short. IDEs are graphical environments that typically bring
together some or all of the tools needed to create, debug, and run an application. Usually, they provide
at least an editor, a file browser, and a method of running the application and capturing the output.
More complete environments add support for generating source code files from templates for certain
types of application, integration with a source code control system, and automatic documentation.
In this chapter, we will mention a few of the IDEs available for Linux today. These environments are
under active development, with the most advanced of them beginning to rival the quality of commercial
offerings.
xwpe
Way back in 1993 Fred Kruse developed a character-based file manager and text editor. It was small,
easy to use, and colorful. Its style mimicked the MS-DOS tools of the day. Many programmers appreci-
ated its speed and low demand on precious computer resources.
Called “Window Editor,” and invoked as
we, the editor is able to edit multiple files at once, search for
text, automatically indent source code, and print it. Later developments added support for executing
and debugging programs from within the editor. This version became the Window Programming
Environment (
wpe). Both we and wpe run on Linux, either using a character mode console or inside a
color xterm under the X Window System. Versions that run under X11 are also available as
xwe and xwpe
respectively. These versions retain all the function key–driven user interface of the originals.
Figure 9-2 shows
xwpe stepping through the execution of a simple program. As you can see, the editor
uses color to highlight the syntax of the C source code and the current state of execution.
Today, XWPE is being developed by Identical Software. You can find more details and download a
version for Linux at
/>410
Chapter 9
b544977 Ch09.qxd 12/1/03 8:56 AM Page 410
Figure 9-2
C-Forge
C-Forge is a commercial graphical IDE for C and C++ programs from Codeforge. There are a number of
versions available for Linux, including a freeware one, which has limited but still useful functionality.
C-Forge will generate a suitable makefile for projects and supports revision control using CVS so that
projects developed with it can be readily and easily maintained. Figure 9-3 shows a C-Forge project
under construction. You can download the free version of C-Forge from
/>411
Development Tools
b544977 Ch09.qxd 12/1/03 8:56 AM Page 411
Figure 9-3
KDevelop
KDevelop is an IDE for C and C++ programs. It includes particular support for the creation of applica-
tions to run under the K Desktop Environment (KDE), one of the two main graphical user interfaces on
Linux today. It can also be used for other project types, including simple C programs.
KDevelop is free software released under the terms of the GNU General Public License (GPL) and is
available with many Linux distributions. The latest version can be downloaded from
http://www.
kdevelop.org
. Projects created with KDevelop by default follow the standard for GNU projects.
For example, they will use the
autoconf utility to generate makefiles that are tailored to the environ-
ment for which they are being built. This means that the project is ready to be distributed as source
code that stands a good chance of being able to be compiled on other systems.
412
Chapter 9
b544977 Ch09.qxd 12/1/03 8:56 AM Page 412
KDevelop projects also contain templates for documentation, the GPL license text, and generic installation
instructions. The number of files that are generated when making a new KDevelop project can be daunt-
ing, but should be familiar to anyone who has downloaded and compiled a typical GPL application.
There is support with KDevelop for CVS source code control, and applications can be both edited and
debugged without leaving the environment. Figures 9-4 and 9-5 show the default KDevelop C applica-
tion (yet another Hello World! program) being edited and executed.
Figure 9-4
413
Development Tools
b544977 Ch09.qxd 12/1/03 8:56 AM Page 413
Figure 9-5
Other Environments
There are many other editors and IDEs either available for Linux or under development. The following
table’s list of links is not intended to be complete, but some of the developments may prove to be
interesting.
Enivronment Type Product URL
gbuilder An IDE for GNOME />Anjuta An IDE for GNOME
Klint An IDE for KDE />QtEZ An IDE for KDE />qtez/index.php
RHIDE A text mode IDE />CRiSP A commercial
programmer’s editor
SlickEdit A commercial multi-
/>language code editor
414
Chapter 9
b544977 Ch09.qxd 12/1/03 8:56 AM Page 414
Enivronment Type Product URL
Kylix A commercial IDE for
/>C++ and Delphi
Eclipse Java-based tool
platform and IDE
Summary
In this chapter, we’ve seen just a few of the Linux tools that make development and distribution of pro-
grams manageable. First, and perhaps most important, we used
make and makefiles to manage multiple
source files. We then looked at source code control with RCS and CVS, which lets us track changes as we
develop our code. We then covered program distribution with
patch, tar with gzip, and RPM pack-
ages. Finally, we took a look at some of the tools that make the edit-run-debug cycle of development a
little easier, the IDEs.
415
Development Tools
b544977 Ch09.qxd 12/1/03 8:56 AM Page 415
b544977 Ch09.qxd 12/1/03 8:56 AM Page 416
10
Debugging
Every significant piece of software will contain defects, typically two to five per 100 lines of code.
These mistakes lead to programs and libraries that don’t perform as required, often causing a pro-
gram to behave differently than it’s supposed to. Bug tracking, identification, and removal can
consume a large amount of a programmer’s time during software development.
In this chapter, we’ll look at software defects and consider some tools and techniques for tracking
down specific instances of erroneous behavior. This isn’t the same as testing (the task of verifying
the program’s operation in all possible conditions), although testing and debugging are, of course,
related, and many bugs are discovered during the testing process.
Topics we’ll cover include
❑ Types of errors
❑ General debugging techniques
❑ Debugging with GDB and other tools
❑ Assertions
❑ Memory use debugging
Types of Errors
A bug usually arises from one of a small number of causes, each of which suggests a method of
detection and removal:
❑ Specification Errors: If a program is incorrectly specified, it will inevitably fail to perform
as required. Even the best programmer in the world can sometimes write the wrong pro-
gram. Before you start programming (or designing), make sure that you know and under-
stand clearly what your program needs to do. You can detect and remove many (if not all)
specification errors by reviewing the requirements and agreeing that they are correct with
those who will use the program.
b544977 Ch10.qxd 12/1/03 8:56 AM Page 417
❑ Design Errors: Programs of any size need to be designed before they’re created. It’s not usually
enough to sit down at a computer keyboard, type source code directly, and expect the program
to work the first time. Take time to think about how you will construct the program, what data
structures you’ll need, and how they will be used. Try to work out the details in advance,
because it can save many rewrites later on.
❑ Coding Errors: Of course, everyone makes typing errors. Creating the source code from your
design is an imperfect process. This is where many bugs will creep in. When you’re faced with a
bug in a program, don’t overlook the possibility of simply rereading the source code or asking
someone else to. It’s surprising just how many bugs you can detect and remove by talking
through the implementation with someone else.
Try executing the core of the program on paper, a process sometimes called dry running. For the
most important routines, write down the values of inputs and calculate the outputs step by step.
You don’t always have to use a computer to debug, and sometimes it can be the computer caus-
ing the problems. Even the people who write libraries, compilers, and operating systems make
mistakes! On the other hand, don’t be too quick to blame the tools; it is more likely that there’s a
bug in a new program than in the compiler.
General Debugging Techniques
There are several distinct approaches to debugging and testing a typical Linux program. We generally
run the program and see what happens. If it doesn’t work, we need to decide what to do about it. We
can change the program and try again (code inspection, trial and error), we can try to gain more infor-
mation about what’s happening inside the program (instrumentation), or we can inspect the program
operation directly (controlled execution). The five stages of debugging are
❑ Testing: Finding out what defects or bugs exist
❑ Stabilization: Making the bugs reproducable
❑ Localization: Identifying the line(s) of code responsible
❑ Correction: Fixing the code
❑ Verification: Making sure the fix works
A Program with Bugs
Let’s look at an example program that contains bugs. During the course of this chapter, we’ll try to debug
it. The program was written during the development of a larger software system. Its purpose is to test a
single function,
sort, which is intended to implement a bubble sort algorithm on an array of structures of
Languages with compilers, such as C, have an advantage here in that syntax errors
can be caught at compile time, whereas interpreted languages such as the Linux shell
might detect syntax errors only when you try to run the program. If the problem is
with error-handling code, it might not be easy to spot in testing.
418
Chapter 10
b544977 Ch10.qxd 12/1/03 8:56 AM Page 418
type item. The items are sorted in ascending order of the member, key. The program calls sort on a sam-
ple array to test it. In the real world we would never seek to use this particular sort of algorithm, as it’s far
too inefficient. We have used it here because it is short, relatively simple to understand, and also easy to
get wrong. In fact, the standard C library has a function that performs the desired task already called
qsort.
Unfortunately, the code is not very readable, there are no comments, and the original programmer isn’t
available. We’ll have to struggle with it on our own, starting from the basic routine
debug1.c.
/* 1 */ typedef struct {
/* 2 */ char *data;
/* 3 */ int key;
/* 4 */ } item;
/* 5 */
/* 6 */ item array[] = {
/* 7 */ {“bill”, 3},
/* 8 */ {“neil”, 4},
/* 9 */ {“john”, 2},
/* 10 */ {“rick”, 5},
/* 11 */ {“alex”, 1},
/* 12 */ };
/* 13 */
/* 14 */ sort(a,n)
/* 15 */ item *a;
/* 16 */ {
/* 17 */ int i = 0, j = 0;
/* 18 */ int s = 1;
/* 19 */
/* 20 */ for(; i < n && s != 0; i++) {
/* 21 */ s = 0;
/* 22 */ for(j = 0; j < n; j++) {
/* 23 */ if(a[j].key > a[j+1].key) {
/* 24 */ item t = a[j];
/* 25 */ a[j] = a[j+1];
/* 26 */ a[j+1] = t;
/* 27 */ s++;
/* 28 */ }
/* 29 */ }
/* 30 */ n ;
/* 31 */ }
/* 32 */ }
/* 33 */
/* 34 */ main()
/* 35 */ {
/* 36 */ sort(array,5);
/* 37 */ }
Let’s try to compile this program:
$ cc -o debug1 debug1.c
It compiles successfully, with no reported errors or warnings.
419
Debugging
b544977 Ch10.qxd 12/1/03 8:56 AM Page 419
Before we run this program, we’ll add some code to print out the result. Otherwise, we won’t know
whether the program has worked. We will add some additional lines to display the array after it’s been
sorted. We call the new version
debug2.c.
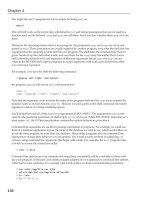
/* 34 */ main()
/* 35 */ {
/* 36 */ int i;
/* 37 */ sort(array,5);
/* 38 */ for(i = 0; i < 5; i++)
/* 39 */ printf(“array[%d] = {%s, %d}\n”,
/* 40 */ i, array[i].data, array[i].key);
/* 41 */ }
This additional code isn’t strictly part of the programmer’s remit. We’ve had to put it in just for testing.
We’ll have to be very careful that we don’t introduce further bugs in our test code. Now compile again
and, this time, run the program.
$ cc -o debug2 debug2.c
$ ./debug2
What happens when you do this will depend on your flavor of Linux (or UNIX) and on how it’s set up.
On one of the authors’ systems, we got
array[0] = {john, 2}
array[1] = {alex, 1}
array[2] = {(null), -1}
array[3] = {bill, 3}
array[4] = {neil, 4}
But on the other author’s system (running a different Linux kernel), we got
Segmentation fault
On your Linux system, you may see either of these outputs or a different result entirely. We expected
to see
array[0] = {alex, 1}
array[1] = {john, 2}
array[2] = {bill, 3}
array[3] = {neil, 4}
array[4] = {rick, 5}
Clearly there’s a serious problem with this code. If it runs at all, it’s failing to sort the array correctly, and
if it’s being terminated with a segmentation fault, the operating system is sending a signal to the pro-
gram saying that it has detected an illegal memory access and is prematurely terminating the program
to prevent memory from being corrupted.
The ability of the operating system to detect illegal memory access depends on its hardware configura-
tion and some subtleties of its memory management implementation. On most systems, the memory
420
Chapter 10
b544977 Ch10.qxd 12/1/03 8:56 AM Page 420
allocated to the program by the operating system is larger than the memory actually being used. If the
illegal memory access occurs in this region of memory, the hardware may not be able to detect the illegal
access. This is why not all versions of Linux and UNIX will generate a segmentation violation.
When you’re tracking down array access problems, it’s often a good idea to increase the size of array ele-
ments, as this increases the size of the error. If we read a single byte beyond the end of an array of bytes,
we may get away with it, as the memory allocated to the program will be rounded up to an operating
system–specific boundary, possibly as much as 8K.
If we increase the array element size, in this case by changing the
item member data to be an array of
4,096 characters, any access to a nonexistent array element will probably be to a memory location
beyond that allocated. Each element of the array is 4K in size, so the memory we use incorrectly will be
0–4K off the end.
If we do this, calling the result
debug3.c, we get a segmentation fault on both the authors’ flavors of
Linux.
/* 2 */ char data[4096];
$ cc -o debug3 debug3.c
$ ./debug3
Segmentation fault (core dumped)
It’s possible that some flavors of Linux or UNIX still won’t produce a segmentation fault. When the
ANSI C standard states that the behavior is undefined, it truly does allow the program to do anything.
It certainly looks like we have written a nonconforming C program here, and a nonconforming C pro-
gram may exhibit very strange behavior! As we will see, the fault does turn out to fall into the category
of undefined behavior.
Code Inspection
As we mentioned earlier, it’s often a good idea to reread your program when it fails to run as expected.
For the purposes of this chapter, let’s assume that the code has been reviewed and that obvious faults
have been dealt with.
There are tools that you can use to help with code reviews, the compiler being an obvious one. It will tell
you if you have any syntax errors in your program.
Code inspection is also a term for the more formal process of a group of developers
tracing through a few hundred lines of code in detail, but the scale really doesn’t
matter; it’s still code inspection and it’s still a very useful technique.
Some library functions, such as printf, will also prevent illegal accesses in some
special circumstances, such as using a null pointer.
421
Debugging
b544977 Ch10.qxd 12/1/03 8:56 AM Page 421
We’ll mention other tools, lint and Splint, a little later. Like the compiler, they analyze source code
and report on code that might be incorrect.
Instrumentation
Instrumentation is the adding of code to a program for the purpose of collecting more information about
the behavior of the program as it runs. It’s very common to add
printf calls, as we have done in our
example, to print out the values of variables at different stages in a program’s execution. We could use-
fully add several
printf calls, but we should be aware that the process entails an additional edit and
compile whenever the program is changed, and of course, we will need to remove the code when the
bugs are fixed.
There are two instrumentation techniques that can help here. The first uses the C preprocessor to selec-
tively include instrumentation code so that we only need to recompile the program to include or exclude
debugging code. We can do this quite simply with constructs such as
#ifdef DEBUG
printf(“variable x has value = %d\n”, x);
#endif
We can compile the program with the compiler flag -DDEBUG to define the DEBUG symbol and include
the extra code or without to exclude it. We can make more sophisticated use of a numeric debug macro,
like this:
#define BASIC_DEBUG 1
#define EXTRA_DEBUG 2
#define SUPER_DEBUG 4
#if (DEBUG & EXTRA_DEBUG)
printf
#endif
In this case, we must always define the DEBUG macro, but we can set it to represent a set of debug infor-
mation, or a level of detail. The compiler flag
-DDEBUG=5 would, in this case, enable BASIC_DEBUG and
SUPER_DEBUG, but not EXTRA_DEBUG. The flag -DDEBUG=0 would disable all debug information.
Alternatively, including the following lines eliminates the need to specify
DEBUG on the command line
in the case where no debugging is required:
Some compilers also have options to raise warnings on dubious practices, such as
failing to initialize variables and using assignments in conditions. For example, the
GNU compiler can be run with these options:
gcc -Wall -pedantic –ansi
They enable many warnings and additional checks for conformance to C standards.
We recommend that you get into the habit of using these options, Wall especially.
It can generate helpful information when tracking down program faults.
422
Chapter 10
b544977 Ch10.qxd 12/1/03 8:56 AM Page 422
#ifndef DEBUG
#define DEBUG 0
#endif
Several macros defined by the C preprocessor can help with debug information. These are macros that
expand to give information about the current compilation.
Macro Description
__LINE__ A decimal constant representing the current line number
__FILE__ A string representing the current file name
__DATE__ A string of the form “Mmm dd yyyy”, the current date
__TIME__ A string of the form “hh:mm:ss”, the current time
Note that these symbols are prefixed and suffixed by two underscores. This is common for standard pre-
processor symbols, and you should take care to avoid choosing symbols that might clash. The term current
in the above descriptions refers to the point at which the preprocessing is being performed, that is, the time
and date the compiler was run and the file processed.
Try It Out—Debug Information
Here’s a program, cinfo.c, that prints information about its compilation date and time if debugging is
enabled.
#include <stdio.h>
int main()
{
#ifdef DEBUG
printf(“Compiled: “ __DATE__ “ at “ __TIME__ “\n”);
printf(“This is line %d of file %s\n”, __LINE__, __FILE__);
#endif
printf(“hello world\n”);
exit(0);
}
When we compile this program with debug enabled (using -DDEBUG), we see the compilation information.
$ cc -o cinfo -DDEBUG cinfo.c
$ ./cinfo
Compiled: Mar 1 2003 at 18:17:32
This is line 7 of file cinfo.c
hello world
$
423
Debugging
b544977 Ch10.qxd 12/1/03 8:56 AM Page 423
How It Works
The C preprocessor part of the compiler keeps track of the current line and file when it’s compiling.
It substitutes the current (compile time) values of these variables whenever it encounters the symbols
__LINE__ and __FILE__. The date and time of compilation are made available similarly. Since
__DATE__ and __TIME__ are strings, we can concatenate them with format strings for printf
because ANSI C specifies that adjacent strings be treated as one.
Debugging without Recompiling
Before we move on, it’s worth mentioning that there’s a way of using the printf function to help with
debugging without using the
#ifdef DEBUG technique, which requires a program to be recompiled
before it can be used.
The method is to add a global variable as a debug flag, allow a
-d option at the command line, which
allows the user to switch debugging on even after the program has been released, and add a debug log-
ging function. Now you can intersperse things like this in the program code:
if (debug) {
sprintf(msg, )
write_debug(msg)
}
You should write debug output to stderr, or, if this isn’t practical because of the nature of the program,
use the logging facilities provided by the
syslog function.
If you add traces like this to solve problems during development, just leave the code in there. Provided
you use a small amount of care, this can be quite safe. The benefit comes when the program has been
released; if users encounter a problem, they can run it with debugging on and diagnose the errors for
you. Instead of reporting that the program gave the message
segmentation fault, they can also report
exactly what the program was doing at the time, not just what the user was doing. The difference can be
immense.
There is obviously a downside to this approach; the program is larger than it needs to be. In most cases,
this is more an apparent problem than a real one. The program will probably be 20 percent or 30 percent
larger, but in most cases this doesn’t have any real impact on performance. Poor performance comes
from increasing size by orders of magnitude, not by a mere doubling.
Controlled Execution
Let’s get back to the example program. We have a bug. We can modify the program by adding additional
code to print out the values of variables as the program runs, or we can use a debugger to control the
program’s execution and view its state as execution proceeds.
There are a number of debuggers available on commercial UNIX systems, depending on the vendor.
Common ones are
adb, sdb, and dbx. The more sophisticated ones allow us to look at the state of the
program in some detail at a source code level. This is true of
sdb, dbx, and also of the GNU debugger,
gdb, which can be used with Linux. There also exist “front ends” to gdb, which make it more user-
friendly;
xxgdb, tgdb, and ddd are such programs. Some IDEs, such as the ones we saw in Chapter 9,
424
Chapter 10
b544977 Ch10.qxd 12/1/03 8:56 AM Page 424
also provide debugging facilities or a front end to gdb. The Emacs editor also has a facility (gdb-mode)
that allows you to run
gdb on your program, set breakpoints, and see which line in the source code is
being executed.
To prepare a program for debugging, you need to compile it with one or more special compiler options.
These options instruct the compiler to include extra debugging information into the program. This infor-
mation includes symbols and line numbers—information the debugger can use to show the user where
in the source code execution has reached.
The
-g flag is the usual one used to compile a program for debugging. We must use it for compiling
each source file that needs to be debugged and also for the linker, so that special versions of the standard
C library can be used to provide debug support in library functions. The compiler program will pass the
flag to the linker automatically. Debugging can be used with libraries that aren’t compiled for the pur-
pose, but with less flexibility.
Debug information can make the executable many (up to ten) times larger. Even though the executable
may be larger (and take up more disk space) the amount of memory the program needs to run is effec-
tively the same. It is usually a good idea to remove debug information before you release your programs,
but only after they have been debugged.
Debugging with gdb
We’ll use the GNU debugger, gdb, to debug this program. It’s a very capable debugger that is freely
available and can be used on many UNIX platforms. It’s also the default debugger on Linux systems.
gdb has been ported to many other platforms and can be used to debug embedded real-time systems.
Starting gdb
Let’s recompile our example program for debugging and start gdb.
$ cc -g -o debug3 debug3.c
$ gdb debug3
GNU gdb 5.2.1
Copyright 2002 Free Software Foundation, Inc.
GDB is free software, covered by the GNU General Public License, and you are
welcome to change it and/or distribute copies of it under certain conditions.
Type “show copying” to see the conditions.
There is absolutely no warranty for GDB. Type “show warranty” for details.
This GDB was configured as “i586-suse-linux”
(gdb)
gdb has extensive online help and the complete manual is available as a set of files that can be viewed
with the
info program, or from within Emacs.
You can remove debug information from an executable file without recompiling by
running strip <file>.
425
Debugging
b544977 Ch10.qxd 12/1/03 8:56 AM Page 425
(gdb) help
List of classes of commands:
aliases — Aliases of other commands
breakpoints — Making program stop at certain points
data — Examining data
files — Specifying and examining files
internals — Maintenance commands
obscure — Obscure features
running — Running the program
stack — Examining the stack
status — Status inquiries
support — Support facilities
tracepoints — Tracing of program execution without stopping the program
user-defined — User-defined commands
Type “help” followed by a class name for a list of commands in that class.
Type “help” followed by command name for full documentation.
Command name abbreviations are allowed if unambiguous.
(gdb)
gdb is itself a text-based application, but it does provide a few short cuts to help with repetitive tasks.
Many versions have command-line editing with a history so that you can scroll back and execute the
same command again (try using the cursor keys). All versions support an “empty command”; hitting
Enter executes the last command again. This is especially useful when stepping through a program line
by line with the
step or next commands.
Running a Program
You can execute the program with the run command. Any arguments that you give to the run command
are passed to the program as its arguments. In this case, we don’t need any arguments.
We’ll assume here that your system, like both the authors’, is now generating a segmentation fault. If it
isn’t, read on. You’ll find out what to do when one of your own programs does generate a segmentation
violation. If you’re not getting a segmentation violation, but want to work though this example as you
read the book, you can pick up the program again at
debug4.c, when the first of the memory access
problems has been fixed.
(gdb) run
Starting program: /home/neil/BLP3/chapter10/debug3
Program received signal SIGSEGV, Segmentation fault.
0x080483c0 in sort (a=0x8049580, n=5) at debug3.c:23
23 /* 23 */ if(a[j].key > a[j+1].key) {
(gdb)
The program runs incorrectly as before. When the program faults, gdb shows us the reason and the loca-
tion. We can now investigate the underlying cause of the problem.
426
Chapter 10
b544977 Ch10.qxd 12/1/03 8:56 AM Page 426
Depending on your kernel, C library, and compiler version, you may see the program fault at a slightly
different place, for example, on line 25, when array items are exchanged, rather than line 23, when array
item keys are compared. If this is the case, you’ll see something like
Program received signal SIGSEGV, Segmentation fault.
0x8000613 in sort (a=0x8001764, n=5) at debug3.c:25
25 /* 25 */ a[j] = a[j+1];
You should still be able to follow the gdb sample session that follows.
Stack Trace
The program has been halted in the sort function at line 23 of the source file debug3.c. If we hadn’t
compiled the program with additional debug information (
cc -g), we wouldn’t be able to see where the
program had failed, nor would we be able to use variable names to examine data.
We can see how we got to this position by using the
backtrace command.
(gdb) backtrace
#0 0x080483c0 in sort (a=0x8049580, n=5) at debug3.c:23
#1 0x0804849b in main () at debug3.c:37
#2 0x400414f2 in __libc_start_main () from /lib/libc.so.6
(gdb)
This is a very simple program, and the trace is short because we haven’t called many functions from within
other functions. You can see that
sort was called from main at line 37 of the same file, debug3.c. Usually,
the problem is much more complex and we use
backtrace to discover the route we took to the error posi-
tion. This can be very useful when debugging functions that are called from many different places.
The
backtrace command may be abbreviated bt, and, for compatibility with other debuggers, the
where command has the same function.
Examining Variables
The information printed by gdb when it stopped the program and in the stack trace shows us the values
of function arguments.
The
sort function was called with a parameter, a, that has the value 0x8049580. This is the address of
the array. It will typically be different on different systems, depending on the compiler used and the
operating system.
The offending line, 23, is a comparison of one array element with another.
/* 23 */ if(a[j].key > a[j+1].key) {
We can use the debugger to examine the contents of function parameters, local variables, and global
data. The
print command shows us the contents of variables and other expressions.
(gdb) print j
$1 = 4
427
Debugging
b544977 Ch10.qxd 12/1/03 8:56 AM Page 427