Báo cáo y học: "Development and validation of the self-administered Fibromyalgia Assessment Status: a disease-specific composite measure for evaluating treatment effect" pptx
Bạn đang xem bản rút gọn của tài liệu. Xem và tải ngay bản đầy đủ của tài liệu tại đây (637.84 KB, 12 trang )
Open Access
Available online />Page 1 of 12
(page number not for citation purposes)
Vol 11 No 4
Research article
Development and validation of the self-administered
Fibromyalgia Assessment Status: a disease-specific composite
measure for evaluating treatment effect
Fausto Salaffi
1
, Piercarlo Sarzi-Puttini
2
, Rita Girolimetti
1
, Stefania Gasparini
1
, Fabiola Atzeni
2
and
Walter Grassi
1
1
Department of Rheumatology, Polytechnic University of the Marche Medical School, Via dei Colli 52, 60035 Jesi (Ancona), Italy
2
Rheumatology Unit, L. Sacco University Hospital, Via G.B. Grassi 74, 20127 Milan, Italy
Corresponding author: Fausto Salaffi,
Received: 22 Apr 2009 Revisions requested: 2 Jun 2009 Revisions received: 15 Jul 2009 Accepted: 18 Aug 2009 Published: 18 Aug 2009
Arthritis Research & Therapy 2009, 11:R125 (doi:10.1186/ar2792)
This article is online at: />© 2009 Salaffi et al.; licensee BioMed Central Ltd.
This is an open access article distributed under the terms of the Creative Commons Attribution License ( />),
which permits unrestricted use, distribution, and reproduction in any medium, provided the original work is properly cited.
Abstract
Introduction The Fibromyalgia Impact Questionnaire (FIQ) is a
composite disease-specific measure validated for fibromyalgia
(FM), but it is rarely used in clinical practice. The objective was
to develop and analyse the psychometric properties of a new
composite disease-specific index (Fibromyalgia Assessment
Status, FAS), a simple self-administered index that combines a
patient's assessment of fatigue, sleep disturbances and pain
evaluated on the basis of the 16 non-articular sites listed on the
Self-Assessment Pain Scale (SAPS) in a single measure (range
0 to 10).
Methods The FAS index was constructed using a traditional
development strategy, and its psychometric properties were
tested in 226 FM patients (209 women, 17 men); whose
disease-related characteristics were assessed by means of an
11-numbered circular numerical rating scale (NRS) for pain,
fatigue, sleep disturbances and general health (GH), the tender
point score (TPS), the SAPS, the FIQ, and the SF-36. A group
of 226 rheumatoid arthritis (RA) patients was used for
comparative purposes. Of the 179 FM patients who entered the
follow-up study, 152 completed the three-month period and
were included in the responsiveness analyses. One hundred
and fifty-four patients repeated the FAS questionnaire after an
interval of one week, and its test/re-test reliability was
calculated. Responsiveness was evaluated on the basis of effect
size and the standardised response mean.
Results The FAS index fulfilled the established criteria for
validity, reliability and responsiveness. Factor analysis showed
that SAPS and fatigue contributed most, and respectively
explained 47.4% and 31.2% of the variance; sleep explained
21.3%. Testing for internal consistency showed that
Cronbach's alpha was 0.781, thus indicating a high level of
reliability. As expected, closer significant correlations were
found when FAS was compared with total FIQ (rho = 0.347; P
< 0.0001) and the FIQ subscales, particularly job ability,
tiredness, fatigue and pain (all P < 0.0001), but the correlation
between FAS and the mental component summary scale score
(MCS) of the SF-36 (rho = -0.531; P < 0.0001) was particularly
interesting. Test/re-test reliability was satisfactory. The FAS
showed the greatest effect size. The magnitude of the
responsiveness measures was statistically different between
FAS (0.889) and the FIQ (0.781) (P = 0.038), and between the
SF-36 MCS (0.434) and the SF-36 physical component
summary scale score (PCS) (0.321) (P < 0.01).
Conclusions The self-administered FAS is a reliable, valid and
responsive disease-specific composite measure for assessing
treatment effect in patients with FM.
ACR: American College of Rheumatology; AUC: area under the curve; CCC: concordance correlation coefficients; CI: confidence interval; CVI: con-
tent validity index; DAS: Disease Activity Score; ES: effect size; FAS: Fibromyalgia Assessment Status; FIQ: Fibromyalgia Impact Questionnaire; FM:
Fibromyalgia; GH: general health; IMMPACT: Initiative on Methods, Measurement, and Pain Assessment in Clinical Trials; MCS: mental component
summary scale score; NRS: numerical rating scale; OMERACT: Outcome Measures in Rheumatology; PRO: patient-reported outcome; PCS: com-
ponent summary scale score; RA: rheumatoid arthritis; ROC: receiver operating characteristic; SAPS: Self-Assessment Pain Scale; SF-36: Short
Form 36 Health Survey; SRMs: standardised response means; TPS: tender point score.
Arthritis Research & Therapy Vol 11 No 4 Salaffi et al.
Page 2 of 12
(page number not for citation purposes)
Introduction
Fibromyalgia syndrome (FM) is a chronic multi-symptom dis-
ease [1-3], with pain as possibly its most important symptom.
It affects approximately 2 to 3% of the general population, and
more than 90% of the patients are female [4,5].
FM encompasses many symptoms, including fatigue, sleep
disturbances, psychological and cognitive alterations, head-
ache, migraine, variable bowel habits, diffuse abdominal pain,
and urinary frequency [1-3], which is why studies have used a
wide variety of outcome measures and assessment instru-
ments. However, outcome measures borrowed from clinical
research into pain, rheumatology, neurology, and psychiatry
can only distinguish treatment responses in specific symptom
domains, as has recently been highlighted by a systematic
review of FM clinical trials [6]. When evaluating the effective-
ness of FM therapy, it is important to be able to assess its
impact on all of the domains considered important by clini-
cians and patients [7,8], and the OMERACT (Outcome Meas-
ures in Rheumatology) Fibromyalgia Syndrome Workshop has
recently completed an attempt to include the patient perspec-
tive in identifying and prioritising such domains using focus
groups and Delphi exercises [1,8,9].
Given the multifaceted nature of FM and the new therapies
currently being tested [1-3], there is a need to refine these
measures further to develop a reliable and valid composite
patient-reported outcome (PRO) response measure that more
accurately assesses treatment effects [1]. The validity and
usefulness of PRO data in evaluating and monitoring patients
with rheumatic conditions have been clearly documented
[10,11]. PROs include physical function or disability, pain,
general health status, side effects, medical costs and other
factors, and instruments for measuring PROs are easier to
administer and less expensive than physician-observed dis-
ease activity and process measures.
A composite disease-specific measure has been validated for
FM. The Fibromyalgia Impact Questionnaire (FIQ), which was
developed by Burckhardt and colleagues [12], consists of
questions and visual analogue scales regarding functional dis-
ability, ability to have a job, pain intensity, sleep function, stiff-
ness, anxiety, depression, and the overall sense of well-being.
It has been shown to have a credible construct validity and reli-
able test/retest characteristics, and is sensitive in identifying
therapeutic changes [13]. However, it is rarely used in clinical
practice for a number of reasons, including its apparent lack of
relevance to clinicians and their unfamiliarity with it. However,
the most important reason for its lack of use seems to be the
perceived difficulty in administering and scoring it. Other prob-
lems have been noted with the FIQ, including that it may
underestimate disease impact and inadequately measure
treatment effect in patients with mild symptoms; furthermore,
it has not been validated in men [13].
The aim of this study was to develop and analyse the psycho-
metric properties of a new composite disease-specific index
for evaluating patients with FM, Fibromyalgia Assessment Sta-
tus (FAS), which includes domains/items considered relevant
by patients and doctors.
Materials and methods
Development of FAS
The development of a self-administered evaluation instrument
usually follows a series of major steps: a) the identification of
a specific patient population; b) the identification of important
efficacy domains; c) item reduction; and d) a validation study
to prove determination, reliability, validity, and responsiveness
[14-16]. The process therefore begins with the development
of an outcome domain pool and ends with one or more valida-
tion studies to establish test/retest reliability, construct validity,
and responsiveness.
Population identification
The aim of this study was to evaluate the disease-specific
symptoms of patients who satisfy the 1990 American College
of Rheumatology (ACR) classification criteria for FM [17].
Subjects with a diagnosis of anything other than chronic mus-
culoskeletal pain conditions were excluded, as were those
with medical comorbidities that would prevent them from par-
ticipating fully in the study procedures (e.g. terminal conditions
such as end-stage renal disease, heart failure, or malignancy),
alcohol abusers, or subjects with major cognitive deficits or
psychiatric symptoms that would preclude them from complet-
ing the questionnaire.
The study was approved by the Ethics Committees of the Pol-
ytechnic University of the Marche Medical School, and the
Sacco University Hospital, and all of the patients gave their
informed consent.
Identification of important efficacy domains
This is considered the most important step in the development
of a disease-specific evaluation instrument. The items were
generated in two phases [14,18]. The first consisted of a
review of the literature in order to identify the outcome meas-
ures adopted in FM clinical trials and the instruments used to
assess them. The publications were retrieved by means of a
comprehensive, computer-aided search of the Cochrane Cen-
tral Register of Controlled Trials, MEDLINE, CINAHL,
EMBASE, and PSYCINFO up to December 2008. A specific
search strategy was developed for each database using the
Cochrane methodological filter for randomised controlled tri-
als and MESH keywords, and other relevant terms such as
'fibromyalgia', 'chronic pain syndrome', 'health status', 'multi-
disciplinary', 'patient care team', 'back pain', all of which were
exploded when necessary. A manual search of the bibliogra-
phies of trials was also undertaken in order to check that all of
the published trials had been identified. The search strategy
led to the retrieval of 5431 articles, of which 409 were
Available online />Page 3 of 12
(page number not for citation purposes)
selected on the basis of their titles, abstracts and keywords.
After reading all of these abstracts, 134 full-text versions of the
articles were obtained, of which 41 were finally chosen.
Domain reduction
The need for domain reduction was driven by the impossible
task of carrying a large number of redundant outcome domains
through the subsequent validation study. It was therefore
decided to retain the 10 to 12 outcome domains that were the
most important to patients and representative of their health
status. In a first step, 20 potentially assessable domains in FM
were reviewed for relevance by a panel of 47 experts (21 rheu-
matologists, 5 orthopedic surgeons, 9 physiatricians, 3 algol-
ogists, 5 psychiatrists and 3 gynecologists) using Lynn's
process for content validation [19].
The second and most important step involved interviewing 87
FM patients (77 females and 10 males) attending the Rheuma-
tology Units of Ancona, which were selected in such a way as
to ensure that a wide spectrum of patient characteristics, dis-
ease severity and treatments would be elicited. The predomi-
nance of female subjects in the item generation sample was
comparable with the approximate 7 to 8:1 ratio in published
clinical trials. After signing an informed consent form, the
patients underwent a semi-structured interview conducted by
a research assistant with expertise in developing assessment
instruments.
This quantitative phase measured the proportion of experts or
patients who agreed that the items were relevant, as estab-
lished by a content validity index (CVI). Lynn [19] recom-
mended using a relevance rating scale that provides ordinal
level data by means of four Likert-like choices (4: extremely rel-
evant, extremely important; 3: very relevant, very important; 2:
somewhat relevant, somewhat important; 1: irrelevant, unim-
portant). Only the items rated 3 and 4 constitute the actual
CVI; the others should be eliminated. The CVI formula is: CVI
or percentage agreement = number of experts agreeing on
items rated as 3 or 4/total number of experts. The items were
considered as having adequate content validity if agreement
was 88% or more; those for which agreement was 70 to 87%
were considered questionable; and those with an agreement
of 69% or less were rejected. Tables 1 and 2 show the CVI
values for the individual items as expressed by the physicians
and patients.
A final three-item model (pain, fatigue, sleep disturbance) was
judged to have adequate validity (93 to 100% agreement
among the clinicians; 91 to 100% among the patients), and
constituted the FAS index. Three items (physical function,
depression, anxiety) rated at a level of questionable validity
were closely examined by the panel of experts and then elimi-
nated; the remaining four showed less than 69% agreement,
and were eliminated without further consideration.
Psychometric properties of FAS
The psychometric properties of the FAS index were studied in
an additional cohort of 226 patients aged 20 to 75 years, who
met the 1990 ACR classification criteria for FM [17] and gave
their informed consent. This validation study was divided into
Table 1
Content validity index values for the individual key domains identified by clinicians
Frequency Mean importance Frequency × importance product
Clinician-identified domains
1. Pain 100 3.9 390.0
2. Fatigue 99 3.7 366.3
3. Sleep quality 93 3.5 325.5
4. Patient global assessment 86 3.4 292.4
5. Physical function 84 3.3 277.2
6. Depression 80 3.2 256.0
7. Anxiety 77 3.3 254.1
8. Clinician global assessment 68 3.3 224.4
9. Quality of life 67 3.2 214.4
10. Occupational dysfunction 64 3.2 204.8
11. Social dysfunction 62 3.2 198.4
12. Cognitive impairment 57 3.2 182.4
Arthritis Research & Therapy Vol 11 No 4 Salaffi et al.
Page 4 of 12
(page number not for citation purposes)
two parts. The first part consisted of a cross-sectional study in
which all 226 patients were asked to answer several question-
naires and were examined by a physician who assessed pain
and other symptoms; 163 of these patients repeated the eval-
uation after an interval of one week in order to test its reliability.
For purposes of comparison, we also evaluated a sample of
226 patients meeting the ACR criteria for rheumatoid arthritis
(RA) [20], who were randomly matched from 469 RA patients
participating in an ongoing longitudinal outcome project and
reflected the age/gender-related stratification/distribution of
the FM sample, and underwent the same complete clinical
assessment with the fibromyalgia tender points assessment
but the FIQ was not administered [12,21]. They also com-
pleted the Medical Outcomes Study Short Form-36 Health
Survey (SF-36) [22,23].
The second part consisted of a three-month follow-up period
during which we assessed the sensitivity of the FAS to
changes in the 179 FM patients who had started a new phar-
macological treatment (muscle relaxants and antidepressants
were the most frequently used medications) or significantly
changed the dose of their existing treatment. One hundred
and fifty-two completed this part of the study; the other 27 did
not attend our outpatient clinic during this time and were
excluded from the analysis although retrospective data checks
revealed that they experienced the same disease course. The
study was performed in accordance with the principles of the
Declaration of Helsinki, and the protocols were approved by
our Ethics Committees.
Clinical assessment
The patients were administered a questionnaire including
questions relating to sociodemographic data, disease-related
variables and the quality of life. The sociodemographic varia-
bles were age, gender, education, marital status, and the dura-
tion of FM symptoms. Age and symptom duration were
recorded in years; education was divided into three categories
based on the Italian school system (1 = primary school, 2 =
secondary school, and 3 = high school or university); and mar-
ital status was divided into two categories (1 = living with a
partner; 0 = living alone). The assessment of comorbidities
included nine specific conditions: hypertension, myocardial
infarction, lower extremity arterial disease, major neurological
problems, diabetes, gastrointestinal disease, chronic respira-
tory disease, kidney disease, and poor vision.
Measurements and instruments
The disease-related characteristics included a patient 11-
numbered circular numerical rating scale (NRS) for pain [24],
fatigue, sleep disturbances, and general health (GH), the
tender point score (TPS), and the Self-assessment Pain Scale
(SAPS).
The NRS questions were: 'Please choose a number between
0 and 10 that best describes the average level of pain you
have experienced in the past week (0 = no pain; 10 = pain as
bad as it can be)'; 'What number between 0 and 10 best
describes the average level of fatigue you have experienced in
the past week (0 = no fatigue; 10 = fatigue as bad as it can
Table 2
Content validity index values for the individual key domains identified by patients with fibromyalgia
Frequency Mean importance Frequency × importance product
Patient-identified domains
1. Pain 100 3.8 380.0
2. Fatigue 98 3.8 372.4
3. Sleep quality 91 3.7 336.7
4. Physical function 84 3.5 294.0
8. Morning stiffness 79 3.5 276.5
5. Anxiety 76 3.3 250.8
6. Depression 72 3.4 244.8
8. Memory problems 64 3.6 230.4
9. Quality of life 62 3.5 217.0
10. Occupational dysfunction 59 3.4 200.6
11. Social dysfunction 57 3.2 182.4
12 Problems with attention or concentration 53 3.1 164.3
Available online />Page 5 of 12
(page number not for citation purposes)
be)?'; 'How much of a problem has sleep been in the past
week (0 = no problem; 10 = severe problem)?'; and 'How
would you describe your general health over the past week (0
= very good; 10 = very bad)?'.
The tender point examination was carried out by applying the
same manual finger pressure with a force of 4 kg (until blanch-
ing of the fingernail bed) to each of nine paired anatomical
locations The 18 FM tender point sites were: bilateral occiput,
low cervical, trapezius, supraspinatus, second rib, lateral epi-
condyle, gluteal, greater trochanter, and knee [1,17]. For a ten-
der point to be considered 'positive', the patient had to state
that the palpation was painful. Regular consensus meetings
concerning tender point assessments are part of our routine
quality control programme in order to avoid high between-phy-
sician variations, but no formal agreement analysis was made
for the purpose of this study. The TPS was the total number of
tender points.
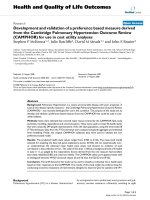
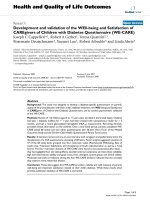
The SAPS considered the pain 'experienced during the past
week' in 16 non-articular sites as follows: 'Please indicate
below the amount of pain and/or tenderness you have experi-
enced in the last seven days in each of the body areas listed
below by putting an X in the boxes (see Figure 1). Please be
sure to mark both right and left sides separately'. Below these
instructions, a series of site descriptions were followed by four
boxes labelled 0 = none, 1 = mild, 2 = moderate, and 3 =
severe. The scale scores range from 0 to 48 but, in order to
integrate them into one scale they were transformed to a scale
of 0 to 10. We then calculated the FAS index, which is a short
and easy to complete self-administered index combining a set
of questions relating to non-articular pain (SAPS range 0 to
10), fatigue (range 0 to 10), and the quality of sleep (range 0
to 10) that provides a single composite measure of disease
activity ranging from 0 to 10. The final score is calculated by
adding the three sub-scores and dividing the result by three.
All three measures are printed on one side of one page for
rapid review, and scored by a health professional without the
need for a ruler, calculator, computer, or website (Figure 1).
Two quality of life questionnaires were also administered: the
specific self-administered FIQ [12] and the generic SF-36
[22]. The FIQ consists of 10 sub-items: the first includes 11
questions concern physical functioning, and each is rated
using a four-point Likert scale; items 2 and 3 ask the patient to
mark the number of days they felt well and the number of days
Figure 1
The self-administered Fibromyalgia Assessment Status (FAS)The self-administered Fibromyalgia Assessment Status (FAS).
Arthritis Research & Therapy Vol 11 No 4 Salaffi et al.
Page 6 of 12
(page number not for citation purposes)
they were unable to work (including housework) because of
FM symptoms; and items 4 to 10 are horizontal linear 10-incre-
ment scales by means of which the patients rate the number
of days on which they felt good, the number of working days
missed, ability to do their job, pain, fatigue, morning tiredness,
stiffness, anxiety, and depression [12]. Each item has a maxi-
mum score of 10, and so the highest possible score is 100
(the higher the score, the greater the impact of the syndrome
on the person). The Italian version of the FIQ has been previ-
ously validated [21].
The SF-36 is a general health questionnaire divided into eight
scales, each of which measures a different aspect of health
[22]. The sub-scale scores are then transformed into a 0 to
100 scale using a scoring algorithm, with higher scores indi-
cating a better quality of life. The SF-36 has been validated for
use in Italy [23], and can be completed by most people within
15 minutes. The creators of the SF-36 have also developed
algorithms to calculate two psychometrically based summary
measures: the physical component summary scale score
(PCS) and the mental component summary scale score
(MCS) [25].
Statistical analysis
Following standard guidelines for evaluating the properties of
composite measures, we tested the construct validity, test/
retest reliability, and responsiveness of the FAS index. Con-
struct validity was investigated in three ways. We first explored
the underlying component structure of the items by means of
exploratory factor analysis (principal component analysis)
using principal axis extraction and the varimax rotation method,
which maximises the independence of the factors. Principal
component analysis was chosen in order to reveal the dimen-
sionality of the score in the patient cohorts and investigate fac-
tor loading. An eigenvalue criterion of 1.0 was used to select
the factors, and the results are given in terms of the percent-
age variance in the scale score explained by the principal fac-
tor. As an indicator of internal consistency reliability, we
calculated Cronbach values (achievable values range from 0,
indicating no internal consistency, to 1, indicating identical
results), and Cronbach alpha values of more than 0.7 are com-
monly considered markers of a high degree of reliability. We
then examined convergent validity by correlating the scores of
the index with the other measures used in the study (the score
of a given scale is expected to converge with those of other
instruments targeting the same construct, and deviate from
those of other instruments assessing a different construct)
and quantifying these relationships using Spearman's rho cor-
relation coefficients. Thirdly, in order to investigate the possi-
ble influence of patient characteristics such as age, marital
status, education, and the number of comorbidities, the asso-
ciations between these and the FAS index were quantified
using Spearman's correlation coefficients, Wilcoxon's rank
sum test and Kruskal-Wallis one-way analysis of variance, with
the differences being considered significant when the P value
was less than 0.05. Discriminant validity was assessed by
means of receiver operating characteristic (ROC) curves and
by comparing the ability of the FAS index to distinguish the FM
and RA patients participating in the study. ROC curves were
plotted for each model in order to determine its area under the
curve (AUC), sensitivity and specificity, and then used to com-
pute the optimal cut-off value corresponding to the maximum
sum of sensitivity and specificity.
Wilcoxon's signed rank test and Fisher's exact test were
respectively used for the between-group comparisons of all
continuous and categorical variables. Test/retest reliability
embraces the concept that the repeated administration of a
measurement instrument to stable subjects will yield the same
results. After a one-week interval, the patients were asked by
the same investigator to repeat all of the clinical measures
without having access to any of the previous ratings. As it was
possible for a patient's condition to change during this period,
the subjects were concurrently administered a 'transitional'
global rating of change questionnaire in which they were
asked: 'How is your health now in comparison with when you
completed the health status questionnaire one week ago?'.
The possible response options were 'much better', 'slightly
better', 'no change', 'slightly worse', or 'much worse'. The sub-
jects who reported no change were considered stable and
those who reported a change were removed from the analysis.
Wilcoxon's signed rank test and concordance correlation
coefficients (CCC) with 95% confidence intervals (CI) of the
mean values were used to check for any significant systematic
differences in test/retest administration [26]. The agreements
between scores were also illustrated by Bland and Altman
plots, with a level of statistical significance of P < 0.05 (two-
sided). Responsiveness was tested using effect size (ES) and
standardised response means (SRMs) [27,28]. The change
due to intervention was assessed using Wilcoxon's non-para-
metric signed rank test, which has the advantage of being
robust to distributional assumptions. The chosen level of sig-
nificance was α = 0.05. ES is calculated as the mean change
in score from baseline divided by the standard deviation of the
baseline scores, whereas SRM is the mean change in score
between assessments divided by the standard deviation of
these changes. The 'modified jack-knife test' was used to test
whether the difference between two responsiveness meas-
ures was statistically significant. The data were processed and
analysed using SPSS software (Windows release 11.0;
SPSS Inc., Chicago, IL, USA), and MedCalc Software
®
(Win-
dows release 11.0.0, Mariakerke, Belgium).
Results
Study participants
The study involved 226 FM patients (209 women and 17 men)
with a mean age of 52.1 ± 10.8 years (range 20 to 75), a mean
duration of symptoms of 10.5 ± 9.7 years (range 1 to 28), a
mean TPS of 15.1 ± 2.4 (range 11 to 18), and a mean pain
Available online />Page 7 of 12
(page number not for citation purposes)
intensity of 6.8 ± 2.1 (range 2 to 10) as measured using an 11-
numbered circular NRS. Their educational level was generally
low: 41.2% had only attended a primary school, and only
17.9% had attended a high school. Sixty-five percent were liv-
ing with a partner. The most frequently reported comorbid con-
ditions were cardiovascular disorders (20.1%), metabolic
disorders (12.7%), chronic pulmonary disease (10.2%), and
gastrointestinal diseases (7.3%): 29.1% of the patients
reported one, and 19% two or more (range 2 to 5). The FM
patients reported significantly greater levels of fatigue (7.4 ±
4.3; P < 0.001) and sleep disturbance (6.9 ± 4.2; P < 0.001)
than the RA patients (206 women, 20 men), who were similar
in terms of age (mean age 56.1 ± 11.4 years, range 34 to 87),
education level and marital status. The arithmetic mean (stand-
ard deviation) of FAS was 6.34 (1.61) and the 95% CI of the
mean was 6.09 to 6.49.
Validity analysis
The construct validity of the FAS index was examined in terms
of convergence and discriminant validity. Factor analysis
showed that the index constitutes a monocomponent measure
in FM. SAPS and fatigue contributed most, and respectively
explained 47.46% and 31.23% of the explained variance;
sleep explained 21.29%. When testing internal consistency
reliability, we found that Cronbach's alpha was 0.781, which
indicates a high degree of reliability. As expected, the FAS
index had more significant correlations with total FIQ (rho =
0.347; P < 0.0001) and the FIQ sub-scales, particularly job
ability fatigue (rho = 0.534; P < 0.0001), fatigue (rho = 0.379;
P < 0.0001), morning tiredness (rho = 0.309; P < 0.0001),
and pain (rho = 0.303; P < 0.0001) (convergent construct
validity; Table 3). There were negative correlations with the
SF-36 as higher SF-36 scores indicate more and higher FAS
scores less well-being: the correlation between FAS and SF-
36 MCS (rho = -0.531; P < 0.0001; Table 4) was particularly
interesting, but the correlations with the SF-36 sub-scales and
summary measures were not as close as those between FAS
and the FIQ. The three component variables of FAS correlated
with each other moderately to highly, with the closest correla-
tion between NRS-fatigue and NRS-sleep (rho = 0.568; P <
0.0001). There were also close correlations between the TPS
and FAS (rho = 0.391; P < 0.0001), between the SAPS and
the SF-36 MCS (rho = -0.297; P < 0.0001), and between the
TPS and the SF-36 MCS (rho = -0.373; P < 0.0001). Women
tended to have higher FAS values than men (Wilcoxon's test:
W = -2.19; P = 0.022), but there were no significant gender
or age-related differences (four age-groups ranging from 20 to
34 years to 75 years). The respondents with a low educational
level were more often classified as having high levels of dis-
ease activity, and stratification into three categories confirmed
that increasing education was associated with lower FAS val-
ues: primary school = 7.2 ± 1.8; secondary school = 6.3 ±
1.5; high school/university = 5.5 ± 1.6; Kruskal-Wallis test: P
< 0.002). Furthermore, the patients with comorbid conditions
had worse disease activity scores (Kruskal-Wallis test: P <
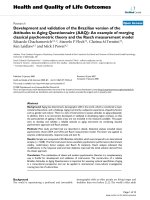
0.004). The ROC curve used to discriminate FM and RA
patients is shown in Figure 2. The discriminating power of the
FAS index was good, with an AUC of 0.872 (95% CI: 0.838
to 0.902). Each point of the ROC curve represents the true-
positive (or sensitivity) and false-positive ratios (or 1-specifi-
city) of a particular cut-off value, and may help in selecting the
optimal cut-off value for a new scale: i.e. assuming an optimal
FAS cut-off value of 5.7, sensitivity was 78.8% and specificity
74.5%. Higher cut-off values led to greater sensitivity but
lower specificity, whereas a cut-off value of 4.6 gave a sensi-
tivity of 58.7% with a specificity of 91.9%.
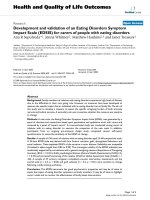
Reliability analysis
The reliability of the FAS index was evaluated in 163 patients
over a one-week period. Nine subjects were excluded
because they reported a change in health between the test
and retest. For the remaining 154 subjects, the mean interval
was 6.5 ± 1.5 days. The CCC of the index was 0.853 (95%
CI 0.803 to 0.858). Figure 3 shows the Bland and Altman plot
of repeatability: 95% of the differences against the means
were less than two standard deviations.
Responsiveness analysis
Table 5 shows the results of Wilcoxon's test, and the ES and
SMR statistics for the individual measures, FAS and the ques-
tionnaires in the FM sample. On the basis of the conventional
Figure 2
Fibromyalgia Assessment Status receiver operating characteristic curveFibromyalgia Assessment Status receiver operating characteristic
curve. The results of the sensitivity and specificity analyses of various
cut-off points for the composite index are summarised. We analysed
the ability of Fibromyalgia Assessment Status to identify patient popula-
tions: the greater the area under the curve (AUC), or the further the dis-
tance to the 'change line', the better its discriminant power. ROC =
receiver operating characteristic.
Arthritis Research & Therapy Vol 11 No 4 Salaffi et al.
Page 8 of 12
(page number not for citation purposes)
interpretation of ES, all of the measures improved significantly
during the three-month follow-up period. The greatest
improvements were found for FAS, and the smallest for TPS
and the SF-36 PCS and MCS component summary scores.
Within the generic SF-36 measure, the mental component
improved more than the physical component. The magnitude
of the responsiveness measures (assessed by means of the
individual ES) was statistically different between FAS (ES =
0.889) and the FIQ (ES = 0.781; P = 0.038), and between the
SF-36 MCS (ES = 0.434) and the SF-36 PCS (ES = 0.321;
P < 0.01). SRM tended to be lower than the ES, but followed
a similar pattern.
Discussion
One of the main problems in developing an efficacy claim for
FM is the lack of consensus concerning the response criteria
that should be used as primary outcome measures in clinical
trials, which means that further work is necessary to refine and
validate the existing measures, and develop new composite
measures or response criteria that better address the multidi-
mensional nature of the syndrome and can also be used in eve-
ryday clinical care [29-31]. The Disease Activity Score (DAS)
used in RA is a good example of an appropriate index,
because it has been shown to perform well in clinical research
and has also been implemented and accepted in clinical prac-
tice even though the DAS algorithm is rather complex [32,33].
In general, and referring to the OMERACT initiative, such indi-
ces should be truthful, discriminant, responsive, and feasible
[34]. To meet these aims, two approaches were combined.
First of all, the domains considered to be most relevant were
first consensually selected by experts and patients in order to
obtain a high face validity. Secondly, and following standard
guidelines for evaluating the properties of composite meas-
ures, we tested the construct validity, test/retest reliability and
responsiveness of the FAS index.
In line with the methodology adopted by OMERACT [2], we
conducted a Delphi exercise involving a panel of 47 experts to
develop consensus on a prioritised list of key domains of the
FM syndrome that should be addressed in clinical trials. A final
three-item model (pain, fatigue, sleep disturbance) was judged
Table 3
Convergent construct validity analysis: correlation matrix of overall Fibromyalgia Assessment Status scores and their components
vs the Fibromyalgia Impact Questionnaire dimensions
Physical
functioning
Number of
days felt
good
Number of
working
days
missed
Job
ability
Pain Fatigue Tiredness Stiffness Anxiety Depression Total
FIQ
Spearman's
rho
SAPS Correlation
coefficient
0.217(**) 0.195(**) 0.191(**) 0.145 (*) 0.271(**) 0.136(*) 0.147(*) 0.136(*) 0.260(**) 0.212(**) 0.193(**)
FATIGUE Correlation
coefficient
0.571(**) 0.482(**) 0.568(**) 0.568 (**) 0.663(**) 1.000(**) 0.568(**) 0.556(**) 0.411(**) 0.257(**) 0.804(**)
SLEEP Correlation
coefficient
0.424(**) 0.259(**) 0.397(**) 0.397 (**) 0.391(**) 0.568(**) 1.000(**) 0.379(**) 0.326(**) 0.256(**) 0.618(**)
FAS Correlation
coefficient
0.294(**) 0.251(**) 0.257(**) 0.534 (**) 0.303(**) 0.379(**) 0.309 (**) 0.147(*) 0.255(**) 0.217(**) 0.347(**)
** Correlation significant at 0.001 level (2-tailed).
* Correlation significant at 0.01 level (2-tailed).
FAS = Fibromyalgia Assessment Status; SAPS = Self-Assessment Pain Scale.
Table 4
Convergent construct validity analysis: correlation matrix of overall FAS scores and their components vs the SF-36 dimensions
Medical outcomes SF-36 health survey
PF RF BP GH VT SF RE MH PCS MCS
Spearman's
rho
SAPS Correlation
coefficient
-0.142 (*) -0.141 (*) -0.214 (**) -0.187 (**) -0.175 (*) -0.213 (**) -0.242 (**) -0.269 (**) -0.139 (*) -0.297 (**)
FATIGUE Correlation
coefficient
-0.143 (*) -0.297 (**) -0.451 (**) -0.189 (**) -0.670 (**) -0.270 (**) -0.327 (**) -0.306 (**) -0.342 (**) -0.401 (**)
SLEEP Correlation
coefficient
0.148 (*) 0.139 (*) -0.246 (**) -0.213 (**) -0.518 (**) 0.141 (*) -0.276 (**) -0.288 (**) 0.154 (*) -0.401 (**)
FAS Correlation
coefficient
-0.138 (*) -0.157 (*) -0.336 (**) -0.267 (*) -0.593 (**) -0.225 (**) -0.318 (**) -0.350 (**) -0.240 (**) -0.531 (**)
** Correlation significant at 0.001 level (2-tailed).
* Correlation significant at 0.01 level (2-tailed).
BP = bodily pain; FAS = Fibromyalgia Assessment Status; GH = perceived general health; MCS = mental component scale summary score; MH = mental health; PCS = physical component scale
summary score; PF = physical functioning; RE = role function/emotional aspect; RF = role function/physical aspect; SAPS = Self-Assessment Pain Scale; SF = social functioning; SF-36 = Short
Form 36 Health Survey; VT = vitality.
Available online />Page 9 of 12
(page number not for citation purposes)
to have adequate validity (93 to 100% agreement among the
clinicians; 91 to 100% among the patients), and constituted
the FAS index. It is interesting to note that patients rated stiff-
ness much higher than clinicians, as also occurred during the
OMERACT workshop consensus voting [2].
The data showed that the FAS index had good psychometric
properties as a multidimensional PRO instrument for FM that
is consistent with the recommendations of the OMERACT
Fibromyalgia Syndrome Workshop [1,9] and the IMMPACT
group (Initiative on Methods, Measurement, and Pain Assess-
ment in Clinical Trials) [35].
It does not include data concerning psychological distress,
change in status, ability to do a job, morning stiffness, or the
other constructs included in the FIQ [12]. The several reasons
for the lack of use and perceived difficulty in administering and
scoring the FIQ [13] persuaded us to develop simpler and
more easily scored patient questionnaires for use in standard
clinical care, which can be scanned by a clinician in 10 to 20
seconds or less, scored in less than 30 seconds, and which
provide information concerning the patients' perceived wide-
spread pain, average level of fatigue, and sleep disturbance all
on one side of one page.
When testing its internal construct validity, factor analysis
showed that the FAS index constitutes a monocomponent
measure in FM, in which SAPS (which represents the patients'
perception of widespread pain) accounts for 47.67% of the
explained variance, fatigue (the patients' average level of
fatigue during the previous week) 31.23%, and sleep distur-
bance 21.29%. This is in line with the findings of Staud and
colleagues, who demonstrated that peripheral factors (maxi-
mum average local pain and the markers of painful body areas)
predict most of the variance in overall clinical pain, and sug-
gested that pain input from peripheral tissues is clinically rele-
vant [36]. The SAPS questionnaire is one approach to
analysing the extent of body pain and evaluates pain intensity
and its non-articular regional speed.
The number of peripheral pain areas and peripheral pain inten-
sity are better predictors of overall FM pain than the TPS, and
this seems to indicate their pathogenetic relevance [37] and
Figure 3
Bland and Altman plot of repeatability, with the differences in Fibromy-algia Assessment Status values plotted against average valuesBland and Altman plot of repeatability, with the differences in Fibromy-
algia Assessment Status values plotted against average values. Ninety-
five percent of the differences against the means were less than two
standard deviations (SD; dotted lines).
Table 5
Indices of responsiveness after three months of follow-up in fibromyalgia patients
Mean change Wilcoxon's test P value Effect size Standardised response mean
Pain 5.141 5.653 < 0.0001 0.535 0.606
Fatigue 2.221 8.112 < 0.0001 0.787 0.778
Sleep 1.682 5.765 0.0008 0.698 0.518
Stiffness 1.864 5.785 0.0006 0.627 0.536
GH 0.941 6.882 < 0.0001 0.581 0.444
TPS 0.453 2.154 0.0312 0.191 0.151
SAPS 1.312 9.911 < 0.0001 0.713 0.722
FAS 1.431 10.015 < 0.0001 0.889 0.831
FIQ 14.194 8.184 < 0.0001 0.781 0.819
SF-36 PCS 2.594 -3.366 0.0006 0.321 0.285
SF-36 MCS 5.029 -4.412 < 0.0001 0.434 0.384
The greatest improvements were in Fibromyalgia Assessment Status (FAS), and the smallest in tender point score (TPS) and Short Form 36
Health Survey (SF-36) physical component scale summary score (PCS) and mental component scale summary score (MCS). FIQ = Fibromyalgia
Impact Questionnaire; GH = perceived general health; SAPS = Self-Assessment Pain Scale.
Arthritis Research & Therapy Vol 11 No 4 Salaffi et al.
Page 10 of 12
(page number not for citation purposes)
may explain why SAPS has good discriminant power. In com-
parison with RA, FM is mainly characterised by the different
nature of its pain. Simms and colleagues have shown that a
pain visual analogue scale is less discriminating than pain
measured with its regional component [30], and the fact that
SAPS integrates pain distribution and severity makes it a very
specific instrument for FM. In addition to being the cardinal
symptom of FM, pain is also one of the strongest predictors of
fatigue. Individuals with higher average pain levels report
greater fatigue, and daily increases in pain are related to daily
increases in fatigue, including those relating to the following
day [38].
The validity of the FAS index was also supported by its signif-
icant correlations with the TPS, the FIQ and its sub-scales,
and other self-reported generic measures such as physical
disability on the SF-36 PCS and emotional state on the SF-36
MCS [39]. The correlations between FAS and SF-36 MCS,
and between FAS and the anxiety/depression sub-scales of
the FIQ (all P < 0.0001) are particularly interesting. A number
of studies have highlighted the important contribution of local
pain and negative pain affect to clinical pain intensity, and this
underlines the multidimensional nature of clinical pain intensity
in FM patients [40,41], as well as the general population [42-
44]. Like other self-report instruments, the FAS index is sensi-
tive to psychosocial factors, which contribute to the pain and
physical impairment reported by patients. Furthermore, nega-
tive mood also seems to contribute to the persistence of
chronic widespread pain [45,46].
If emotional state markedly influences a patient's perception of
pain and physical health status, the resulting random measure-
ment error would restrict the validity of the FAS index or other
self-report questionnaires to relatively large studies but, when
we examined the affective correlates of fatigue and sleep
abnormalities, we found strong evidence that they were also
associated with negative affect (as shown by the anxiety/
depression sub-scales of the FIQ). These findings are only par-
tially consistent with previous studies of individual differences
in fatigue [47,48], although it has been found that FM patients
who report greater average fatigue also report more sleep
problems and higher levels of negative affect [38].
We also investigated the relations between FAS and the main
sociodemographic characteristics and comorbidities, and our
data show that there were no significant gender or age-related
differences, whereas respondents with a low educational level
were more often classified as having a high degree of disease
activity. It has been reported that years of formal education are
a risk factor for the presence of chronic pain in the community
[49,50]. Furthermore, Callahan and colleagues [51] found
education to be related to pain severity as measured by a sim-
ple visual analogue score. The mechanism by which education
influences pain severity is unclear, but it may be related to
enhanced self-efficacy and a sense of control allowing a
patient to take advantage of a greater number of pain-reducing
modalities. Furthermore, self-reported chronic pain or physical
dysfunctions may not only be due to musculoskeletal health,
but also to other prevalent causes of restricted mobility such
as cardiovascular and respiratory disorders, and our patients
with comorbidities had worse disease activity scores (P <
0.004). Bombardier and colleagues [52] found that SF-36
pain and physical function scores decreased as the number of
comorbidity factors increased. The pattern of the association
of chronic pain with sociodemographic factors is interesting,
and supports the findings of previous studies of chronic pain
[44,46,49,50], but it is not clear from our cross-sectional
research whether they reflect causes or effects. Wolfe and
Rasker [53] found that higher scores on the Symptom Inten-
sity scale are associated with more severe medical illness,
greater mortality and sociodemographic disadvantage, and
these factors also seem to play a role in the development of
FM-like symptoms and symptom intensification. Our study
equally cannot determine whether all of the demonstrated
impaired well-being was directly attributable to the presence
of chronic pain (because of the possibility of confounding var-
iables such as comorbidity or the fact that pain may be a sec-
ondary symptom of another condition such as ischemic heart
or digestive diseases) or chronic peripheral neuropathic pain.
One further limitation that has to be considered is our non-ran-
domised primary care sample. It can be assumed that the moti-
vation of patients who volunteer to take part in a study is
different from that of a random population, and they may have
a tendency to exaggerate self-perceived severity.
The repeatability of the FAS index was excellent, as shown by
the CCC, and the Bland-Altman plots showed that 95% of the
differences against the means were less than two standard
deviations. This has to be taken into account in clinical prac-
tice because the change in scores at individual level must
exceed the level of random error in order to reflect a real differ-
ence in health status.
The responsiveness of the FAS index was confirmed by the ES
and SRM statistics, whose conventional interpretation
showed that all of the measures had significantly improved
three months after starting treatment, with the greatest
improvements being found for FAS and the FIQ, and the small-
est for the TPS and the SF-36 PCS and MCS scores. The
mental component of the generic SF-36 measure improved
more than the physical component. The SRMs generally
yielded somewhat smaller numbers but did not change the
interpretation of the data. One final disadvantage of this study
is that no placebo group was included as a control, and it is
possible that the use of an open-label design may have
increased the differences before and after treatment.
Available online />Page 11 of 12
(page number not for citation purposes)
Conclusions
In conclusion, our findings suggest that the self-administered
FAS index is a valid, reliable, and responsive composite dis-
ease-specific measure for assessing treatment effects in
patients with FM that can be used in clinical trials and everyday
clinical practice. As the FAS index involves the use of only one
side of one page, it can be quickly reviewed by clinicians to
obtain a simple overview of patient status. Furthermore, it
should allow physicians to obtain reliable information concern-
ing the course of the disease, and be sensitive enough to raise
alarm in the case of deterioration. Its generalisability and use-
fulness in assessing treatment and long-term outcomes now
need to be evaluated in broader settings.
Competing interests
The authors declare that they have no competing interests.
Authors' contributions
FS contributed to the conception of the study, and the acqui-
sition, analysis and interpretation of the data, and participated
in drafting the manuscript. PSP contributed to the conception
of the study, and acquisition, analysis and interpretation of the
data, and participated in drafting the manuscript. RG partici-
pated in the analysis and interpretation of the data. SG con-
tributed to the acquisition of the data. FA contributed to the
interpretation of the data and critically reviewed the manu-
script. WG provided final approval of the version to be
published.
References
1. Mease P: Fibromyalgia syndrome: review of clinical presenta-
tion, pathogenesis, outcome measures, and treatment. J
Rheumatol Suppl 2005, 75:6-21.
2. Mease P, Arnold LM, Bennett R, Boonen A, Buskila D, Carville S,
Chappell A, Choy E, Clauw D, Dadabhoy D, Gendreau M, Golden-
berg D, Littlejohn G, Martin S, Perera P, Russell IJ, Simon L, Spa-
eth M, Williams D, Crofford L: Fibromyalgia syndrome. J
Rheumatol 2007, 34:1415-1425.
3. Bennett RM, Jones J, Turk DC, Russell J, Matallana L: An internet
survey of 2,596 people with fibromyalgia. BMC Musculoskele-
tal Disorders 2007, 8:27.
4. Wolfe F, Ross K, Anderson J, Russell IJ, Hebert L: The prevalence
and characteristics of fibromyalgia in the general population.
Arthritis Rheum 1995, 38:19-28.
5. Salaffi F, De Angelis R, Stancati A, Grassi W, MArche Pain; Prev-
alence INvestigation Group (MAPPING) study: Health-related
quality of life in multiple musculoskeletal conditions: a cross
sectional population based epidemiological study. II. The
MAPPING study. Clin Exp Rheumatol 2005, 23:829-839.
6. Carville SF, Choy EHS: Systematic review of discriminating
power of outcome measures used in clinical trials of
fibromyalgia. J Rheumatol 2008, 35:2094-2105.
7. Sarzi-Puttini P, Buskila D, Carrabba M, Doria A, Atzeni F: Treat-
ment strategy in fibromyalgia syndrome: where are we now?
Semin Arthritis Rheum 2008, 37:353-365.
8. Carville SF, Arendt-Nielsen S, Bliddal H, Blotman F, Branco JC,
Buskila D, Da Silva JA, Danneskiold-Samsøe B, Dincer F, Henriks-
son C, Henriksson KG, Kosek E, Longley K, McCarthy GM, Perrot
S, Puszczewicz M, Sarzi-Puttini P, Silman A, Späth M, Choy EH,
EULAR: EULAR evidence-based recommendations for the
management of fibromyalgia syndrome. Ann Rheum Dis 2008,
67:536-541.
9. Mease PJ, Arnold LM, Crofford LJ, Williams DA, Russell IJ, Hum-
phrey L, Abetz L, Martin SA: Identifying the clinical domains of
fibromyalgia: contributions from clinician and patient Delphi
exercises. Arthritis Rheum 2008, 59:952-960.
10. Pincus T, Maclean R, Yazici Y, Harrington JT: Quantitative meas-
urement of patient status in the regular care of patients with
rheumatic diseases over 25 years as a continuous quality
improvement activity, rather than traditional research. Clin Exp
Rheumatol 2007, 25(6 Suppl 47):69-81.
11. Levy G, Cheetham C, Cheatwood A, Burchette R: Validation of
patient-reported joint counts in reumatoid arthritis and the
role of training. J Rheumatol 2007, 34:1261-1265.
12. Burckhardt CS, Clark SR, Bennett RM: The Fibromyalgia Impact
Questionnaire: development and validation. J Rheumatol
1991, 18:728-733.
13. Bennett R: The Fibromyalgia Impact Questionnaire (FIQ): a
review of its development, current version, operating charac-
teristics and uses. Clin Exp Rheumatol 2005, 23(Suppl
39):S154-S162.
14. Kirshner B, Guyatt GH: Methodological framework for assess-
ing health indices. J Chron Dis 1985, 1:27-36.
15. Salaffi F, Bazzichi L, Stancati A, Neri R, Cazzato M, Consensi A,
Grassi W, Bombardieri S: Development of a functional disability
measurement tool to assess early arthritis: the Recent-Onset
Arthritis Disability (ROAD) questionnaire. Clin Exp Rheumatol
2005, 23:628-636.
16. Salaffi F, Silveri F, Stancati A, Grassi W: Development and vali-
dation of the osteoporosis prescreening risk assessment
(OPERA) tool to facilitate identification of women likely to have
low bone density. Clin Rheumatol 2005, 24:203-211.
17. Wolfe F, Smythe HA, Yunus MB, Bennett RM, Bombardier C,
Goldenberg DL, Tugwell P, Campbell SM, Abeles M, Clark P, Fam
AG, Farber SJ, Fiechtner JJ, Michael Franklin C, Gatter RA, Hamaty
D, Lessard J, Lichtbroun AS, Masi AT, Mccain GA, John Reynolds
W, Romano TJ, Russell IJ, Sheon RP: The American College of
Rheumatology 1990 criteria for the classification of fibromyal-
gia. Report of the Multicenter Criteria Committee. Arthritis
Rheum 1990, 33:160-172.
18. Kirkley A, Griffin S, McClintock J, Ng L: The development of a
disease specific quality of life measurement tool for shoulder
instability. Am J Sports Med 1998, 26:764-772.
19. Lynn MR: Determination and quantification of content validity.
Nurs Res 1986, 35:382-385.
20. Arnett FC, Edworthy SM, Bloch DA, McShane DJ, Fries JF, Cooper
NS, Healey LA, Kaplan SR, Liang MH, Luthra HS, Medsger TA Jr,
Mitchell DM, Neustadt DH, Pinals RS, Schaller JG, Sharp JT,
Wilder RL, Hunder GG: The American Rheumatism Association
1987 revised criteria for the classification of rheumatoid
arthritis. Arthritis Rheum 1988, 31:315-324.
21. Sarzi-Puttini P, Atzeni F, Fiorini T, Panni B, Randisi G, Turiel M, Car-
rabba M: Validation of an Italian version of the Fibromyalgia
Impact Questionnaire (FIQ-I). Clin Exp Rheumatol 2003,
21:459-464.
22. Ware J, Sherbourne CD: The MOS 36-item short form health
survey (SF-36). 1. Conceptual frame-work and item selection.
Med Care 1992, 30:473-481.
23. Apollone G, Mosconi P: The Italian SF-36 Health Survey: trans-
lation, validation and norming. J Clin Epidemiol 1998,
51:1025-1036.
24. Pincus T, Bergman M, Sokka T, Roth J, Swearingen C, Yazici Y:
Visual analog scales in formats other than a 10 centimeter
horizontal line to assess pain and other clinical data. J
Rheumatol 2008, 35:1550-1558.
25. Ware JE, Kosinski M: . Interpreting SF-36 summary health
measures: a response. Qual Life Res 2001, 10:405-413.
26. Lin LI-K: A concordance correlation coefficient to evaluate
reproducibility. Biometrics 1989, 45:255-268.
27. de Bruin AF, Diederiks JP, de Witte LP, Stevens FC, Philipsen H:
Assessing the responsiveness of a functional status measure:
the Sickness Impact Profile versus the SIP68. J Clin Epidemiol
1997, 50:529-540.
28. Steiner GL, Norman DR: Health measurement scales: a practi-
cal guide to their development and use. 2nd edition. Oxford:
Oxford University Press; 1996.
29. Hufford MR, Shiffman S: Methodological issues affecting the
value of patient-reported outcomes data. Expert Rev Pharmac
Outcomes Res 2002, 2:119-128.
Arthritis Research & Therapy Vol 11 No 4 Salaffi et al.
Page 12 of 12
(page number not for citation purposes)
30. Simms RW, Felson DT, Goldenberg DL: Development of prelim-
inary criteria for response to treatment in fibromyalgia
syndrome. J Rheumatol 1991, 18:1558-1563.
31. Dunkl PR, Taylor AG, McConnell GG, Alfano AP, Conaway MR:
Responsiveness of fibromyalgia clinical trial outcome
measures. J Rheumatol 2000, 27:2683-2691.
32. Heijde DM van der, van't Hof MA, van Riel PL, Theunisse LA, Lub-
berts EW, van Leeuwen MA, van Rijswijk MH, Putte LB van de:
Judging disease activity in clinical practice in rheumatoid
arthritis: first step in the development of a disease activity
score. Ann Rheum Dis 1990, 49:916-920.
33. van Gestel AM, Prevoo ML, van't Hof MA, van Rijswijk MH, Putte
LB van De, van Riel PL: Development and validation of the Euro-
pean league against rheumatism response criteria for rheu-
matoid arthritis. Comparison with the preliminary American
College of Rheumatology and the World Health Organization/
International League Against Rheumatism Criteria. Arthritis
Rheum 1996, 39:34-40.
34. Tugwell P, Boers M, Brooks P, Simon L, Strand V, Idzerda L:
OMERACT: an international initiative to improve outcome
measurement in rheumatology. Trials 2007, 8:38.
35. Turk DC, Dworkin RH, Allen RR, Bellamy N, Brandenburg N, Carr
DB, Cleeland C, Dionne R, Farrar JT, Galer BS, Hewitt DJ, Jadad
AR, Katz NP, Kramer LD, Manning DC, McCormick CG, McDer-
mott MP, McGrath P, Quessy S, Rappaport BA, Robinson JP,
Royal MA, Simon L, Stauffer JW, Stein W, Tollett J, Witter J: Core
outcome domains for chronic pain clinical trials: IMMPACT
recommendations. Pain 2003, 106:337-345.
36. Staud R, Vierck CJ, Robinson ME, Price DD: Overall fibromyalgia
pain is predicted by ratings of local pain and pain-related neg-
ative affect - possible role of peripheral tissues. Rheumatology
2006, 45:1409-1415.
37. Wolfe F: Pain extent and diagnosis: development and valida-
tion of the regional pain scale in 12,799 patients with rheu-
matic disease. J Rheumatol 2003, 30:369-378.
38. Zautra AJ, Fasman R, Parish BP, Davis MC: Daily fatigue in
women with osteoarthritis, rheumatoid arthritis, and
fibromyalgia. Pain 2007, 128:128-315.
39. Wolfe F: The relation between tender points and fibromyalgia
symptom variables: evidence that fibromyalgia is not a dis-
crete disorder in the clinic. Ann Rheum Dis 1997, 56:268-271.
40. Offenbacher M, Glatzeder K, Ackenheil M: Psychological dis-
tress and depression in male and female patients with
fibromyalgia. Arthritis Rheum 1998, 41:S255.
41. Geisser ME, Roth RS, Theisen ME, Robinson ME, Riley JL III: Neg-
ative affect, self-report of depressive symptoms, and clinical
depression: relation to the experience of chronic pain. Clin J
Pain 2000, 16:110-120.
42. Salaffi F, Stancati A, Grassi W: Reliability and validity of the Ital-
ian version of the Chronic Pain Grade questionnaire in patients
with musculoskeletal disorders. Clin Rheumatol 2006,
25:619-631.
43. Elliott AM, Smith BH, Penny KI, Smith WC, Chambers WA: The
epidemiology of chronic pain in the community. Lancet 1999,
354:1248-1252.
44. McBeth J, Macfarlane GJ, Hunt IM, Silman AJ: Risk factors for
persistent chronic widespread pain: a community-based
study. Rheumatology 2001, 40:95-101.
45. McBeth J, Macfarlane GJ, Benjamin S, Silman AJ: Features of
somatization predict the onset of chronic widespread pain:
results of a large population-based study. Arthritis Rheum
2001, 44:940-946.
46. Nicassio PM, Moxham EG, Schuman CE, Gevirtz RN: The contri-
bution of pain, reported sleep quality, and depressive symp-
toms to fatigue in fibromyalgia. Pain 2002, 100:271-279.
47. Schanberg LE, Gil KM, Anthony KK, Yow E, Rochon J: Pain, stiff-
ness, and fatigue in juvenile polyarticular arthritis. Arthritis
Rheum 2005, 52:1196-1204.
48. Goubert L, Crombez G, De Bourdeaudhuij I: Low back pain, dis-
ability and back pain myths in a community sample: preva-
lence and interrelationships. Eur J Pain 2004, 8:385-934.
49. Blyth FM, March LM, Brnabic AJ, Jorm LR, Williamson M, Cousins
MJ: Chronic pain in Australia: a prevalence study. Pain 2001,
89:127-134.
50. Rustøen T, Wahl AK, Hanestad BR, Lerdal A, Paul S, Miaskowski
C: Prevalence and characteristics of chronic pain in the gen-
eral Norwegian population. Eur J Pain
2004, 8:555-565.
51. Callahan LF, Smith WJ, Pincus T: Self-report questionnaires in
five rheumatic diseases. Arthritis Care Res 1989, 2:122-131.
52. Bombardier C, Melfi CA, Paul J, Green R, Hawker G, Wright J,
Coyte P: Comparison of a generic and a disease-specific
meaure of pain and physical function after knee replacement
surgery. Med Care 1995, 33:AS131-144.
53. Wolfe F, Rasker JJ: The Symptom Intensity Scale, fibromyalgia,
and the meaning of fibromyalgia-like symptoms. J Rheumatol
2006, 33:2291-2299.