New Concepts in Diabetes and Its Treatment - part 1 ppt
Bạn đang xem bản rút gọn của tài liệu. Xem và tải ngay bản đầy đủ của tài liệu tại đây (520.02 KB, 27 trang )
Belfiore F, Mogensen CE (eds): New Concepts in Diabetes and Its Treatment.
Basel, Karger, 2000, pp 1–2
Introduction
Diabetes mellitus and its complications are clinical conditions of growing
importance both from the clinical as well as epidemiological standpoint. The
relevance of diabetes at clinical and individual level is given by its life-
threatening acute complications and, especially, by its chronic complications
affecting several organs and systems, with increased risk for ocular, renal,
cardiac, cerebral, nervous and peripheral vascular diseases. The high preva-
lence of diabetes in many developed countries or in special ethnic groups,
entailing premature disability and mortality, points to its relevance at popula-
tion level. It is, therefore, mandatory for both the specialist and the practitioner
to be acquainted with the pathophysiological mechanisms, clinical manifesta-
tions and, above all, therapy of diabetes mellitus.
Recent data showing that control of hyperglycemia may prevent the onset
or slow down the progression of complications point to the importance of an
appropriate and efficacious treatment. Indeed, the aim of this book is to serve
as a tool to provide physicians with the latest views on diagnostic aspects and
pathophysiological mechanisms as a premise to go deep into the various facets
of the modern management of diabetes.
This book begins with introductory chapters on classification and clinical
aspects, after which an account is given of insulin secretion as modulated by
sulfonylureas and of insulin resistance (in its genetic and acquired components)
as modified by diet and the new lipase-inhibitory drug or by metformin (and
perhaps troglitazone agents). Insulin therapy of both type 1 and, when re-
quired, type 2 diabetes is adequately covered. This is followed by an integrated
view of metabolic control, including combined therapy and self-monitoring,
in the light of the lesson from DCCT (Diabetes Control and Complications
Trial) and UK-PDS (United Kingdom Prospective Diabetes Study).
1
The mechanisms of complications are treated as an introduction to the
understanding of possible therapeutic strategies. Then retinopathy, nephrop-
athy, hypertension and cardiovascular disease are considered in their clinical
aspects and therapeutic interventions. Extensive space is devoted to the various
neuropathic manifestations, including erectile dysfunction, as well as to the
foot problems. Final chapters highlight the need for multifactorial treatment
and the clinical and therapeutic problems of diabetic pregnancy.
The international panel of authors has made any effort to condense this
rich content into a relatively short text and to present it in a clear and smooth-
to-read form. While more extensive information may be found in larger treatises
(see Suggested Reading, below), we hope that this medium-size book will be
useful to all physicians interested in the management of diabetic patients by
providing them with a simple yet updated source of information concerning
the New Concepts in Diabetes and Its Treatment.
Francesco Belfiore
Carl Erik Mogensen
Suggested Reading
Alberti KGMM, Zimmet P, DeFronzo RA: International Textbook of Diabetes mellitus, ed 2. Chichester,
Wiley, 1999.
Belfiore F (ed): Frontiers in Diabetes. Basel, Karger, vol 8/1987, vol 9/1990, vol 10/1990, vol 11/1992,
vol 12/1993, vol 14/1998.
Bray G, Bouchard C, James WPT (eds): Handbook of Obesity. New York, Dekker, 1997.
Kakn CR, Weir GC (eds): Joslin’s Diabetes mellitus, ed 13. Malvern, Lea & Febiger, 1994.
Mogensen CE (ed): The Kidney and Hypertension in Diabetes mellitus, ed 5. Boston, Kluwer Academic,
2000.
Pickup JC, Williams G (eds): Textbook of Diabetes, ed 2. Oxford, Blackwell, 1997.
Porte D Jr, Sherwin RS (eds): Ellenberg and Rifkin’s Diabetes mellitus, ed 4, Amsterdam, Elsevier, 1990,
and ed 5, Old Tappan/NJ, Appleton & Lange, 1996.
2Introduction
Chapter I
Belfiore F, Mogensen CE (eds): New Concepts in Diabetes and Its Treatment.
Basel, Karger, 2000, pp 3–19
Etiological Classification,
Pathophysiology and Diagnosis
F. Belfiore, S. Iannello
Institute of Internal Medicine, University of Catania, Ospedale Garibaldi,
Catania, Italy
Introduction
According to the classical definition, diabetes mellitus is a disorder re-
sulting from both genetic predisposition and favoring environmental factors,
and is characterized by alterations in the metabolism of carbohydrate, fat and
protein, which are caused by a relative or absolute deficiency ofinsulinsecretion
and different levels of insulin resistance. In the patients with long-standing
diabetes, late complications develop consisting of alterations and failure of
various organs (especially the noninsulin-sensitive ones) including the eyes
(retinopathy with vision loss), kidneys (nephropathy leading to renal failure),
nerves (peripheral and autonomic neuropathy), heart and blood vessels (preco-
cious and severe cardiovascular, cerebrovascular and peripheral vascular ath-
erosclerosis). Diabetes mellitus includes etiologically and clinically different
diseases that have hyperglycemia in common, representing a syndrome rather
than a single disease.
Until 1997, the classification and diagnosis of diabetes were based on the
criteria developed by an international work group, sponsored by the National
Diabetes Data Group (NDDG) of the American National Institute of Health,
and published in 1979. The World Health Organization (WHO) Expert Com-
mittee on Diabetes in 1980 and the WHO Study Group on Diabetes mellitus
in 1985 adopted the recommendations of the NDDG with slight alterations.
In 1995, an International Expert Committee was established (sponsored by
the American Diabetes Association) with the aim to review the scientific
literature since 1979 andtodecide the adequate changes in the classification and
diagnostic criteria of diabetes. The committee work culminated in a document
3
published in 1997, divided into four sections (definition and description of
diabetes, classification of diabetes, diagnostic criteria and testing for diabetes),
which we summarize in this chapter.
Definition and Description of Diabetes mellitus
The basis of the metabolic alterations in diabetes is the reduction (to a
various degree) of insulin action on insulin-sensitive tissues, due to deficiency
of insulin secretion or to insulin resistance or both. The majority of cases of
diabetes mellitus falls into two major forms: type 1 and type 2 diabetes.
Type 1 Diabetes
Immune-Mediated Type 1 Diabetes
Type 1 diabetes (previously also named insulin-dependent diabetes mel-
litus – IDDM – or juvenile-onset diabetes) is an immune-mediated form of
diabetes, which accounts for approximately 5–10% of all diabetics in the West-
ern world. It occurs mainly in healthy nonobese children or young adults but
may also affect subjects at any age, and results from an absolute deficiency
of insulin secretion (evidenced by low or undetectable levels of plasma C-
peptide), caused by a cellular-mediated autoimmune destruction of pancreatic
-cells. Although the affected subjects are usually nonobese, the presence of
obesity is not incompatible with the diagnosis of type 1 diabetes. The course
may be rapid in children and young adults, slower in older patients. Adult
patients can retain for some time a residual -cell function while children and
adolescents often show early the effects of severe insulin lack, with a diabetes
appearing abruptly over days or weeks and rapidly progressing to acute life-
threatening complication (ketoacidotic coma), which may be the first mani-
festation of the disease, particularly in presence of precipitating factors such
as infections or other stress.
Genetic Predisposition. Type 1 diabetes is favored by a not yet fully under-
stood genetic predisposition, linked to the HLA system. Pedigree studies
of type 1 diabetes families have shown a low prevalence of direct vertical
transmission. However, the risk to develop the disease for children who are
first-degree relatives of type 1 diabetic patients is between 5 and 10%, the risk
being increased when there is haploidentity with the affected sibling and even
more when there is HLA identity. It has also been observed that the risk is
5-fold higher for children of a diabetic father compared to children of a diabetic
mother (sexual imprinting). Candidate genes for type 1 diabetes have been
4Belfiore/Iannello
suggested to occur in chromosomes 2, 6, 11 and 15. However, the major gene
seems to be located at the HLA locus in the chromosome 6. Indeed, it is now
largely accepted that type 1 diabetes is strongly associated to HLA system,
especially with the class II molecules which encode for the D allele. Patients
who express the DR3 or DR4 alleles or those who are heterozygous (DR3/
DR4) are especially susceptible to type 1 diabetes. Class I alleles (B8, B15) also
seem to be associated to type 1 diabetes as they show linkage disequilibrium, i.e.
show nonrandom association with the D alleles. Recently, great importance
has been attributed to the DQ locus. It has been shown that DQ1*0301 and
DQ1*0302 segregate with DR4 and that DQ1*0201 segregates with DR3.
Presence of DQ1*0201 and DQ1*0302 or, especially, the heterozygous state
DQ1*0201/0302 entails high risk. On the other hand, DQ1*0502 and
DQ1*0602 are associated with the DR2 haplotypes and would be protective.
Immunologic Mechanisms. Class II molecules are expressed by macro-
phages, endothelial cells and lymphocytes, and are required for the presentation
of an antigen to the regulatory T cells, which become activated, thus triggering
the immune response. In other words, the favoring HLA haplotypes indicated
above permit the interaction of environmental factors (such as certain viral
infections or chemical agents) with specific cell membrane components (the
HLA molecules), which results in the presentation of the antigen to the regu-
latory T lymphocytes, thus triggering an autoimmune mechanism. Several
viral infections have been suggested as favoring type 1 diabetes, including
Coxsackievirus infections, infectious mononucleosis, mumps, congenital ru-
bella, hepatitis and encephalomyocarditis. Some toxins have also been impli-
cated. Consumption of cow’s milk during the early life may be an important
environmental factor associated with type 1 diabetes development and, because
the role of bovine albumin in the induction of -cell autoimmunity have not
been confirmed, -casein has been suggested as the responsible protein. Virus,
toxins, or other factors may directly damage -cells or favor apoptosis (pro-
grammed cell death), or may expose cryptic antigen to the immune system,
or may act through molecular mimicry (exogenous molecules similar in amino
acid sequence to some endogenous molecules), or they may induce expression
of class II molecules in the -cells (which therefore would become antigen-
presenting cells, able to trigger the autoimmune response). An alternative
hypothesis which does not rely on exogenous antigen postulates a defective
removal of autoreactive T cells, which normally are destroyed in the thymus
in the early life. In contrast to the most common form of type 1 diabetes,
linked to environmental factors (formerly called type IA), in approximately
10% of all cases of type 1 diabetes (more frequently in females, with HLA-
DR3, from 30 to50 years of age), the disease is a primary autoimmune disorder
(previously called type IB) and is associated to other endocrine and nonendo-
5Etiological Classification, Pathophysiology and Diagnosis
crine autoimmune diseases (Grave’s disease, Hashimoto’s thyroiditis, Addison’s
disease, primary gonadal failure, vitiligo, pernicious anemia, connective tissue
disease, celiac disease, myasthenia gravis, etc.). This primary autoimmune
pathogenesis seems to be confirmed by a persistence of islet cell autoantibodies
(ICAs) forever. In 85–90% of patients, diabetes is early associated with one or
more serological genetic markers such as ICAs, IAAs (insulin autoantibodies),
GAD
65
(autoantibodies to glutamic acid decarboxylase) and IA-2 or IA-2
(autoantibodies to tyrosine phosphatase). These autoantibodies disappear over
the course of a few years in the majority of patients, and may be the result
rather than the cause of the autoimmune process.
Clinical Picture. Manifest type 1 diabetes is characterized by symptoms
linked to the marked hyperglycemia, such as polyuria (due to the osmotic
effect of glucose), polydipsia (to compensate for the water lost with polyuria),
polyphagia (to compensate for the energetic substrate glucose lost in the urine),
weight loss and fatigue (due to loss of glucose in urine and to dehydration),
andblurredvision (duetolens osmoticdisturbances).These patientsareinsulin-
dependent for their survival and prone to ketosis; impairment of growth,
susceptibility to certain infections, hypertension, lipoprotein metabolism al-
terations, periodontal disease and psychosocial dysfunctions are frequent.
Idiopathic Type 1 Diabetes
The idiopathic diabetes includes some forms of type 1 diabetes (common
in individuals of African and Asian origin) due to unknown etiology, with
strong genetic inheritance (not HLA-associated), without markers of autoim-
munity. There is severe deficit of insulin secretion and tendency to ketoacidosis,
with absolute requirement of insulin therapy.
Pathophysiology of Type 1 Diabetes
The pathophysiological changes occurring in type 1 diabetes as a con-
sequenceof thesevereinsulin deficiencymaybe better understoodbycomparing
the normal picture of the main metabolic pathways, as summarized in figure 1,
with the abnormal situation present in type 1 diabetes, outlined in figure 2 (see
also chapter III on Insulin Resistance). In type 1 diabetes, the deficit of insulin
and the prevalence of counterregulatory hormones, primarily glucagon, leads
to the activation of glycogenolysis and gluconeogenesis in liver, with ensuing
enhanced hepatic glucose output (HGO). In addition, the deficiency in insulin
action results inreduced glucoseutilization inperipheral insulinsensitivetissues
(primarilymuscle)aswellasinactivationoflipolysisintheadiposetissue(insulin
normallyexertsan antilipolyticeffect), withenhancedrelease of FFA.Thelatter,
although they cannotbe directly converted into glucose in man,favor gluconeo-
genesis inthe liver. Combination of enhancedHGO andreduced glucoseutiliza-
6Belfiore/Iannello
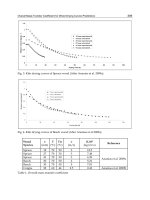
Fig. 1. Scheme showing the main metabolic pathways of intermediate metabolism in the
three insulin-sensitive tissues (liver, muscle and adipose tissue) participating in the metabolic
homeostasis. Note that most metabolic pathways are opposed to each other to form couples
composed of a ‘forward pathway’ and a ‘backward pathway’, thus allowing substrate cycling.
Examples are: glycogen synthesis and glycogenolysis (steps 1 and 2 in liver, 11 and 12 in
muscle), glycolysis and gluconeogenesis (steps 5 and 6), triglyceride synthesis and hydrolysis
(lipolysis) (steps 17 and 18 in adipose tissue; 26 and 27 in liver), protein synthesis and
proteolysis (steps 13 and 14), etc. Some cycles are ‘inter-tissular’, linking liver and muscle,
such as the Cori cycle (expanded to include alanine in addition to lactate and pyruvate),
composed of steps 10, 6, 3, 8 and 9, pertaining to carbohydrate metabolism, as well as the
cycle linking liver and adipose tissue (steps 19, 22, 26, 28 and 29), pertaining to lipid
metabolism. In the normal state, blood glucose is kept at the normal level through a balance
between hepatic glucose production (step 3) and glucose utilization by peripheral tissues,
mainly the muscle (step 8). VLDL and triglycerides are kept normal through a balance
between hepatic production (step 28) and peripheral degradation by LPL, primarily at
adipose tissue level (step 29). Ketones are not present because Ac-CoA is entirely oxidized
to CO
2
(or utilized for the synthesis of FFA – step 24).
tion results in hyperglycemia. In addition, FFA exert anti-insulin effects at the
muscle level, through the mechanism of the glucose-FFA cycle (Randle’s cycle),
which may cause resistance to the therapeutically administered insulin (see the
chapter on Insulin Resistance). It should also be considered that hyperglycemia
itself favors glucoseutilization (glucoseeffectiveness),perhapsbyacting onnon-
insulin-dependent glucose transporters (GLUT1 in gut, GLUT2 in liver and
GLUT3 in brain), and that in type 1 diabetes this glucose effect may be reduced,
i.e. there may be ‘glucose resistance’.
7Etiological Classification, Pathophysiology and Diagnosis
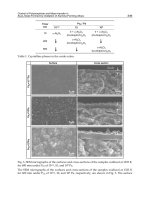
Fig. 2. Scheme of the main metabolic pathways (similar to that outlined in figure 1)
and of their changes in activity rate occurring in states of severe insulin deficiency, such as
decompensated type 1 diabetes (thick or thin arrows indicate increased or decreased activity,
respectively). Note the prevalence of the catabolic pathways over the anabolic ones: glyco-
genolysis over glycogen synthesis (steps 2 and 1 in liver, steps 12 and 11 in muscle), gluconeo-
genesis over glycolysis (steps 6 and 5), triglyceride hydrolysis or lipolysis over triglyceride
synthesis (steps 17 and 18), proteolysis over proteosynthesis (steps 14 and 13), etc. Concerning
the ‘inter-tissural’ cycles, note the prevalence of hepatic glucose production (step 3) over
glucose utilization (step 8), leading to glucose accumulation in blood (unnumbered arrow
starting from glucose). The enhanced hepatic glucose production (step 3), effected by the
enzyme glucose-6-Pase, utilizes glucose-6-P in part derived from glycogen (step 2) but mainly
formed through the gluconeogenic process (step 6) which in turn utilizes the gluconeogenic
precursors (pyruvate, lactate and alanine) coming from the muscle (step 10), where they are
mainly produced from amino acids (step 15) derived from the enhanced proteolysis (step
14). Note the overall process of conversion of protein to glucose (steps 14, 15, 10, 6 and 3),
and consider that some amount of the glucose-6-P formed through the gluconeogenic process
may be converted into glycogen (this latter conversion being favored by cortisol). With regard
to the FFA-VLDL cycle, linking liver and adipose tissue, note the enhanced FFA release
from adipose tissue (step 19), the enhanced afflux of FFA to muscle (step 20), where they
are oxidized (step 21) and oppose the oxidation of glucose-derived pyruvate (glucose-FFA
cycle, see the text), thus inducing insulin resistance. Note also the hyperafflux of FFA to the
liver, where they may be reesterified to triglycerides (step 26) or -oxidized to Ac-CoA
(step 23). The triglycerides so formed may be deposited in the hepatocytes (steatosis) or may
be incorporated into VLDL which are secreted into the circulation (step 28), leading to the
marked hypertriglyceridemia of the decompensated diabetes. The large amount of Ac-CoA
produced by -oxidation of FFA cannot be entirely oxidized in the Krebs cycle (also for the
relative deficiency of oxalacetate, which is diverted towards gluconeogenesis) and is converted
into ketone bodies (step 25) leading the ketoacidosis. Thus, in the diabetic state, blood glucose
is elevated because hepatic glucose production (step 3) prevails over glucose utilization
8Belfiore/Iannello
Type 2 Diabetes
Type 2 diabetes (previously also named non-insulin-dependent diabetes
mellitus – NIDDM – or adult-onset diabetes) occurs in approximately 90–95%
of diabetic people in the Western world, resulting from insulin resistance and
insufficient compensatory insulin secretion. The disease has an insidious onset
and remains asymptomatic and undiagnosed for a long period, even if the
moderate hyperglycemia is able to induce severe diabetic late complications.
Type 2 diabetes is strongly favored by genetic predisposition. However,
although it shows familial aggregation as well as a high concordance (80%)
in monozygotic twins, its mode of inheritance is not fully understood. It may
well be a polygenic disease. In any case, the risk of offspring and siblings of
type 2 diabetic patients to develop the disease is relatively elevated.
In addition to the genetic predisposition, favoring environmental factors
are involved, such as excessive caloric intake, obesity with increased body fat
in the abdominal (visceral) site, sedentary habit, etc. The insulin levels may
be normal or even increased (especially in presence of obesity) for a long time,
but may decrease in the late stage of the disease. The abnormal carbohydrate
metabolism can be early identified measuring fasting glycemia (FPG) or per-
forming an oral glucose tolerance test (OGTT). This type of diabetes is nonin-
sulin-dependent for survival and is nonketosis prone. Hyperglycemia is usually
improved or corrected by diet, weight loss and oral hypoglycemic drugs. In
type 2 diabetics an acute life-threatening complication, the nonketotic hyperos-
molar coma, can develop whereas ketoacidosis seldom occurs spontaneously,
although it may arise during stress, infections or other illnesses.
Pathophysiology of Type 2 Diabetes
This disease is due to a varying combination of insulin resistance and
reduction (especially in the late stage of the disease) in insulin secretion (see
chapter II on Insulin Secretion and chapter III on Insulin Resistance). The
metabolic alterations are less pronounced than those in type 1 diabetes, out-
lined in figure 2 (see also chapter III on Insulin Resistance). Due to insulin
resistance (and to enhanced counterregulatory hormones), there is increased
HGO (which contributes primarily to fasting hyperglycemia) and reduced
peripheral glucose utilization. There is also elevation of plasma FFA (resulting
from activation of lipolysis and/or the often enhanced fatmass due to coexisting
by peripheral tissues, mainly the muscle (step 8). VLDL and triglycerides are increased
because hepatic production (step 28) prevails over peripheral degradation by LPL, primarily
at the adipose tissue level (step 29). Ketones are formed at high rate (step 25) because the
large amount of Ac-CoA cannot be entirely oxidized to CO
2
.
9Etiological Classification, Pathophysiology and Diagnosis
obesity), which in turn contributes to insulin resistance through the mechanism
of the glucose-FFA cycle. As mentioned above (under Type 1 Diabetes), hyper-
glycemia itself favors glucose utilization (glucose effectiveness). This mecha-
nism may be impaired in type 2 diabetes, i.e. ‘glucose resistance’ may be
present. It has been observed that in obesity and type 2 diabetes (as well as
in acromegaly and Cushing’s disease), in the postabsorptive period, noninsulin-
mediated glucose uptake is a major determinant of glucose disposal and is
similar in the different pathologies studied. On the other hand, although
absolute rates of basal insulin-mediated glucose uptake are reduced in insulin-
resistant states, they do not achieve statistical value compared with control
subjects because of compensatory hyperinsulinemia.
Other Specific Types of Diabetes
Various, less common, types of diabetes are known to occur, in which the
secretory defect is based upon different mechanisms.
Genetic Defects of -Cell Function
The maturity-onset diabetes of the young (MODY) is a genetically hetero-
geneous monogenic form of noninsulin-dependent diabetes, characterized by
early onset, usually before 25 years of age and often in adolescence or child-
hood, and by autosomal dominant inheritance. There is no HLA association
nor evidence of cell-mediated autoimmunity. It has been estimated that 2–5%
of patients with type 2 diabetes may have this form of diabetes mellitus.
However, the frequency of MODY is probably underestimated. Clinical studies
have shown that prediabetic MODY subjects have normal insulin sensitivity
but suffer from a defect in glucose-stimulated insulin secretion, suggesting
that pancreatic -cell dysfunction, rather than insulin resistance, is the primary
defect in this disorder. To date, three MODY genes have been identified.
MODY-1. Studies in an affected family showed that the gene responsible
for MODY-1 is tightly linked to the adenosine deaminase gene on chromosome
20q. Further research has shown that responsible for MODY-1 is a mutation
in the gene-encoding hepatocyte nuclear factor (HNF)-4, a member of the
steroid/thyroid hormone receptor superfamily and an upstream regulator of
HNF-1 expression.
MODY-2. This form is due to mutations in glucokinase (GK – see chapter
II for the functional meaning of GK in -cells) and is associated with defects
in insulin secretion, reduction in hepatic glycogen synthesis and in the net
accumulation of hepatic glycogen as well as increased hepatic gluconeogenesis
following meals, resulting in impaired glucose tolerance or diabetes mellitus
10Belfiore/Iannello
characterized by mild chronic hyperglycemia. The hyperglycemia due to GK
deficiency is often mild (fewer than 50% of subjects have overt diabetes)
and is evident during the early years of life. Despite the long duration of
hyperglycemia, GK-deficient subjects have a low prevalence of micro- and
macrovascular complications of diabetes. Obesity, arterial hypertension and
dyslipidemia are also uncommon in this form of diabetes.
MODY-3. In several families, this form of MODY was found to be linked
with microsatellite markers on chromosome 12q. The disease was estimated to
be linkedto thischromosomeregion inapproximately 50%of familiesin a heter-
ogeneity analysis. It is the most common form of MODY. Affected patients ex-
hibit major hyperglycemia with a severe insulin secretory defect, suggesting that
the causal gene is implicated in pancreatic -cell function. MODY-3 was further
shown to be due to mutations in the gene-encoding HNF-1 (which is encoded
by the gene TCF1). HNF-1 is a transcription factor that helps in the tissue-
specific regulation of the expression of several liver genes and also functions as
a weak transactivator of the rat insulin-I gene.
Familial Hyperinsulinemia. The high-affinity sulfonylurea receptor, a novel
member of the ATP-binding cassette superfamily, is one component of the
ATP-sensitive K
+
channel. The protein is critical for regulation of insulin
secretion from pancreatic -cells, and mutations in the receptor (or in the K
ATP
channels) have been linked to familial hyperinsulinemia, a disorder character-
ized by unregulated insulin release despite severe hypoglycemia. Other forms
may be due to mutation in the GK gene, leading to a hyperresponsive enzyme.
Other. In addition, a diabetes type associated with deafness may be linked
to point mutations in mitochondrial DNA, and still other forms with less
clearly defined defects are known to occur. In about 50% of cases of MODY,
the genetic background is uncertain. It should be stressed that the role of the
above genes (responsible for -cell dysfunction) in the susceptibility to the
more common late-onset form of type 2 diabetes remains uncertain. Genetic
studies seem to exclude any function as major susceptibility genes, although
they might play a minor role in a polygenic context or a major role in particular
populations.
Rare Genetic Defects of Insulin Action
These are aheterogeneous group of rare conditions whichincludes: (a) syn-
dromes associated with acanthosis nigricans, which is a brown to almost black
hyperpigmentation of the skin, most often located in the neck, axilla, groin
or other areas, less rare in Blacks or in subjects of Hispanic origin. The affected
patients show high insulin levels. Some cases are due to mutation in the insulin
receptor resulting in diminished tyrosine-kinase activity (type A syndrome).
Others are due to antibodies to the insulin receptors which prevent insulin
11Etiological Classification, Pathophysiology and Diagnosis
binding (type B syndrome). Interestingly, some cases have been reported in
which antibodies to the receptor exert an agonistic effect, producing hypoglyce-
mia. (b) Generalized or partial (face and trunk) lipodystrophies, which may
be congenital or acquired, are characterized by fat depletion, and result from
decrease in the number or affinity of the receptor for insulin or from postrecep-
tor defects. Patients show high insulin levels, hyperglycemia (without ketoac-
idosis for the scarcity of fat), hypertriglyceridemia (with eruptive xanthomas),
enlargement of liver, spleen, heart, and hypertrophy of external genitalia.
Lymphadenopathy and hirsutism may also occur as well as varicose veins,
mental retardation and kidney involvement. In the congenital form, there is
also muscle hypertrophy. (c) Leprechaunism syndrome, due to mutation in
insulin receptors (which may be altered in both the and subunits and
whose expression in the cell membrane is markedly reduced), and consisting
of insulin resistance associated with severe growth retardation, elfin appearance
of the face, hirsutism, absence of subcutaneous fat and thickened skin.
(d) Other rare conditions such as the Werner’s syndrome, the Alstro
¨
m syn-
drome, the Rabson-Mendenhall syndrome (which may be associated with
acanthosis nigricans), the pineal hypertrophy syndrome, and the ataxia telan-
giectasia syndrome.
Diseases of the Exocrine Pancreas
Any disease process affecting the pancreas may involve the islets and pro-
duce diabetes (table 1). May we recall the fibrocalculous pancreatopathy, that
occurs in India, Africa and West Indies with a frequency similar to that of type
2 diabetes. This form involves young people with malnutrition and pancreatic
calculi, and is characterized by severe hyperglycemia and insulin dependence
but not by proneness to ketosis, as a moderate insulin secretion is retained.
Gestational Diabetes mellitus (GDM)
GDM is defined as any degree of glucose intolerance with onset during
pregnancy.It should be distinguished by the mild deterioration of glucose toler-
ance which may occur also during normal pregnancy (particularly in the 3rd
trimester). The prevalence of GDM can range from 2 to 3% of pregnancies,
depending on the different racial/ethnic subpopulations studied. A known dia-
betic woman who becomes pregnant is not classified as GDM. The GDM is a
serious problem and its recognition is important to prevent the associated peri-
natal morbidity or mortality and the maternal complications (cesarean delivery
and chronic hypertension). GDM usually returns to a normal glucose tolerance
state after delivery, but 60% of affected women can develop diabetes within 15
12Belfiore/Iannello
Table 1. Etiologic classification of diabetes mellitus
1. Type 1 diabetes
A. Immune-mediated
B. Idiopathic
2. Type 2 diabetes
3. Other specific types
A. Genetic defects of-cellfunction(MODY-1, MODY-2, MODY-3,mitochondrialDNA,
and others)
B. Genetic defects in insulinaction(typeAinsulinresistance, leprechaunism,Rabson-Men-
denhall syndrome, lipoatrophic diabetes, and others)
C. Diseases of the exocrine pancreas (pancreatitis, pancreatectomy, trauma, neoplasia,
cystic fibrosis, hemochromatosis, fibrocalculous pancreatopathy, and others)
D. Endocrinopathies (acromegaly, Cushing’s syndrome, glucagonoma, pheochromocy-
toma, hyperthyroidism, somatostatinoma, aldosteronoma, and others)
E. Drug- orchemical-induceddiabetes(vacor,pentamidine, nicotinic acid, glucocorticoids,
thyroid hormone, diazoxide, -adrenergic agonists, thiazides, dilantin, -interferon, and
others)
F. Infections (congenital rubella, cytomegalovirus, and others)
G. Uncommon forms of immune-mediated diabetes (‘stiff-man’ syndrome, anti-insulin re-
ceptor antibodies, and others)
H. Other genetic syndromes sometimes associated with diabetes (Down’s syndrome, Kline-
felter’s syndrome, Turner’s syndrome, Wolfram’s syndrome, Friedreich’s ataxia, Hun-
tington’s chorea, Lawrence-Moon-Biedl syndrome, myotonic dystrophy, porphyria,
Prader-Willi syndrome, and others)
4. Gestational diabetes mellitus (GDM)
years after parturition. About 6 weeks after the delivery, the GDM woman
should be reclassified as diabetic or glucose intolerant or normoglycemic.
Comment
In the previous NDDG/WHO classification, diabetes mellitus was divided
into 5 distinct types: IDDM, NIDDM, GDM (gestational diabetes), malnutri-
tion-related diabetes andother types, andthe category ofIGT(impaired glucose
tolerance) was included, in which plasma glycemia during an OGTT was above
normal but not diabetic. The 1997 Expert Committee changed the NDDG/
WHO classification, including only 4 clinical classes: (1) type 1 diabetes, (2) type
2 diabetes, (3) other specific types and (4) GDM (table 1). The most important
changes introduced include the following: (a) Elimination of the terms ‘insulin-
dependent’ or ‘noninsulin-dependent’ diabetes mellitus and ‘IDDM’ or
13Etiological Classification, Pathophysiology and Diagnosis
‘NIDDM’ (which are confusing as they classified the patient according to treat-
ment rather than etiology). (b) Preservation of the terms ‘type 1’ or ‘type 2’
diabetes (with Arabic numerals) and elimination of the confusing terms ‘type
I’ or ‘type II’ diabetes (with Roman numerals); patients with no evidence of
autoimmunity are classified as being affected by type 1 idiopathic diabetes.
(c) Type 1 diabetes does not include those forms of -cell destruction due to
nonautoimmune-specific causes. (d) Type 2 diabetes includes the most common
form characterized by insulin resistance and insulin secretory defect. (e) The
class previously named malnutrition-related diabetes mellitus has been elimi-
nated. (f) The IGT stage has been retained, and the stage of IFG was added.
(g) GDM, as defined by WHO and NDDG, was retained.
Diagnostic Criteria for Diabetes mellitus
A precocious diagnosis of diabetes is important to prevent or attenuate
late diabetic complication, and depends upon the adequate use and interpreta-
tion of laboratory tests (especially in absence of specific symptoms). Many
different diagnostic schemes have been in use. Recently, on the basis of the
available data, the diagnostic criteria previously recommended by NDDG or
WHO were modified. According to the revised criteria by the Expert Commit-
tee [1997], the ‘normal values’ and the ‘diagnostic values’ for diabetes (which
do not coincide with the goals of therapy) are as follows (values given in the
text refer to venous plasma glucose which is the preferred measurement;
equivalents for whole blood and capillary glucose estimations, according to
the IDF guidelines [1999] to type 2 diabetes, are indicated in footnotes).
Normal Values. The upper limit of normal venous plasma values has been
set at 110 mg/dl (6.1 mmol/l) for FPG and at 140 mg/dl (7.8 mmol/l) for the
2-hour value after glucose load (OGTT).
Diagnostic Values. (a) FPG P126 mg/dl (or 7.0 mmol/l)
1
after a fasting of
at least 8 h, confirmed on a subsequent day, to rule out a labeling or technical
error; (b) 2-hour value during OGTT P200 mg/dl (or P11.1 mmol/l)
2
, con-
firmed in a repeated test to make the final diagnosis; (c) symptoms of diabetes
and a casual value P200 mg/dl (or 11.1 mmol/l) at any time of day.
For epidemiological studies, diabetes prevalence and incidence should be
estimated by a FPG P126 mg/dl. The value of FPG was changed from the
1
Same value for capillary plasma glucose; P110 mg/dl (?6.0 mmol/l) for venous or
capillary whole blood glucose.
2
P220 mg/dl (P12.2 mmol/l) for capillary plasma glucose; P180 mg/dl (P10.0 mmol/l)
for venous whole blood glucose; P200 mg/dl (P11.0 mmol/l) forcapillary whole blood glucose.
14Belfiore/Iannello
previous value (P140 mg/dl) to current value (P126 mg/dl), because (1) the
cutpoint of FPG P140 mg/dl defines a greater degree of hyperglycemia than
did the cutpoint of the 2-hour value P200 mg/dl, and (2) this degree of
hyperglycemia usually reflects a serious abnormality associated with serious
chronic diabetic complications. The 2-hour value P200 mg/dl has been re-
tained for the diagnosis of diabetes because it was well accepted, and enormous
clinical and epidemiological data are based on this cutpoint value. The criteria
for diagnosis of diabetes in an asymptomatic child should be stricter than
those for the adults to avoid overdiagnosis of diabetes, and it should be
considered that normal children commonly present OGTT values lower than
adults. The diagnostic values for GDM as proposed by O’Sullivan and Mahan
[1993], revised by NDDG and adopted by ADA and the American College
of Obstetricians and Gynecologists (ACOG), are set lower than those for
nonpregnant adults. A screening test is indicated between 24 and 28 weeks of
gestation in asymptomatic female patients at risk, and a value 1 h after a 50 g
of glucose load P140 mg/dl (or 7.8 mmol/l) can identify the individuals at
risk for GDM in whom a full diagnostic 3-hour OGTT with 100 g of glucose
should be performed. GDM occurs with an FPG P105 mg/dl (or 5.8 mmol/l)
and a 2-hour value during OGTT P165 mg/dl (or 9.2 mmol/l).
An intermediate metabolic state was introduced, which is characterized
by glucose levels above those considered as normal but below those accepted
for the diagnosis of diabetes mellitus. Referring to the fasting state, this
condition was named impaired fasting glycemia or IFG (FPG P110 but
O126 mg/dl or P6.0 but O7.0 mmol/l)
3
. Referring to the postload state, it
was named impaired glucose tolerance or IGT (2-hour postload value in
OGTT P140 mg/dl but O200 mg/dl or P7.8 but O11.1 mmol/l)
4
, without
spontaneous hyperglycemia). IFG or IGT are not clinical entities but rather
risk factors for future type 2 diabetes and cardiovascular disease, being
associated with the metabolic syndrome or insulin resistance syndrome, charac-
terized by abdominal or visceral obesity, hypertension, dyslipidemia (hypertri-
glyceridemia and low HDL value) and hyperuricemia. Conversion of IGT to
type 2 diabetes takes years or decades and occurs in about 10–50% of IGT
patients. Thus, IGT may not progress to overt diabetes and may revert to
normoglycemia, especially in obese patients after dietary treatment and weight
reduction.
3
Same value for capillary plasma glucose; P100 but O110 mg/dl (P5.5 but O6.0 mmol/l)
for venous or capillary whole blood glucose.
4
P160 but O220 mg/dl (P8.9 but O12.2 mmol/l) for capillary plasma glucose; P120
but O180 mg/dl (P6.7 but O10.0 mmol/l) for venous whole blood glucose; P140 but
O200 mg/dl (P7.8 but O11.1 mmol/l) for capillary whole blood glucose.
15Etiological Classification, Pathophysiology and Diagnosis
Table 2. Subjects in whom OGTT should be performed
First-degree relative of type 2 diabetic patients (especially if monozygotic twin of a diabetic
patient or offspring of two diabetic parents)
Subjects with abnormal or borderline glycemic values (FPG P110 mg/dl but O126 mg/dl)
during screening test for diabetes
Pregnant women with suspected GDM
Obese subjects (especially when a family history of diabetes is present)
Individuals with a family history of MODY
Members of racial or ethnic groups with high prevalence of diabetes (American Indians or
Pacific Islanders, African-Americans, Hispanics, etc.)
Patients with unexplained neuropathy or coronary disease or peripheral vascular disease or
retinopathy or nephropathy (especially under 50 years of age)
Patients with hyperglycemia or glycosuria found during acute illness, stress situations, surgical
procedures, steroid administration, etc.
Oral Glucose Tolerance Test
The OGTT is not recommended for routine clinical use (being a nonspe-
cific test) and should be standardized for both procedure and interpretation,
while the use of FPG is encouraged as a simple, convenient, accurate, acceptable
to patients and low cost test for diagnosing diabetes. FPG and 2-hour OGTT
values are equivalent for the diagnosis of diabetes (even if not perfectly corre-
lated with each other), and actually the FPG alone is preferable for its better
reproducibility (6% variation) whereas OGTT, repeated in adults during a 2-
to 6-week interval, presents an intraindividual coefficient of variation of 17%
for the 2-hour value. OGTT remains, however, the most sensitive and practical
test for the early recognition of asymptomatic diabetes without high FPG
value, and it is an invaluable tool in research studies. If the OGTT is used,
the test procedures recommended are that of WHO. The indications of OGTT
are outlined in table 2.
The following variables may affect the OGTT results:
Technical Variables. Venous versus capillary blood: In adults venous
blood from an antecubital vein is usually employed, obtained with minimum
stasis. In the capillary blood, glucose approximates that of arterial blood, and
is higher than in venous blood by 2–3 mg/dl in the fasting state and by
20–70 mg/dl during OGTT.
Plasma or serum versus whole blood: Plasma or serum is generally em-
ployed, providing more stable values. In these materials glucose concentration
is 15% higher than in whole blood. The blood sample should be immediately
refrigerated to prevent glycolysis of glucose by blood cells (fluoride cannot be
16Belfiore/Iannello
used when glucose is measured by enzymatic methods), which would result
in artifactual low glucose values.
Methods for determining glycemia: The most commonly used methods
are the glucose-specific enzymatic methods. The use of strips, read with glucose
reflectance meter, is not recommended for diagnostic purpose (for its great
variability) whereas it is useful for blood glucose self-monitoring during dia-
betes treatment.
Glucosedoseandconcentration:Inthe past,glucosedosesforOGTTvaried
from 50 to 100 g. To avoid nausea and to achieve a better standardization the
use of an oral flavored solution of 75 g glucose dissolved in 300 ml of water for
adults is now recommended. In children, 1.75 g/kg ideal body weight (up to a
maximum of 75 g) should be used. During pregnancy, the OGTT is performed
utilizing 100 g of glucose. The glucose solution should be consumed over 5 min.
Timing of samples for OGTT: Blood samples are obtained in the fasting
state and after 30, 60, 90, 120 min according to NDDG for testing individual
patients. According to WHO, only 0- and 120-min samples should be used,
which makes the test more suitable for testing large population groups or for
epidemiological studies. During pregnancy, a 180-min sample should also be
obtained. For the diagnosis of reactive hypoglycemia, the OGTT should be
prolonged to 5 h.
Time of day: There is a diurnal variation in glucose tolerance (which
deteriorates in the afternoon); thus, a standard OGTT should be obtained in
the morning, after a fasting of 10–14 h.
Host Variables. Preceding diet: A diet containing 250 g of carbohydrate is
recommended for at least 3 days before the test. In subjects on reduced diets, a
diet containing at least 200 g of carbohydrates should be taken for 1 week before
the OGTT. Coffee or smoking are avoided before and during the test.
Physical activity: OGTT should not be performed in patients at bed rest,
hospitalized or immobilized (conditions which may reduce glucose tolerance).
A moderate walking during the test is permitted, but physical exercise should
be avoided.
Acute or chronic illness: OGTT should not be performed in patients
affected by acute infections, acute cardiovascular and cerebrovascular diseases,
active endocrinopathies, hepatic or renal diseases, or in subjects under stress
or treated with some drugs such as glucocorticoids, estrogens, salicylates,
thiazides, nicotinic acid, dilantin, etc.
Age: Glucose tolerance deteriorates with advancing age (because of de-
creased or delayed insulin secretion, reduced insulin sensitivity, increase of
insulin antagonists, physical inactivity, obesity and other associated diseases,
etc.). In the elderly, the 2-hour glycemic level would increase by 10 mg/dl for
each decade over 50 years.
17Etiological Classification, Pathophysiology and Diagnosis
Other Tests
Oral cortisone-glucose tolerance test is not a diagnostic test but is used
for research purpose.
The intravenous glucose tolerance test (or IVGTT) should be used as a
diagnostic test only for patients with gastrointestinal disorders interfering with
absorption of glucose. It is less physiological than OGTT, bypassing the effects
of several relevant gastrointestinal hormones active with oral glucose load.
Glucose (25 g as 50% solution) is infused over 3 min and samples are obtained
every 10 min for 1 h. Through a formula, the K coefficient can be calculated,
whose normal value is between 1.2 and 2.2; values =1 indicate diabetes, values
between 1 and 1.2 are regarded as borderline.
Determination of insulin during OGTT is not recommended for routine
diagnostic purpose (because of extreme variability in fasting state and after
glucose load), although it can be of prognostic value. Values are elevated in
subjects with insulin resistance.
HbA
1c
measurement is not currently used for diagnosis of diabetes whereas
it is useful in monitoring the metabolic control. Normal values of HbA
1c
range from 4.0–4.5 to 6.0–6.4% of total hemoglobin, although differences exist
among values depending on laboratories and/or methods. According to the
IDF guidelines [1999] to type 2 diabetes, HbA
1c
can be useful for the diagnosis
provided that confirmatory venous plasma glucose estimations are obtained,
the assay is DCCT standardized, an HPLC chromatogram is reviewed for
presence of abnormal hemoglobins, and erythrocyte turnover is not abnormal.
Approximately: HbA
1c
?7.5% fasting plasma glucose P7.0 mmol/l
(?125 mg/dl), and HbA
1c
?6.5% fasting plasma glucose ?6.0 mmol/l
(P110 mg/dl).
Glycosuria is not useful for the diagnosis, being present only when glyce-
mia is higher than the renal threshold for glucose. It may be useful for a coarse
monitoring of diabetic control. The aged people may have a higher than
normal renal threshold for glucose (having glycosuria only at elevated glucose
levels), whereas pregnant women often have a lowered glucose threshold (show-
ing glycosuria even with normal glycemia).
Testing for Diabetes mellitus
Type 1 Diabetes. In type 1 diabetes, routine testing for immune markers
(outside of clinical trials or research studies) is not recommend for many
reasons, including: (a) cut-off values have not been completely established for
clinical settings; (b) there is no consensus on proven measures that can prevent
18Belfiore/Iannello
or delay the clinical onset of disease (when a positive autoantibody test is
obtained); (c) the cost-effectiveness of the screening is questionable. The au-
toantibody tests, however, may be useful to detect which newly diagnosed
patients have immune-mediated type 1 diabetes.
Type 2 Diabetes. Type 2 diabetes is commonly undiagnosed in about 50%
of affected subjects. On the other hand, retinopathy may develop early, even
7 years before the diagnosis of overt diabetes. Thus, the unapparent hyperglyce-
mia can cause microvascular complications and favor macrovascular disease.
Therefore, the undiagnosed diabetes is a serious problem. Early detection and
treatment are indispensable to reduce the late complications of type 2 diabetes.
Thus, testing for diabetes (especially with FPG) should be recommended in
the clinical setting and in high-risk subjects.
In asymptomatic and undiagnosed individuals, testing for type 2 diabetes
by FPG should be performed in: (a) all individuals at age 45 and above,
repeated at 3-year intervals if results are normal; (b) individuals at younger
age if at risk (obese subjects, first-degree relatives of diabetic patients, compo-
nents of high-risk ethnic populations, women with GDM, mothers of obese
baby ?9 lb or 4 kg, etc.); (c) hypertensive subjects with low HDL cholesterol
(O35 mg/dl) or high triglycerides (P250 mg/dl); (d) individuals with IGT or
IFG on previous testing.
Suggested Reading
Expert Committee on the Diagnosis and Classification of Diabetes mellitus: Report of the Expert Committee
on the Diagnosis and Classification of Diabetes mellitus. Diabetes Care 1997;20:1183–1197.
Fajans SS: Classification and diagnosis of diabetes; in Rifkin H, Porte D (eds): Diabetes mellitus. Theory
and Practice, ed 4. New York, Elsevier, 1990, pp 346–356.
International Diabetes Federation (IDF), 1998–1999 European Diabetes Police Group: A Desktop Guide to
Type 2 (Non-Insulin-Dependent) Diabetes mellitus. Brussels, IDF, 1999.
National Diabetes Data Group: Classification and diagnosis of diabetes mellitus and other categories of
glucose intolerance. Diabetes 1979;28:1039–1057.
O’Sullivan JB: Diabetes mellitus after GDM. Diabetes 1993;40(suppl):131–135.
Velho G, Blanche H, Vaxillaire M, et al: Identification of 14 new glucokinase mutations and description of
the clinical profile of 42 MODY-2 families. Diabetologia 1997;40:217–224.
World Health Organization: Diabetes mellitus: Report of a WHO Study Group. Tech Rep Ser No 727. Geneva,
WHO, 1985.
Yamagata K, Furuta H, Oda N, et al: Mutations in the hepatocyte nuclear factor-4 gene in maturity-onset
diabetes of the young (MODY-1). Nature 1996;384:458–460.
Yamagata K, Oda N, Kaisaki PJ, et al: Mutations in the hepatocyte nuclear factor-1 gene in maturity-onset
diabetes of the young (MODY-3). Nature 1996;384:455–458.
F. Belfiore, Institute of Internal Medicine, University of Catania, Ospedale Garibaldi,
I–95123 Catania (Italy)
Tel. +39 095 330981, Fax +39 095 310899, E-Mail francesco.belfi
19Etiological Classification, Pathophysiology and Diagnosis
Chapter II
Belfiore F, Mogensen CE (eds): New Concepts in Diabetes and Its Treatment.
Basel, Karger, 2000, pp 20–37
Insulin Secretion and Its
Pharmacological Stimulation
F. Belfiore, S. Iannello
Institute of Internal Medicine, University of Catania, Ospedale Garibaldi,
Catania, Italy
Insulin Secretion
Introduction
Pancreatic -cells synthesize a large polypeptide chain, the proinsulin,
which is then cleaved into the so-called connecting peptide (C-peptide) and
the insulin molecule, composed of two peptide chains containing 51 amino
acid residues. Both insulin and C-peptide are packaged in the secretory gran-
ules. During the secretory process, the granule content is discharged outside
the -cell through a process of exocytosis, leading to the release of insulin and
C-peptide in equimolar amounts, together with small quantities of uncleaved
proinsulin. In contrast to insulin, C-peptide is not taken up by the liver (and
the other insulin-sensitive tissues), and therefore its plasma level is a good
index of insulin secretion.
Regulation of Insulin Secretion by Substrates
Glucose
Glucose is the main physiological regulator of insulin secretion. In vitro,
prolonged stimulation with glucose (or sulfonylureas) induces a biphasic insu-
lin secretory response by pancreatic islets characterized by an initial rapid first
phase lasting about 5 min, during which about 2–3% of the insulin content
of pancreas is released, followed by a slower second phase in insulin secretion,
which results in the liberation of up to 20% of total pancreatic content during
20
a period of 60 min of glucose perfusion. A similar biphasic pattern of secretory
response to glucose has also been reported in vivo in man with the hyper-
glycemic clamp technique. The two secretory phases, however, are not apparent
after a carbohydrate-rich meal because the elevation in blood glucose is not
rapid enough. Nevertheless, an efficient initial insulin secretory response
(dependent upon the -cell sensitivity to glucose elevation) is required for an
optimal glucose control and for avoiding an excessive secretion during the
second phase, which entails the risk of late hypoglycemia (reactive hypogly-
cemia).
Glucose, besides its direct stimulation of insulin release, also potentiates
the secretory response to nonglucose stimuli, which may play a role during
the absorption of mixed meals. In addition, glucose exerts a priming effect of -
cells, as a previous exposure of -cells to glucose causes an enhanced secretory
response to a subsequent stimulation with glucose (or even with nonglucose
stimuli), as if the -cell has memory of the previous glucose exposure. Chronic
exposure to glucose, however, induces desensitization of -cells, which does
not seem to be due to a reduced content or synthesis of insulin. This is relevant
to the condition of persistent hyperglycemia occurring in the diabetic state.
With regard to insulin secretion, three concepts should be distinguished:
the set point for blood glucose, the -cell threshold for glucose, and the -
cell glucose sensor. The set point entails the concept that there is a control
system that ‘sets’ the level of glucose at a given value, which in man is fixed
to about 5 mmol/l glucose. The set point is the result of the activity of -cells
as well as of -cells and -cells.
The glucose threshold for both -cells and -cells is between 5 and
6 mmol/l: when glucose rises above this level, the insulin-secreting -cells are
turned on whereas the glucagon-secreting -cells are turned off, and vice versa.
Glucose threshold increases during starvation, when -cells are blind to even
relatively high glucose levels, and returns to normal upon refeeding. In order
to be able to respond to increase in glucose concentration above the threshold
value, -cells must be equipped with a glucose sensor, which has been identified
in the glucose-phosphorylating enzyme glucokinase (GK). This enzyme, long
known to be present in the liver, has been shown to occur also in the -cells
(the liver and the -cell enzymes differ at genetic level). GK differs from the
ubiquitous enzyme hexokinase (which catalyzes the same reaction as GK, i.e.
glucose phosphorylation), in that hexokinase has a high affinity (or a low K
m
)
for glucose and therefore works at the maximum activity at very low, under-
physiological glucose concentration, whereas GK has a low affinity (or a high
K
m
) for glucose, which entails that its activity increases with increasing glucose
concentration. Its presence in the liver allows this organ to take up glucose
when glycemia in the portal vein increases (such as during the absorption
21Insulin Secretion and Its Pharmacological Stimulation
period), whereas its presence in the -cells allows these cells to perceive the
increase in blood glucose and to respond with adequate insulin release.
In order to stimulate insulin release, glucose must first be transported
into the -cell by the glucose transporter (GLUT-2 isoform), and then phos-
phorylated by GK to produce glucose-6-P. However, glucose transport in -
cells possesses a very high capacity and therefore plays a little regulatory role.
Glucose-6-P produced by GK is further metabolized along several pathways,
through which ATP is generated. Shortly, glucose metabolism results in eleva-
tion of the ATP/MgADP ratio which inhibits ATP-sensitive K
+
-channels, thus
lowering membrane potential and triggering Ca influx through the voltage-
dependent Ca
2+
-channels, which stimulates insulin secretion (fig. 1). Genetic
alterations of key components of the insulin secretory machinery have been
described. Mutations of K
ATP
-channels or the associated sulfonylurea receptors
may cause hyperinsulinemia and hypoglycemia due to persistent depolarization
of the -cell membrane. Mutations in the GK gene (most of which affect the
glucose-binding site) may result in hyporesponsiveness to glucose, as it occurs
in MODY-2 patients, or in hyperresponsiveness, as noted in the familial GK-
linked hyperinsulinemia and hypoglycemia (FHI-GK).
Oscillations in the glycolytic pathway and -cell metabolism contribute to
the oscillatory nature of -cell ionic events and insulin secretion. Insulin release
is a complex oscillatory process with rapid pulses (10 min) superimposed on
slower circhoral oscillations (50–100 min). Moreover, ultradian oscillations of
insulin secretion appear to be an integral part of the feedback loop between
glucose and insulin secretion, and are abnormal in states of glucose intolerance.
Other Substrates
Fats also influence insulin release. In man, FFA were shown to enhance
the secretory response to glucose, which is in agreement with the demonstration
that pancreatic islets are equipped with the enzymes necessary for the utiliza-
tion of FFA and ketone bodies. Amino acids such as isoleucine, arginine
and lysine, potentiate the secretory effect of glucose, whereas leucine may be
regarded as a primary stimulus, active even in the absence of glucose. Amino
acids do not seem to act by serving as fuels for -cells. They might act by
contributing to activate Ca channels.
An important signal for insulin secretion may reside in the inextricable
interplay between glucose and lipid metabolism. Specifically, glucose metabo-
lism leads to the generation of malonyl-CoA, which inhibits carnitine palmi-
toyltransferase-1, with the attendant accumulation of long-chain acyl-CoA
esters in the cytosol (see also chapter III and figure 3). Malonyl-CoA and
long chain acyl-CoA esters may act as metabolic coupling factors in -cell
signalling.
22Belfiore/Iannello
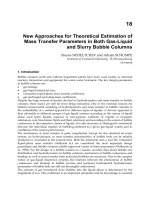
Fig. 1. Regulation of insulin secretion by the -cell. (Continuous lines ending with black
arrows indicate transformation or translocation of substrates or ions; dotted lines ending with
white arrows indicate stimulation; dotted lines ending with filled circles indicate inhibition).
Glucose metabolism (regulated by GK which acts as ‘glucose sensor’) results in production
of ATP which inhibits ATP-sensitive K
+
-channels, thus lowering membrane potential and
triggering Ca influx through the voltage-dependent Ca
2+
-channels. High cytosolic Ca stimu-
lates (through complex processes, not shown) insulin secretion. Sulfonylureas stimulate insulin
secretion by acting through their receptor, closely associated with the ATP-sensitive K
+
-
channels. Parasympathetic stimulation (acetylcholine) promotes insulin secretion through
activation of PLC, which produces IP
3
and DAG (from PIP
2
); IP
3
causes release of Ca from
the intracellular stores (endoplasmic reticulum) into cytosol; DAG activates PKC which in
turn stimulates secretion. Glucagon enhances secretion by activating AC (with the participa-
tion of Gs), thus producing cAMP and activation of PKA. Epinephrine (through the
2
-
receptor) inhibits secretion by inhibiting AC (with the participation of Gi), thus exerting
effects opposed to those of glucagon.
Abbreviations (alphabetic order):
2
>
2
-Adrenergic receptor; AC>adenylate cyclase;
cAMP>cyclic AMP; DAG>1,2-diacylglycerol; GK>glucokinase; Glg>glucagon receptor;
GLP1>glucagon-like peptide 1; Gq>a further type of G protein; Gs and Gi>stimulatory
and inhibitory G proteins; IP
3
>inositol-1,4,5-trisphosphate; M
3
>a type of muscarinic re-
ceptor; PIP
2
>phosphatidylinositol-4,5-P; PKA>protein kinase A; PKC>protein kinase C;
PLC>phospholipase C.
23Insulin Secretion and Its Pharmacological Stimulation
Regulation of Insulin Secretion by Hormones and Neurotransmitters
Acetylcholine, produced by parasympathetic activity, stimulates insulin
secretion through muscarinic receptors (which can be blocked by atropine),
probably by enhancing DAG (diacylglycerol) and IP
3
(inositol-3-P) formation
(fig. 1). Parasympathetic stimulation may occur during the early (cephalic
and intestinal) phase of insulin secretion following a meal as well as during
hypoglycemic episodes. In the latter instance, however, hypoglycemia limits
the parasympathetic effect on insulin secretion, because this effect is glucose-
dependent. The parasympathetic innervation of the pancreas may also trigger
the release of vasoactive intestinal polypeptide (VIP), which stimulates the
secretion of insulin (and glucagon) while increasing the blood flow to the
pancreas and the external pancreatic secretion.
Norepinephrine (released upon sympathetic stimulation) and epinephrine
(produced by adrenal medulla) exert both an inhibitory effect, through the -
adrenergic receptors (fig. 1), and a stimulatory effect, through the -adrenergic
receptors, the overall effect being an inhibition of glucose-stimulated insulin
release and a little effect in the basal state. Sympathetic nerve activity may
also release other neurotransmitters, such as galanin, which would inhibit
both basal and stimulated insulin secretion.
Gastrointestinal hormones (or gut hormones) contribute to the overall
insulin secretion, as shown by the higher insulin secretion after glucose given
per os compared to intravenous glucose. For this action, they are also called
incretins. They include: the gastric inhibitory polypeptide (GIP), secreted by
the endocrine cells of duodenum and jejunum; cholecystokinin (CCK), both
the long (CCK-33) and the short (CCK-8) peptide chain, released by duo-
denum and proximal part of jejunum after ingestion of fats and proteins; the
glucagon-like peptide-1 (7–36) amide, or GLP-1 (7–36), formed from GLP-1
(the precursor proglucagon, produced by the L-cells in the distal part of small
intestine, is processed by tissue-specific proteolysis to produce glucagon in
pancreatic -cells and GLP-1 in the intestine), is released after carbohydrate-
rich meals (fig. 1); the neuropeptide Y (NPY), a neurotransmitter present in
both the central nervous system and the enteric nervous system which produces
stimulation of food intake (and of resting metabolic rate), while probably
acting as an incretin to enhance insulin release.
The counterregulatory hormones (or stress hormones) also affect insulin
secretion. Glucagon is a potent stimulus for the islet -cell (fig. 1), and intrave-
nous bolus injection of 1 mg glucagon has been widely used to assess endogen-
ous insulin secretion for clinical or research purposes. Glucagon stimulates
insulin release mainly through glucagon receptors but not GLP-1 receptors
on islet -cells. On the other hand, insulin may affect glucagon secretion
24Belfiore/Iannello