Mass Transfer in Multiphase Systems and its Applications Part 10 ppt
Bạn đang xem bản rút gọn của tài liệu. Xem và tải ngay bản đầy đủ của tài liệu tại đây (4.79 MB, 40 trang )
Control of Polymorphism and Mass-transfer in
Al
2
O
3
Scale Formed by Oxidation of Alumina-Forming Alloys
349
Time/
min
Po
2
/ Pa
10
-14
10 10
5
10
α-Al
2
O
3
θ + α-Al
2
O
3
(Co,Ni)(Al,Cr)
2
O
4
θ + α-Al
2
O
3
(Co,Ni)(Al,Cr)
2
O
4
200
α-Al
2
O
3
(Co,Ni)(Al,Cr)
2
O
4
600
α-Al
2
O
3
(Co,Ni)(Al,Cr)
2
O
4
Time/
min
Po
2
/ Pa
10
-14
10 10
5
10
α-Al
2
O
3
θ + α-Al
2
O
3
(Co,Ni)(Al,Cr)
2
O
4
θ + α-Al
2
O
3
(Co,Ni)(Al,Cr)
2
O
4
200
α-Al
2
O
3
(Co,Ni)(Al,Cr)
2
O
4
600
α-Al
2
O
3
(Co,Ni)(Al,Cr)
2
O
4
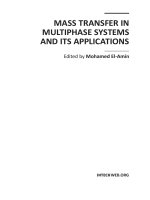
Table 1. Crystalline phases in the oxide scales.
Po
2
=10
5
Pa
Po
2
=10Pa
Po
2
=10
-14
Pa
Cross section
Surface
1μm
1μm
1μm
1μm
1μm
1μm
Po
2
=10
5
Pa
Po
2
=10Pa
Po
2
=10
-14
Pa
Cross section
Surface
1μm1μm
1μm1μm
1μm1μm
1μm1μm
1μm1μm
1μm1μm
Scale
Fig. 3. SEM micrographs of the surfaces and cross-sections of the samples oxidized at 1323 K
for 600 min under P
O2
of 10
-14
, 10, and 10
5
Pa.
The SEM micrographs of the surfaces and cross-sections of the samples oxidized at 1323 K
for 600 min under P
O2
of 10
-14
, 10, and 10
5
Pa, respectively, are shown in Fig. 3. The surface
Mass Transfer in Multiphase Systems and its Applications
350
of the oxide scale formed under a P
O2
of 10
-14
Pa is relatively smooth and its thickness is
about 1 micrometer. On the other hand, the higher the P
O2
for the oxidation is, the larger the
oxide crystals are which are exposed on the scales, increasing the density of surface
irregularities. The scale thickness increases with an increase in P
O2
for the oxidation: the
scale thickness for oxidation under a P
O2
of 10
5
Pa is at least twice that under a P
O2
of 10
-14
Pa. Some of the crystals grown on the oxide scales under the higher P
O2
are considered to be
(Co,Ni)(Al,Cr)
2
O
4
, as shown in Fig. 1 and Table 1. It is well known that the morphology of
theta-Al
2
O
3
consists of blade-like crystals (known as whiskers). In addition, when theta-
Al
2
O
3
survives for a long time at high temperatures, this oxide crystal grows outward about
an order of magnitude faster than alpha-Al
2
O
3
(Tolpygo et al., 2000). Therefore, since the
theta-phase exists longer under a higher P
O2
, the oxide has longer whiskers than those
transformed earlier, resulting in the formation of an oxide scale with a rougher surface.
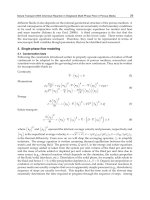
Figure 4 shows the SIMS depth profiles of selected elements through the CoNiCrAlY coats
of the samples oxidized at 1323 K for 600 min under P
O2
of 10
-14
and 10
5
Pa, respectively. For
the oxidation under a P
O2
of 10
-14
Pa (Fig. 4(a)), chromium, cobalt, and nickel are
concentrated near the surface of the scale, which consists of only the crystalline alpha-Al
2
O
3
phase, and high-purity alpha-Al
2
O
3
is formed near the scale side of the interface between the
scale and alloy. Chromium in the scale formed under a lower P
O2
should be oxidized to form
a solid solution of alpha-(Al,Cr)
2
O
3
, whereas both cobalt and nickel detected in the
subsurface should segregate as metals, as shown in Figs. 1 and 2. For oxidation under a P
O2
of 10
5
Pa (Fig. 4(b)), the concentrations of chromium, cobalt, and nickel in the scale are
considerably higher than those under a P
O2
of 10
-14
Pa, and such a high-purity alpha-Al
2
O
3
layer evidently does not exist at the interface between the scale and alloy.
10
-2
10
-1
10
0
10
1
10
2
Concentration / at%
00.5
1.0 1.5
2.0
2.5
Depth / μm
Y
O
Ni
Co
Cr
Al
Oxide scale
3.0
Metal
(a)
10
-2
10
-1
10
0
10
1
10
2
Concentration / at%
00.5
1.0 1.5
2.0
2.5
Depth / μm
Y
O
Ni
Co
Cr
Al
Oxide scale
3.0
Metal
(a)
10
-2
10
-1
10
0
10
1
10
2
Concentration / at%
0
0.5
1.0
1.5
2.0
2.5
Depth / μm
Y
O
Ni
Co
Cr
Al
Oxide scale
3.0
Metal
(b)
10
-2
10
-1
10
0
10
1
10
2
Concentration / at%
0
0.5
1.0
1.5
2.0
2.5
Depth / μm
Y
O
Ni
Co
Cr
Al
Oxide scale
3.0
Metal
(b)
Fig. 4. SIMS depth profiles of selected elements through the CoNiCrAlY coats of the samples
oxidized at 1323 K for 600 min under a P
O2
of (a) 10
-14
and (b) 10
5
Pa.
We have evaluated the oxygen permeability of polycrystalline alpha-Al
2
O
3
wafers exposed to
steep oxygen potential gradients at high temperatures to investigate complicated mass-transfer
phenomena through the alpha-Al
2
O
3
scale formed on the alloy, as discussed later (Matsudaira
et al., 2008, 2010, Wada et al., 2008, Kitaoka et al., 2009). Diffusion of aluminum and oxygen
species, which were responsible for the oxygen permeation along the grain boundaries of
alpha-Al
2
O
3
, was found to be strongly dependent on P
O2
, forming oxygen potential gradients.
Control of Polymorphism and Mass-transfer in
Al
2
O
3
Scale Formed by Oxidation of Alumina-Forming Alloys
351
When the wafer was subjected to potential gradients caused by a combination of low P
O2
values, oxygen permeation primarily occurred by grain boundary diffusion of oxygen through
oxygen vacancies from the higher P
O2
surface to the lower P
O2
surface. Grain boundary ridges
were hardly formed on the surfaces under higher P
O2
because of the very low aluminum flux.
Thus, oxidation of CoNiCrAlY through the alpha-Al
2
O
3
scale under a P
O2
of below 10
-14
Pa is
thought to be mainly controlled by inward grain boundary diffusion of oxygen, because
oxidation progressed without grain boundary ridges in similar to oxidation under purified
argon (Nychka et al., 2005). Nevertheless, chromium, cobalt, and nickel are concentrated near
the scale surface formed by oxidation under a P
O2
of 10
-14
Pa, as shown in Fig. 4(a). The reason
for the segregation of these elements near the scale surface is discussed below.
Figure 5 shows the thermodynamic equilibrium phase boundary (solid line) between alpha-
(Al,Cr)
2
O
3
and (Cr,Ni)(Al,Cr)
2
O
4
as a function of T
-1
. Lower oxidation temperature results in a
larger stability region for (Co,Ni)(Al,Cr)
2
O
4
. Broken line (A) in Fig. 5 indicates the transition of
P
O2
in the furnace as the temperature increased during oxidation treatment under a P
O2
of 10
-14
Pa at 1323 K, corresponding to the testing conditions of Fig. 4(a). The segregation of both
cobalt and nickel near the scale surface shown in Fig. 4(a) seems to be caused by initial
oxidation during temperature increase to produce (Co,Ni)(Al,Cr)
2
O
4
, followed by reduction
and decomposition to cobalt, nickel, and alpha-(Al,Cr)
2
O
3
. According to Fig. 2, the surface
segregation of chromium may be thermodynamically promoted by reducing the solubility of
chromium ions in the alpha-phase with decreasing oxygen chemical potential in the scale from
the scale surface to the interface between the scale and the alloy.
In TBC systems, if a topcoat such as yttria-stabilized zirconia is coated on the pre-oxidized
bond coat of CoNiCrAlY, where metallic cobalt and nickel are segregated near the surface of
the alpha-(Al,Cr)
2
O
3
scale on the alloy (Fig. 4(a)), these segregated metals will react with alpha-
(Al,Cr)
2
O
3
in the scale to produce (Co,Ni)(Al,Cr)
2
O
4
in oxidizing environments at high
temperatures, promoting the spalling of TBCs. If the oxidation of the alloy is carried out under
a P
O2
exactly controlled according to broken line (B) in Fig. 5, which indicates the transition of
P
O2
in the furnace when the temperature is increasing, production of (Co,Ni)(Al,Cr)
2
O
4
at low
temperatures will be inhibited. In other words, although the thickness of the scale formed
along line (B) in Fig. 5 will be similar to that formed along line (A) in Fig. 5, the surface
segregation of cobalt and nickel in the alpha-(Al,Cr)
2
O
3
scale will be suppressed.
The SIMS depth profiles of cobalt and nickel through the CoNiCrAlY coats of the samples
oxidized at a holding temperature of 1323 K under a P
O2
of 10
-14
Pa are shown in Fig. 6.
Lines (a) and (b) in Fig. 6 are when the temperature was increased to 1323 K according to the
P
O2
along line (A) in Fig. 5 and then held at 1323 K for 10 and 600 min, respectively. Line (c)
in Fig. 6 is when the temperature was increased up to 1323 K according to the P
O2
along line
(B) in Fig. 5 and then held for 600 min. When the samples were treated during oxidation
under the P
O2
along line (A) in Fig. 5, only varying the holding time at 1323 K, the
concentration depths of both cobalt and nickel near the scale surface are constant and
independent of the holding time, as shown by lines (a) and (b) of Fig. 6. Because the
oxidation treatments use the same P
O2
transition and heating rate when the temperature was
increased, the amount of (Co,Ni)(Al,Cr)
2
O
4
produced at lower temperature was thought to
be constant and did not depend on the holding time at 1323K. As shown in Fig. 6(c), when
P
O2
during the temperature increase in the oxidation treatment is reduced in the manner
indicated by line (B) in Fig. 5, concentrations of cobalt and nickel at the top surface of the
scale are decrease to about 1/10 those under the P
O2
indicated by line (A) in Fig. 5. The
lower P
O2
during the temperature increase in the oxidation treatment is, the lower surface
Mass Transfer in Multiphase Systems and its Applications
352
concentrations of these elements are, and monolithic alpha-(Al,Cr)
2
O
3
scale will certainly
form. It is expected that the adherence between the topcoat and bond coat will be
considerably improved by controlling the P
O2
transition during the temperature increase,
resulting in further improvement in the durability of TBC systems.
-25
-20
-15
-10
Log (P
O
/ Pa)
2
6789101112
T
-1
/ 10
-4
K
-1
100011001200
130014001500
T / K
α-(Al,Cr)
2
O
3
(Co,Ni)(Al,Cr)
2
O
4
900
B
A
Fig. 5. Thermodynamic equilibrium phase boundary line (solid line) between alpha-(Al,Cr)
2
O
3
and (Cr,Ni)(Al,Cr)
2
O
4
as a function of T
-1
. The broken lines A and B in Fig. 5 indicate the
transition of P
O2
in the furnace during the temperature increase in the oxidation treatment
under a P
O2
of 10
-14
Pa at 1323 K.
10
-2
10
-1
10
0
10
1
10
2
Concentration of Co / at%
0
0.5
1.0
1.5
2.0
2.5
Depth / μm
3.0
(a)
(c)
(b)
Co
10
-2
10
-1
10
0
10
1
10
2
Concentration of Co / at%
0
0.5
1.0
1.5
2.0
2.5
Depth / μm
3.0
(a)
(c)
(b)
Co
10
-2
10
-1
10
0
10
1
10
2
Concentration of Ni / at%
0
0.5
1.0
1.5
2.0
2.5
Depth / μm
3.0
(a)
(c)
(b)
Ni
10
-2
10
-1
10
0
10
1
10
2
Concentration of Ni / at%
0
0.5
1.0
1.5
2.0
2.5
Depth / μm
3.0
(a)
(c)
(b)
Ni
Fig. 6. SIMS depth profiles of Co and Ni through the CoNiCrAlY coats of the samples
oxidized at a holding temperature of 1323 K under a P
O2
of 10
-14
Pa. Lines (a) and (b) in Fig. 8
are when the temperature was increased to 1323 K according to P
O2
along line A in Fig.5 and
then held for 10 and 600 min, respectively. Line (c) in Fig. 6 is when the temperature was
increased to 1323 K according to P
O2
along line B in Fig. 5 and then held for 600 min.
Control of Polymorphism and Mass-transfer in
Al
2
O
3
Scale Formed by Oxidation of Alumina-Forming Alloys
353
3. Mass-transfer of Al
2
O
3
polycrystals under oxygen potential gradients
3.1 Experimental procedures
3.1.1 Materials
Commercial, high-purity alumina powder (TM-DAR, Taimei Chemicals Co., Ltd., Nagano,
Japan, purity > 99.99 wt%) was used for the undoped alumina. Lutetia-doped powders (0.2
mol% of Lu
2
O
3
) were also prepared by mixing the alumina powder and an aqueous solution
of lutetium nitrate hydrate (Lu(NO)
3
·xH
2
O (>99.999%), Sigma-Aldrich Co., MO, USA) and
subsequent drying to remove the water solvent. Each powder was molded by a uniaxial
press at 20 MPa and then subjected to cold isostatic pressing at 600 MPa. The green
compacts were pressureless sintered in air at 1773 K for 5 h. Wafers with dimensions of
diameter 23.5×0.25 mm were cut from the sintered bodies and then polished so that their
surfaces had a mirror-like finish. The relative density of the wafers was 99.5% of the
theoretical density. All the wafers had similar microstructures with an average grain size of
about 10 micrometer.
3.1.2 Oxygen permeability constants
Figure 7 shows a schematic diagram of the oxygen permeability apparatus. A polycrystalline
alpha-Al2O3 wafer was set between two alumina tubes in a furnace. Platinum gaskets were
used to create a seal between the wafer and the Al
2
O
3
tubes by loading a dead weight from
the top of the upper tube. A gas-tight seal was achieved by heating at 1893-1973 K under an
Ar gas flow for 3 hrs or more. After that, a P
O2
of oxygen included as an impurity in the Ar
gas was monitored at the outlets of the upper and lower chambers that enclosed the wafer
and the Al
2
O
3
tubes using a zirconia oxygen sensor at 973K. The partial pressure of water
vapor (P
H2O
) was measured at room temperature using an optical dew point sensor. These
measured P
O2
and P
H2O
were regarded as backgrounds. Then, pure O
2
gas or Ar gas
containing either 1-10 vol% O
2
or 0.01-1 vol% H
2
was introduced into the upper chamber at a
flow rate of 1.67×10
-6
m
3
/s. A constant flux for oxygen permeation was judged to be achieved
when the values of the P
O2
and P
H2O
monitored in the outlets became constant.
When either O
2
gas or the Ar/O
2
mixture was introduced into the upper chamber and Ar
was introduced into the lower chamber to create an oxygen gradient across the wafer,
oxygen permeated from the upper chamber to the lower chamber. The P
O2
values in the
lower chamber at the experimental temperatures were calculated thermodynamically from
the values measured at 973 K. The calculated values were almost the same as those at 973 K.
On the other hand, when the Ar/H
2
mixture was introduced into the upper chamber and Ar
was introduced into the lower chamber, a tiny amount of oxygen in the Ar permeated from
the lower chamber to the upper chamber and reacted with H
2
to produce water vapor. As a
result, the P
H2O
in the upper chamber increased while the H
2
partial pressure (P
H2
), which
was measured at room temperature by gas chromatography, in the upper chamber
decreased. The increase of P
H2O
in the upper chamber was comparable to the reduction of
P
O2
in the lower chamber in terms of oxygen, and the P
H2O
in the lower chamber remained
constant during the permeation tests; thus, hydrogen permeation from the upper chamber
to the lower chamber was negligibly small in comparison with the oxygen permeation in the
opposite direction. The P
O2
values in the upper chamber at the experimental temperatures
were estimated thermodynamically from the P
H2O
and P
H2
measured at room temperature.
The oxygen permeability constant, PL, was calculated from the difference between the P
O2
estimated thermodynamically in one chamber (which had a lower P
O2
than that in another
chamber) and the background in the lower P
O2
chamber using
20), 22), 23)
Mass Transfer in Multiphase Systems and its Applications
354
p
st
CQL
PL
VS
⋅⋅
=
⋅
, (1)
where C
p
is the concentration of permeated oxygen (P
O2
/P
T
, where P
T
= total pressure), Q is
the flow rate of the test gases, V
st
is the standard molar volume of an ideal gas, S is the
permeation area of the wafer, and L is the wafer thickness.
The wafer surfaces exposed to oxygen potential gradients at 1923 K for 10 hrs were observed
by scanning electron microscopy (SEM) combined with energy dispersive spectroscopy
(EDS), and X-ray diffraction (XRD). The volume of the grain boundary ridges formed on the
surfaces by the oxygen potential gradients was measured by 3D laser scanning microscopy,
and was compared with the total amount of the oxygen permeated in the wafer.
Pt gaskets
Specimen
Furnace
Al
2
O
3
tubes
Ar
Ar-O
2
Ar-H
2
Ar
Dry ice
Dry ice
O
2
sensor
Dew point
sensor
O
2
sensor
Gas
chromatograph
Dew point
sensor
Gas
chromatograph
Fig. 7. Schematic diagram of the gas permeability apparatus.
3.1.3 Determination of grain boundary diffusion coefficients
(a) Fluxes of charged particles
The charged particle flux is described as
ii i
ii
CD
JZ
RT x
η
∂
⎛⎞
=−
⎜⎟
∂
⎝⎠
, (2)
Control of Polymorphism and Mass-transfer in
Al
2
O
3
Scale Formed by Oxidation of Alumina-Forming Alloys
355
where Z
i
is the charge of the diffusing particle, C
i
is the molar concentration per unit
volume, D
i
is the diffusion coefficient, R is the gas constant, T is the absolute temperature, x
is a space coordinate, and η
i
is the electrochemical potential.
The flux of oxygen that permeates through the wafer is equal to the sum of J
Al
and J
O,
2
e'
O
Al
h
TO Al O Al Al O O O
O
(t t )
μ
Z
JJJ CDZCD
ZRTx
+
⎛⎞
∂
=+=− + ⋅
⎜⎟
⎜⎟
∂
⎝⎠
i
(3)
where t
i
is the transport number and
O
μ
is the oxygen chemical potential.
Integrating Eq. (3) from x = 0 to x = L gives
OO
22
22
OO
22
2
L P (II) P (II)
e'
Al Al
h
TO Al O O O O O
0 P (I) P (I)
O
(t t )
ZC
J dx D d ln P Z C D d ln P
2Z
+
⎛⎞
=− +
⎜⎟
⎜⎟
⎝⎠
∫∫∫
i
(4)
Equation (4) is applicable to the case of ideal oxygen permeation when there is no
interaction between electrons and holes, or when either electrons or holes exclusively
participate (Kitaoka et al., 2009, Matsudaira et al., 2010).
(b) Oxygen grain boundary diffusion
The flux of oxygen that permeates through the wafer is postulated to be equal only to J
O
. It is
also assumed that oxygen permeates only through reactions between defects, in which both
oxygen vacancies and electrons participate. In these reactions, dissociative adsorption of O
2
molecules is assumed to progress on the surface exposed to the higher P
O2
(i.e., P
O2
(II)) as
follows.
X
2 O O
1/2O V 2e' O ++→
ii
(5)
Oxygen ions migrate through oxygen vacancies from the P
O2
(II) side to the lower P
O2
side
(i.e., P
O2
(I)), and oxygen vacancies and electrons diffuse in the opposite direction to the
oxygen flux. The inverse reaction to Eq. (5) proceeds on the P
O2
(I) surface, and oxygen ions
recombine to produce O
2
molecules.
If the diffusing species migrate mainly along the grain boundaries of polycrystalline Al
2
O
3
,
the grain boundary diffusion coefficient of oxygen related to Eq. (5), is written as
Ogb
22
Ogb
1/3
V
-1/6 -1/6
O
Ogb O O
Ob gb Ob gb
V
D
A
1
D δ P P
CS 4K 6CS
⎛⎞
⎜⎟
==−
⎜⎟
⎝⎠
ii
ii
(6)
where
O
g
b
D is the grain boundary diffusion coefficient of oxygen,
δ
is the grain boundary
width, C
Ob
is the molar concentration of oxygen per unit volume, S
gb
is the grain boundary
density, which is determined from the average grain size in the Al
2
O
3
.
Ogb
V
D
is the grain
boundary diffusion coefficient of an oxygen vacancy and
Ogb
V
K
is the equilibrium constant
of reaction (5) that occurs at grain boundaries. Assuming that t
e’
= 1 and
O
g
b
D >>
l
g
A
b
D ,
and inserting Z
O
= -2 and Eq. (6) into Eq. (4) gives
Mass Transfer in Multiphase Systems and its Applications
356
22
L
-1/6 -1/6
TO O O O
0
Jdx A(P(II) P(I) )4PL =−=
∫
(7)
If the constant A
O
is determined experimentally using Eq. (7),
O
g
b
D
δ
for a certain P
O2
can be
estimated from Eq. (6).
(c) Aluminum grain boundary diffusion
The flux of oxygen that permeates through the wafer is premised to be equal only to J
Al
.
Oxygen permeation is also assumed to occur by reactions in which both aluminum
vacancies and holes participate. O
2
molecules are absorbed on the surface exposed to P
O2
(II)
as follows.
X' ' '
2O Al
1/2O O 2/3V 2h →+ +
i
(8)
Aluminum vacancies move from the P
O2
(II) side to the P
O2
(I) side, and aluminum ions and
holes migrate in the opposite direction. Finally, the inverse reaction of (8) occurs on the
P
O2
(I) surface, and oxygen ions recombine to produce an O
2
molecule.
In a similar way to Section 3.1.3(b), the grain boundary diffusion coefficient of aluminum,
l
g
A
b
D
, is obtained as follows.
''' '''
Algb Algb
22
3/8
VV
3/16 3/16
Al
Algb O O
Alb gb Alb gb
D K
A
D δ P P
C S 9 12C S
⎛⎞
⎜⎟
==
⎜⎟
⎝⎠
(9)
C
Alb
denotes the molar concentration of aluminum per unit volume,
l
g
Ab
V
D
′
′′
is the grain
boundary diffusion coefficient of aluminum vacancies,
l
g
Ab
V
K
′
′′
is the equilibrium constant of
reaction (8) that occurs at the grain boundaries. If it is assumed that t
h
・=1 and
l
g
A
b
D
>>
O
g
b
D , then substituting Z
Al
= +3 and Z
O
= -2 into Eq. (4) gives
22
L
3/16 3/16
TO Al O O
0
Jdx A(P(II) P(I) )4PL=−=
∫
(10)
If the experimental value of A
Al
is obtained using Eq. (10),
lg
A
b
D
δ
for a certain P
O2
can be
calculated from Eq. (9).
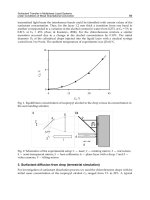
3.2 Oxygen permeation
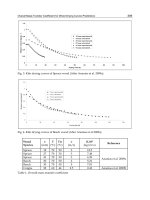
Figure 8 shows the temperature dependence of oxygen permeability constant of
polycrystalline Al
2
O
3
(non-doped and doped with 0.2 mol% Lu
2
O
3
) exposed to oxygen
potential gradients (ΔP
O2
). The solid and open symbols indicate data for specimens exposed
under P
O2
(II)/ P
O2
(I)= 1 Pa/10
-8
Pa and 10
5
Pa/1 Pa, respectively. The other lines are data
from the literature under a similar ΔP
O2
as that for the open symbols. The oxygen
permeability constants are found to increase with increasing temperature, such that they are
proportional to T
-1
, in a similar manner as the data from the literature. The oxygen
permeability constants tend to decrease with increasing purity of Al
2
O
3
. For P
O2
(II)/ P
O2
(I) =
10
5
Pa/1 Pa, the oxygen permeability constants of the lutetia-doped wafer are similar to
those of the undoped wafer. Although the slopes of the curves for P
O2
(II)/ P
O2
(I) = 1 Pa/10
-8
Pa are the same for both samples, they are markedly different from those for P
O2
(II)/ P
O2
(I)=
10
5
Pa/1 Pa. Furthermore, the permeability constants obtained for P
O2
(II)/ P
O2
(I) = 1 Pa/10
-8
Pa
Control of Polymorphism and Mass-transfer in
Al
2
O
3
Scale Formed by Oxidation of Alumina-Forming Alloys
357
are clearly reduced by lutetia doping. These results suggest that the effect of lutetia doping
on the oxygen permeation and the corresponding permeation mechanism vary depending
on the oxygen potential gradients.
1.0E-12
1.0E-11
1.0E-10
1.0E-09
1.0E-08
1.0E-07
4.5E-04 5.0E-04 5.5E-04 6.0E-04 6.5E-04
10
-7
10
-11
10
-8
10
-12
Temperature, T/ K
Oxygen Permeability Constant, PL/mol m
-1
s
-1
T
-1
/ 10
-4
K
-1
4.5 5.0 5.5 6.0 6.5
2200
2100 2000 1900 1800 1700
10
-9
10
-10
1600
99.8% Al
2
O
3
(Volk et al., 1968)
99.5% Al
2
O
3
(Ogura et al., 2001)
99% Al
2
O
3
(Courtright et al., 1992)
10
5
/10
0
10
0
/10
-8
0.20%Lu
2
O
3
Non-doped
Po
2
(II) / Po
2
(I) (Pa/Pa)
Additive
Fig. 8. Temperature dependence of oxygen permeability constant of polycrystalline Al
2
O
3
(non-doped and doped with 0.2 mol% Lu
2
O
3
) exposed to oxygen potential gradients (ΔP
O2
).
The solid and open symbols indicate data for specimens exposed under P
O2
(II)/ P
O2
(I)= 1
Pa/10
-8
Pa and 10
5
Pa/1 Pa, respectively. The other lines are data from the literature under a
similar ΔP
O2
as that for the open symbols.
Because the oxygen permeability constants of a single-crystal Al
2
O
3
wafer were lower than
the measurable limit of this system (below 1×10
-12
mol·m
-1
s
-1
at 1773 K), the oxygen
permeation is thought to occur preferentially through the grain boundaries for the
polycrystalline Al
2
O
3
(Matsudaira et al., 2008). Furthermore, the oxygen permeability
constants of the polycrystalline wafers were inversely proportional to the wafer thickness.
According to Eq.(2), therefore, the oxygen permeation is considered to be controlled by
diffusion in the wafer, not by interfacial reaction between the wafer surfaces and ambient
gases.
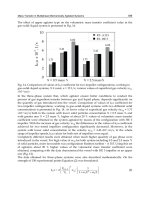
Figure 9 shows the effect of P
O2
under a steady state in the upper chamber on the oxygen
permeability constants of polycrystalline alumina (undoped and doped with 0.20 mol%
Lu
2
O
3
) at 1923 K, where the P
O2
in the lower chamber is constant at about 1 Pa. For P
O2
values of less than 10
-3
Pa, the oxygen permeability constants decrease with increasing P
O2
for both the undoped and lutetia-doped wafers. The slopes of the curves correspond to a
power constant of n = -1/6, which is applicable to the defect reaction given in Eq. (5) and is
related to P
O2
(I) in accordance with Eq. (7), since P
O2
(II) >> P
O2
(I). O
2
molecules are assumed
to permeate mainly by grain boundary diffusion of oxygen through the oxygen vacancies
from the higher to the lower P
O2
surface. When the doping level is 0.2 mol%, the oxygen
Mass Transfer in Multiphase Systems and its Applications
358
permeability constants are about three times smaller than for undoped alumina, although
the slopes of the curves are similar. Thus, lutetium doping seems to suppress the mobility of
oxygen without changing the oxygen diffusion mechanism. On the other hand, the oxygen
permeability constants for all the polycrystals for P
O2
values above 10
3
Pa in the upper
chamber are similar to each other and increase with increasing P
O2
, as shown in Fig. 9. Their
slopes correspond to a power constant of n = 3/16 that suggests participation in the defect
reaction given in Eq. (8) and P
O2
(II) in accordance with Eq. (10), since P
O2
(II) >> P
O2
(I).
Under potential gradients generated by P
O2
values above approximately 10
3
Pa, O
2
molecules seem to permeate mainly by grain boundary diffusion of aluminum through
aluminum vacancies from the lower to the higher P
O2
surface. In this case, the lutetium
segregated at grain boundaries would be expected to have little effect on the diffusivity of
aluminum.
10
-9
10
-12
10
-11
10
-10
10
-5
10
-3
10
-1
10
1
10
3
10
7
10
-7
10
5
n=3/16
n=-1/6
10
-9
Po
2
in the upper chamber, P / Pa
0.20%Lu
2
O
3
10
5
/ 10
0
10
0
/ 10
-8
Non-doped
Po
2
(II) / Po
2
(I) (Pa/Pa)
Additive
Oxygen Permeability Constant, PL / molm
-1
s
-1
Fig. 9. Effect of P
O2
in the upper chamber on the oxygen permeability constants of
polycrystalline alumina (non-doped and doped with 0.2 mol% Lu
2
O
3
) at 1923 K. The solid
symbols indicate data for specimens exposed to a ΔP
O2
between about P
O2
(II) = 1 Pa in the
lower chamber and a much lower P
O2
(P
O2
(I)) in the upper chamber. The open symbols
indicate data for specimens exposed to a ΔP
O2
between P
O2
(I) = 1 Pa in the lower chamber
and a much higher P
O2
( P
O2
(II)) in the upper chamber.
Figure 10 shows SEM micrographs of the surfaces and cross-sections of non-doped
polycrystalline alumina exposed at 1923 K for 10 h under ΔP
O2
with P
O2
(II)/ P
O2
(I)= 1 Pa/10
-
8
Pa and 10
5
Pa/1 Pa. For P
O2
(II)/ P
O2
(I)= 1 Pa/10
-8
Pa, grain boundary grooves are observed
on both the surfaces, of which morphology is similar to that formed by ordinary thermal
etching. The oxygen potential gradients with combination of the lower P
O2
values hardly
affect the surface morphological change. The absence of the grain boundary ridges suggests
that the migration of aluminum was scarcely related to the oxygen permeation. This surface
morphology supports the oxygen permeation mechanism with n = -1/6 as shown in Fig. 9.
For P
O2
(II)/ P
O2
(I)= 10
5
Pa/1 Pa, grain boundary ridges with heights of a few micrometers
Control of Polymorphism and Mass-transfer in
Al
2
O
3
Scale Formed by Oxidation of Alumina-Forming Alloys
359
can be seen on the P
O2
(II) surface, while deep crevices are formed at the grain boundaries on
the P
O2
(I) surface. The total volume of the grain boundary ridges, measured by 3D laser
scanning microscopy, was consistent with the volume of alumina that should be produced
given the observed amount of oxygen permeation (Kitaoka et al., 2009). This result provides
adequate support for an oxygen permeation mechanism with n = 3/16, as shown in Fig. 9.
Cross-section
Surface
Cross-section
Surface
Cross-section
Surface
Cross-section
Surface
Cross-section
10μm
10μm
10μm
10μm
Cross-section
Surface
Cross-section
Surface
Cross-section
Surface
Cross-section
Surface
Cross-section
Surface
Cross-section
Surface
Cross-section
Surface
Cross-section
Surface
Cross-section
10μm
10μm
10μm10μm
10μm10μm
10μm10μm
Po
2
(II)/Po
2
(I) = 10
0
/ 10
-8
(Pa/Pa) 10
5
/ 10
0
(Pa/Pa)Po
2
(II)/Po
2
(I) = 10
0
/ 10
-8
(Pa/Pa) 10
5
/ 10
0
(Pa/Pa)
Po
2
(II) side
Po
2
(I) side
Fig. 10. shows SEM micrographs of the surfaces and cross-sections of non-doped
polycrystalline alumina exposed at 1923K for 10h under ΔP
O2
with P
O2
(II)/P
O2
(I)=1 Pa/10
-8
Pa
and 10
5
Pa/1 Pa.
Figure 11 shows SEM micrographs of the surfaces and cross-sections of polycrystalline
alumina doped with 0.2 mol% Lu
2
O
3
exposed at 1923 K for 10 h under ΔP
O2
with P
O2
(II)/
P
O2
(I)= 1 Pa/10
-8
Pa and 10
5
Pa/1 Pa. Figure 12 shows top-view SEM images of the surfaces
corresponding to Fig. 11. In the case of P
O2
(II)/ P
O2
(I) = 1 Pa/10
-8
Pa, as shown in Fig. 11,
shallow grain boundary grooves, similar to those produced by conventional thermal
etching, are observed on both surfaces, as in the case of undoped alumina. In addition, as
seen in Fig. 12, a large number of particles with diameters of about 1 micrometer are
uniformly distributed at the grain boundaries on both surfaces. The distribution of the
particles was maintained during exposure under the oxygen potential gradient at 1923 K.
These particles were identified as Al
5
Lu
3
O
12
by XRD and EDS and had already precipitated
at the grain boundaries by reaction of alumina grains with excess lutetium during sintering
the sample. The remainder of the added lutetium should then become segregated at the
grain boundaries. This implies that the lutetium species scarcely migrates, remaining in the
wafer during oxygen permeation, and inhibiting the mobility of oxygen from the region of
higher P
O2
to the region of lower P
O2
(Fig. 9).
Mass Transfer in Multiphase Systems and its Applications
360
Cross-section
Surface
Cross-section
Surface
10μm10μm
Cross-section
Surface
10μm10μm
Surface
Cross-section
Surface
Cross-section
10μm
10μm
Surface
Cross-section
Surface
Cross-section
10μm
10μm
Al
5
Lu
3
O
12
Po
2
(II) side
Po
2
(I) side
Po
2
(II)/Po
2
(I) = 10
0
/ 10
-8
(Pa/Pa) 10
5
/ 10
0
(Pa/Pa)Po
2
(II)/Po
2
(I) = 10
0
/ 10
-8
(Pa/Pa) 10
5
/ 10
0
(Pa/Pa)
Fig. 11. SEM micrographs of the surfaces and cross-sections of polycrystalline alumina
doped with 0.2 mol% Lu
2
O
3
exposed at 1923 K for 10 h under ΔP
O2
with P
O2
(II)/ P
O2
(I)= 1
Pa/10
-8
Pa and 10
5
Pa/1 Pa.
10μm
Al
5
Lu
3
O
12
Al
5
Lu
3
O
12
Al
5
Lu
3
O
12
10μm10μm
10μm10μm
10μm10μm
Po
2
(II) side
Po
2
(I) side
Po
2
(II)/Po
2
(I) = 10
0
/ 10
-8
(Pa/Pa) 10
5
/ 10
0
(Pa/Pa)Po
2
(II)/Po
2
(I) = 10
0
/ 10
-8
(Pa/Pa) 10
5
/ 10
0
(Pa/Pa)
Fig. 12. SEM micrographs of the surfaces of polycrystalline alumina doped with 0.2 mol%
Lu
2
O
3
exposed at 1923K for 10h under ΔP
O2
with P
O2
(II)/P
O2
(I)=1 Pa/10
-8
Pa and 10
5
Pa/1Pa.
Control of Polymorphism and Mass-transfer in
Al
2
O
3
Scale Formed by Oxidation of Alumina-Forming Alloys
361
For P
O2
(II)/ P
O2
(I) = 10
5
Pa/1 Pa, Fig. 11 reveals that the grain boundaries on the higher P
O2
surface are raised to a height of a few micrometer, while deep trenches are formed at the
grain boundaries on the lower P
O2
surface, similar to the case for undoped alumina.
Furthermore, as seen in Fig. 12, the higher P
O2
surface exhibits Al
5
Lu
3
O
12
particles with
diameters of several micrometer, but such particles are not found on the opposite surface.
This can be explained by a migration of both lutetium and aluminum from the lower to the
higher P
O2
region.
3.3 Grain boundary diffusion coefficients
The grain boundary diffusion coefficients of oxygen and aluminum (
g
b
D
δ
) are estimated
from the oxygen permeability constants shown in Fig.9 by the procedure described in
Section 3.1.3. Figure 13 shows
g
b
D
δ
for oxygen and aluminum in polycrystalline alumina
(undoped and doped with 0.20 mol% Lu
2
O
3
) as a function of the equilibrium partial
pressure of oxygen in the upper chamber at 1923 K. Values of oxygen diffusion coefficients
10
-5
10
-3
10
-1
10
1
10
3
10
7
10
-7
10
5
10
-9
10
-24
10
-23
10
-22
10
-21
10
-20
10
-19
D
gb
δ
/ m
3
s
-1
Non-doped polycrystal
(Plot et al., 1996)
Non-doped bicrystal
(Nakagawa et al., 2007)
AlO
0.20%Lu
2
O
3
Non-doped
Diffusion species
Additive
AlO
0.20%Lu
2
O
3
Non-doped
Diffusion species
Additive
Non-doped polycrystal
(Heuer, 2008)
Y-doped polycrystal
(Plot et al., 1996)
Y-doped bicrystal
(Nakagawa et al., 2007)
Po
2
in the upper chamber, P / Pa
Fig. 13.
g
b
D
δ
of oxygen and aluminum in polycrystalline alumina (non-doped and doped
with 0.2 mol% Lu
2
O
3
) as a function of the equilibrium partial pressures of oxygen in the
upper chamber at 1923 K. The solid and open symbols indicate the
g
b
D
δ
of oxygen and
aluminum, respectively.
taken from the literature (Plot et al., 1996, Nakagawa et al., 2007, Heuer, 2008) are also
shown in Fig. 13. They were determined using an
18
O isotopic tracer profiling technique for
bicrystalline or polycrystalline alumina annealed in a homogeneous environment in the
absence of an oxygen potential gradient, and their P
O2
values on the abscissa correspond to
those in the annealing environments. The data for refs. (Nakagawa et al., 2007, Heuer, 2008)
are estimated by extrapolating to 1923 K. For lutetia-doped polycrystalline alumina, there
are unfortunately no data for oxygen grain boundary diffusion coefficients determined by
Mass Transfer in Multiphase Systems and its Applications
362
the tracer profiling technique, but some measurements have been carried out on yttria-
doped alumina. On the other hand, it has been reported that creep resistance in
polycrystalline alumina was improved remarkably by doping to only 0.05-0.1 mol% with
oxides such as Lu
2
O
3
and Y
2
O
3
in a similar effect on the creep resistance to each other
(Ikuhara et al., 2001). Thus, the grain boundary coefficients for oxygen in yttria-doped
alumina (polycrystal and bicrystal) are shown in Fig. 13 for reference.
The
g
b
D
δ
value for oxygen is seen to decrease with increasing P
O2
, whereas the value for
aluminum increases for both undoped and lutetia-doped alumina. Increasing the doping
level to 0.2 mol% lutetia causes an approximately three times reduction in
g
b
D
δ
, while
maintaining the slope of the curve. In contrast, the
g
b
D
δ
value of aluminum is unaffected
by lutetia doping. Thus, lutetia doping has the effect of reducing the mobility of oxygen
along the grain boundaries, but has little influence on the diffusion of aluminum.
For the undoped alumina, the line extrapolated to higher P
O2
for
g
b
D
δ
of oxygen is
consistent with previous reported data obtained using SIMS (Plot et al., 1996, Nakagawa et
al., 2007), but deviates widely from data using NRA (Heuer, 2008). There is a thermal
equilibrium level of defects such as Schottky pairs (Buban et al., 2006) or Frenkel pairs
(Heuer, 2008) in alumina held in uniform environments at high temperatures. As shown in
Figs. 9-13, the oxygen potential gradients through the wafer seem to result in the formation
of new defects such as oxygen vacancies for lower P
O2
ranges and aluminum vacancies for
higher P
O2
ranges, in addition to the thermally induced defects. Because
g
b
D
δ
for oxygen
and aluminum are proportional to the concentration of their respective vacancies, the
dominant defects in the wafer are probably oxygen vacancies for lower P
O2
values and
aluminum vacancies for higher P
O2
values. Therefore, the extrapolated line in Fig. 8 may
correspond to the SIMS data (Plot et al., 1996, Nakagawa et al., 2007), where the
concentration of oxygen vacancies induced by the oxygen potential gradient for the higher
P
O2
ranges is asymptotic to that under thermal equilibrium. Nevertheless, the reason why
the NRA result deviates so much cannot be ascertained based on the descriptions given in
the paper (Heuer, 2008).
As mentioned above, elements such as yttrium and lutetium that were segregated at the
grain boundaries of alumina by addition of only 0.05-0.1 mol% Ln
2
O
3
effectively retarded
oxygen grain boundary diffusivity, creep deformation and final-stage sintering under
uniform environments (Nakagawa et al., 2007, Ikuhara et al., 2002, Yoshida et al., 2002, 2007,
Watanabe et al., 2003). Retardation of such mass transfer can be explained by a ‘site-
blocking’ mechanism (Amissah et al., 2007, Wang et al., 1999, Cho et al., 1999, Cheng et al.,
2008, Priester, 1989, Korinek et al., 1994) and/or grain boundary strengthening (Yoshida et
al., 2002, Buban et al., 2006). Under the oxygen potential gradients used in this study, it was
found that oxygen diffusitivity was unaffected by 0.05 mol% lutetia-doping (Matsudaira et
al., 2010), and even for 0.2 mol% doping, the retardation was small compared to the effect in
uniform environments. This may be related to the generation of a large number of oxygen
vacancies in the vicinity of the grain boundaries under an oxygen potential gradient, despite
the fact that Lu
3+
is isovalent with Al
3+
.
As mentioned in the Introduction, Bedu-Amissah et al. measured Cr
3+
diffusion in alumina
under a Cr
3+
concentration gradient (Amissah et al., 2007). From the chromium diffusion
profile, they found that yttrium doping retards cation diffusion in the vicinity of the grain
boundary, reducing
g
b
D
δ
by at least one order of magnitude (Amissah et al., 2007). In
Control of Polymorphism and Mass-transfer in
Al
2
O
3
Scale Formed by Oxidation of Alumina-Forming Alloys
363
contrast, the
g
b
D
δ
value of aluminum under oxygen potential gradients is unaffected by
lutetia doping. Thus, lutetia doping has little influence on the diffusion of aluminum along
grain boundaries. This may be related to the generation of a large number of aluminum
vacancies around grain boundaries under an oxygen potential gradient, which reduces the
effect of ‘site-blocking’ and/or grain boundary strengthening, resulting in outward
diffusion of both lutetium and aluminum, as shown in Figs. 11 and 12.
4. Conclusions
The oxidation of the CoNiCrAlY alloy under a P
O2
of 10
-14
Pa at 1323 K, during which both
aluminum and chromium in the alloy were oxidized and elements such as cobalt and nickel
were not oxidized, accelerated the transformation from metastable theta-Al
2
O
3
to stable
alpha-Al
2
O
3
, resulting in the formation of a dense, smooth alpha-(Al,Cr)
2
O
3
scale. The
surface concentrations of cobalt and nickel in the scale, which was evolved by formation of
(Co,Ni)(Al,Cr)
2
O
4
during the temperature increase and subsequent reduction and
decomposition of the oxide at a higher temperature, could be effectively reduced by
decreasing the P
O2
during the temperature rise in the oxidation treatment. By contrast,
oxidation at a higher P
O2
required a longer time for the transformation and
(Co,Ni)(Al,Cr)
2
O
4
was also produced in the scale with a rougher surface.
The oxygen permeability of undoped and lutetia-doped polycrystalline alpha-alumina
wafers that were exposed to oxygen potential gradients (ΔP
O2
) was evaluated at high
temperatures to investigate the mass-transfer phenomena through the alumina scale. The
main diffusion species during oxygen permeation through the alumina grain boundaries
was found to depend on P
O2
values, which created ΔP
O2
. Under ΔP
O2
generated by low P
O2
values, where oxygen permeation occurred by oxygen diffusion from regions of higher to
low P
O2
, segregated lutetium at the grain boundaries suppressed only the mobility of
oxygen in the wafers, without affecting the oxygen permeation mechanism. By contrast,
under ΔP
O2
generated by high P
O2
values, where oxygen permeation proceeded by
aluminum diffusion from regions of lower to higher P
O2
, lutetium had little effect on
aluminum diffusion and migrated together with aluminum, resulting in precipitation and
growth of Al
5
Lu
3
O
12
particles on the higher P
O2
surface.
5. References
Evans A. G., Mumm D. R., Hutchinson J. W., Meier G. H. & Pettit F. S. (2001). Mechanisms
Controlling the Durability of Thermal Barrier Coatings. Prog. Mater. Sci., 46, 505-553
Brumm M. W. & Grabke H.J. (1992). The Oxidation Behavior of NiAl - I. Phase
Transformations in the Alumina Scale During Oxidation of NiAl and NiAl-Cr
Alloys. Corrosion Science, 33, 1677-1690
Tolpygo V.K. & Clarke D.R. (2000). Microstructural Study of the Theta-Alpha
Transformation in Alumina Scales Formed on Nickel-Aluminides. Microscopy of
Oxidation, 17, 59-70
Tolpygo V.K., Clarke D.R. & Murphy K. S. (2001). The Effect of Grit Blasting on the
Oxidation Behavior of Platinum-Modified Nickel-Aluminide Coating. Metall. Mater.
Trans., 32A, 1467-1478
Mass Transfer in Multiphase Systems and its Applications
364
Tolpygo V.K. & Clarke D.R. (2005). The Effect of Oxidation Pre-Treatment on the Cyclic Life
of EB-PVD Thermal Barrier Coatings with Platinum-Aluminide Bond Coats. Surf.
Coat. Technol. 200, 1276-1281
Nijdam T.J. & Sloof W.G. (2006). Combined Pre-Annealing and Pre-Oxidation Treatment for
the Processing of Thermal Barrier Coatings on NiCoCrAlY Bond Coatings. Surf.
Coat. Technol., 201, 3894-3900
Matsumoto M., Hayakawa K., Kitaoka S., Matsubara H., Takayama H., Kagiya Y. & Sugita
Y. (2006). The Effect of Preoxidation Atmosphere on Oxidation Behavior and
Thermal Cyclic life of Thermal barrier Coatings. Mater. Sci. Eng. A 411, 119-125
Matsumoto M., Kato T., Hayakawa K., Yamaguchi N., Kitaoka S. & Matsubara H. (2008).
The Effect of Pre-Oxidation Atmosphere on the Durability of EB-PVD Thermal
Barrier Coatings with CoNiCrAlY Bond Coats. Surf. Coat. Technol., 202, 2742-2748
Pint A., Treska M. & Hobbs L.W. (1997). The Effect of Various Oxide Dispersions on the
Phase Composituin and Morphology of Al
2
O
3
Scales Grown on beta-NiAl. Oxid.
Met., 47, 1-20
Peng X., Clarke D.R. & Wang F. (2003). Transient-Alumina Transformations during the
Oxidation of Magnetron-Sputtered CoCrAl Nanocrystalline. Oxid. Met., 60, 225-240
Clarke D.R. (1998). Epitaxial Phase Transformations in Aluminum Oxide. Phys. Stat. Sol.,
166, 183-196
Odaka A., Yamaguchi T., Fujita T., Taruta S. & Kitajima K. (2008). Cation Dopant Effect on
Phase Transformation and Microstructural Evolution in M
2+
-Substituted gamma-
Alumina Powders. J. Mater. Sci., 43, 2713-2720
Nagano T., Sato K., Saitoh T. & Takahashi S. (2009). Hydrothermal Stability of Mesoporous
Ni-Doped gamma-Al
2
O
3
. J. Ceram. Soc. Jpn., 117, 832-835
Kitaoka S., Kuroyama T., Matsumoto M., Kitazawa R. & Kagawa Y. (2010). Control of
Polymorphism in Al
2
O
3
Scale Formed by Oxidation of Alumina-forming Allys.
Corrosion Science, 52, 429-434
Nychka J.A. & Clarke D.R. (2005). Quantification of Alumminum Outward Diffusion During
Oxidation of FeCrAl Alloys. Oxid. Metals, 63, 325-352
Matsudaira T., Wada M., Kitaoka S., Asai T., Miyachi Y. & Kagiya Y. (2008). Gas
Permeability of Oxide Ceramics at Ultra-high Temperatures. J. Soc. Mater. Sci. Jpn.,
57, 532-538
Wada M., Matsudaira T. & Kitaoka S. (2008). Oxygen Permeability and Morphological
Stability of Alumina Ceramics under O
2
Potential Gradients at Ultra-High
Temperatures. AMTC Letters, 1, 34-35
Kitaoka S., Matsudaira T. & Wada M. (2009). Mass-Transfer Mechanism of Alumina
Ceramics under Oxygen Potential Graddients at High Temperatures. Mater. Trans.,
50, 1023-1031
Volk H.F. & Meszaros F.W. (1968). Ceramic Micro Structures their Analysis Significance &
Production, ed. by R. M. Fullhrath and J. A. Pask, John Wiley and Sons, New York
Courtright E.L. & Prater J.T. (1992). Oxygen Permeability of Several Oxides above 1200 deg.C, US
DOE Rep. PNL-SA-20302
Ogura Y., Kondo M., Morimoto T., Notomi A. & Sekigawa T. (2001). Oxygen Permeability of
Y
2
SiO
5
. Mater. Trans., 42, 1124-1130.
Control of Polymorphism and Mass-transfer in
Al
2
O
3
Scale Formed by Oxidation of Alumina-Forming Alloys
365
Plot D., Gall M.L., Lesage B., Huntz A.M. & Monty C. (1996). Self-diffusion in Alpha-Al
2
O
3
IV. Oxygen Grain-boundary Self-diffusion in Undoped and Yttria-doped Alumina
Polycrystals.Philos. Mag. A, 73, 935-949
Nakagawa T., Sakaguchi I., Shibata N., Matsunaga K., Mizoguchi T., Yamamoto T., Haneda
H. & Ikuhara Y. (2007). Yttrium Doping Effect on Oxygen Grain Boundary
Diffusion in Alpha-Al
2
O
3
. Acta Mater., 55, 6627-6633
Messaoudi K., Huntz A.M. & Lesage B. (1998). Diffusion and Growth Mechanism of Al
2
O
3
Scales on Ferritic Fe-Cr-Al Alloys. Mater. Sci. Eng. A, 247, 248-262
Heuer A.H. (2008). Oxygen and Aluminum Diffusion in Alpha-Al
2
O
3
: How Much Do We
Really Understand ?. J. Eur. Ceram. Soc., 28, 1495-1507
Paladino A.E. & Kingery W.D. (1962). Aluminum Ion Diffusion in Aluminum Oxide. J.
Chem. Phys., 37, 957-962
Le Gall M., Lesage B. & Bernardini J. (1994). Self-diffusion in Alpha-Al
2
O
3
I. Aluminum
Diffusion in Single Crystals. Philos. Mag. A, 70, 761-773
Amissah K.B., Rickman J.M., Chan H.M. & Harmer M.P. (2007). Grain-boundary Diffusion
of Cr in Pure and Y-Doped Alumina. J. Am. Ceram. Soc., 90, 1551-1555
Pint B.A., Garratt-Reed A.J. & Hobbs L.W. (1998). Possible Role of the Oxygen Potential
Gradient in Enhancing Diffusion of Foreign Ions on Alpha-Al
2
O
3
Grain Boundaries.
J. Am. Ceram. Soc. 81, 305-314
Matsunaga K., Tanaka T., Yamamoto T. & Ikuhara Y. (2003). First-principles Calculations of
Intrinsic Defects in Al
2
O
3
. Phys. Rev. B, 68, 085110
Ikuhara Y., Yoshida H. & Sakuma T. (2001). Impurity Effects on Grain Boundary Strength in
Structural Ceramics. Mater. Sci. Eng., A319-321, 24-30
Yoshida H., Ikuhara Y. & Sakuma T. (2002). Grain Boundary Electronic Structure Related to
the High-temperature Creep Resistance in Polycrystalline Al
2
O
3
. Acta Mater., 50,
2955-2966
Wang C.M., Cargill III G.L., Harmer M.P., Chan H.M. & Cho J. (1999). Atomic Structural
Environment of Grain Boundary Segregated Y and Zr in Creep Resistant Alumina
from EXAFS. Acta Mater., 47, 3411-3422
Cho J., Wang C.M., Chan H.M., Rickman J.M. & Harmer M.P. (1999). Role of Segregating
Dopants on the Improved Creep Resistance of Aluminum Oxide. Acta Mater., 47,
4197-4207
Cheng H., Dillon S.J., Caram H.S., Rickman J.M., Chan H.M. & Harmer M.P. (2008). The
Effect of Yttrium on Oxygen Grain-boundary Transport in Polycrystalline Alumina
Measured Using Ni Maker Particles. J. Am. Ceram. Soc., 91, 2002-2008
Priester L. (1989). Geometrical Speciality and Special Properties of Grain Boundaries. Rev.
Phys., 24, 419-438
Korinek S.L. & Dupau F. (1994). Grain Boundary Behavior in Superplastic Mg-doped
Alumina with Yttria Codoping. Acta. Metall. Mater., 42, 293-302
Buban J.P., Matsunaga K., Chen J., Shibata N., Ching W.Y., Yamamoto T. & Ikuhara Y.
(2006). Grain Boundary Strengthening in Alumina by Rare Earth Impurities.
Science, 311, 212-215
Matsudaira T., Wada M., Saitoh T. & Kitaoka S. (2010). The Effect of Lutetium Dopant on
Oxygen Permeability of Alumina Polycristals under Oxygen Potential Gradients at
Ultra-high Temperatures. Acta Mater., 58, 1544-1553
Mass Transfer in Multiphase Systems and its Applications
366
Degterov S. & Pelton A.D. (1996). Critical Evaluation and Optimization of the
Thermodynamic Properties and Phase Diagrams of the CrO-Cr
2
O
3
, CrO-Cr
2
O
3
-
Al
2
O
3
, and CrO-Cr
2
O
3
-CaO Systems. J. Phase Equilibria, 17, 476-487
Ansara I., Dupin N., Lukas H.L. & Sundman B.J. (1997). Thermodynamic Assessment of the
Al-Ni System. Alloys and Compounds, 247, 20-30
Watanabe S., Yoshida H. & Sakuma T. (2003). Densification Behavior and Grain Boundary
Diffusivity in Cation-doped Alumina. Key Engineering Materials, 247, 67-70
Yoshida H., Morita K., Kim B.N., Hiraga K., Yamamoto T. & Sakuma T. (2007). estimation of
Grain Boundary Diffusivity in Cation-doped Polycrystalline Alumina. Mater Sci
Forum, 558-559, 997-1002
17
Mass Transfer Investigation of
Organic Acid Extraction with Trioctylamine and
Aliquat 336 Dissolved in Various Solvents
Md Monwar Hossain
United Arab Emirates University (Company)
United Arab Emirates
1. Introduction
Organic acids have been used in producing biodegradable polymeric materials (polylactate)
and they are also being considered for manufacture of drugs, perfumes and flavours as raw
materials. Therefore the production of high purity organic acids is very important. They can
be produced by chemical methods. However, fermentation technology has proven to be the
best alternative being more energy efficient and having potential. To allow production and
separation simultaneously. The major part of the production cost accounts for the cost of
separation from very dilute reaction media where productivity is low due to the inhibitory
nature of many organic acids. The current method of extraction/separation is both
expensive and environmentally unfriendly. Therefore, there is great scope for development
of an alternative technology that will offer increased productivity, efficiency, economic and
environmental benefits. One of the promising technologies for recovery of organic acids
from fermentation broth is reactive liquid-liquid extraction (Tamada and King, 2001, Dutta
et al., 2006). However, common organic solvents when used alone show low distribution
coefficients and do not give efficient separation. Reactive liquid-liquid extraction (RLLE)
utilizes a combination of an extractant (also known as carrier) and diluents to intensify the
separation through simultaneous reaction and extraction. Thus this method provides high
selectivity and enhances the recovery. RLLE has been applied in many analytical, industrial,
environmental and metallurgical processes (Parthasarathy et al., 1997; Klassen, et al., 2005;
Kumar et al., 2001; Urtiaga et al., 2005; Carrera et al., 2009). In most of these applications one
of these following solvents: kerosene, toluene/mixtures of kerosene and methyl isobutyl
ketone (MIBK), hexane/decanol/octanol or any solvent system with similar toxic
characteristics have been examined. These solvents have been proven to separate the
“target” component from the aqueous solutions containing it. However, they have the issues
of sustainability, health and safety, operator-friendliness and environmental impact.
Therefore, efforts are devoted to determine a solvent that will partially or fully address these
issues. In this chapter, a new, non-traditional solvent is examined for its ability to separate a
specific component by applying the reactive extraction. Lactic acid (an organic acid) is
chosen as the specific component (as a model for all other organic acids), experiments are
presented to show its capacity and finally the analysis is extended to include the mass
transfer processes in microporous hollow-fiber membrane module (HFMM). In the next few
paragraphs lactic acid is described with the processes of production and ongoing research in
Mass Transfer in Multiphase Systems and its Applications
368
the development of techniques to separate it from the production media. From the methods
one is selected (i.e. RLLE) and the new solvent system that has the potential to overcome the
disadvantages of the currently practiced solvent, is examined.
Lactic acid (2-hydroxypropanoic acid, CH
3
CHOHCOOH) is a colorless, organic liquid. It has
a variety of applications in the food, chemical, pharmaceutical and cosmetic industries
[Hong, et al., 2002]. The Food and Drug Administration (FDA) have approved lactic acid
and its salts to be GRAS (Generally Recognized as Safe) [Lee, et al., 2004]. It can be
converted to a polylactic acid used for the synthesis of biodegradable materials [Coca, et al.,
1992]. As well as being environmentally friendly, there is a growing demand; due to strict
environmental laws being legislated for biodegradable polymers as a substitute for
conventional plastic materials.
Biodegradable copolymers are also used for the production of
new materials with biomedical applications such as drug delivery systems [Choi, and Hong,
1999].
Lactic acid is typically produced via either chemical synthesis or the fermentation of whey
or another in-expensive carbon source [Lee, et al., 2004]. Due to the increasing cost of the
common raw material for the chemical synthesis, the efficient production of lactic acid
through fermentation has become increasingly important [Han, et al., 2000; Heewsink, et al.,
2002; Drioli, et al., 1996; Hano, et al., 1993; Siebold, et al., 1995]. As mentioned earlier, an
economical and efficient method for the recovery from fermentation broth is vital as the
overall cost of production is dominated by the cost of recovery [Han, et al., 2000; Drioli, et
al., 1996].
The production of most organic acids from fermentation media are subject to product
inhibition as the reaction proceeds [Hano, et al., 1993; Hong and Hong, 1999; Yuchoukov, et
al., 2005]. Hence, the separation of the organic acid as it is being produced is highly
desirable. The extractive fermentation, in situ application of the solvent extraction technique,
keeps the product concentration in the broth at a low level and suppresses the product
inhibition by continuously removing them from a fermentation broth [Siebold, et al., 1995;
Yankov et al., 2005; Frieling and Schugerl, 1999].
Various methods for the extraction of lactic acid have been reported such as precipitation,
ion exchange process, adsorption, diffusion dialysis, microcapsules, esterification and
hydrolysis, reactive extraction as well as a simulated moving bed process (Hong, et al., 2002;
Tik, et al., 2001; Tong, et al., 1999; Ju, and Verma, 1994; Gong, et al., 2006; Sun et al., 2006).
These methods have several disadvantages including high cost, and they produce large
volumes of waste, require multiple steps, and operate with low efficiency under practical
conditions. As mentioned earlier, the RLLE method using microporous Hollow Fibre
Membrane Contactor (HFMC) may potentially overcome many of the disadvantages and
provide a better alternative for the recovery of lactic acid (Wasewar, et al., 2002; Datta and
Henry, 2006; Schlosser, 2001; Lin, and Chen, 2006). In a recent review, a process based on
RLLE in HFMM has been found to be competitive from the process, economic and
environmental points of view (Sun, et al., 2006; Joglekar, et al., 2006; Datta, et al., 2006). The
advantages of the membrane mass transfer process over the conventional systems are (Lin,
and Chen, 2006; Sun, et al., 2006; Joglekar, et al., 2006; Datta, et al., 2006):
• Selectivity and flexibility of extraction
• in situ application to reduce any inhibitory effect
• Reduction of number of steps (improved productivity)
• Use of operator and environmentally-friendly organic system
• Minimal dispersion of phases (less contamination)
• Recycle of extracting media and generation of smaller wastes
Mass Transfer Investigation of Organic Acid Extraction
with Trioctylamine and Aliquat 336 Dissolved in Various Solvents
369
• Lower temperature operation requiring less energy
• Ability to operate on identical density systems
• Availability of large-scale module (i.e. easy scale up methods).
Amine compounds have been found useful as extractants for the separation of organic acids
(Tamada and King, 2000; Kertesz, and Schlosser, 2005). They provide high efficiency and
selectivity. Secondary, tertiary and quaternary amines and their mixtures have been
employed for this purpose. An organic solvent is required to dissolve the reaction product,
and a diluent is required to control the viscosity and to stop formation of any third phase.
Active polar and proton-donating diluents as alcohols have been shown to be the most
suitable diluents for amines as they show high distribution coefficient. The reaction
mechanism changes with the combination of the extractant and solvent type. But the mass
transfer equations and analysis of the processes involved are similar to those developed in
the following section.
To understand and explore more of this process the main aims were set
• to determine a less toxic, environmentally-friendly solvent and a carrier or a mixture of
carriers for extraction of lactic acid and the effect of conditions (temperature and pH)
similar to the fermentation,
• to discuss the results of the experiments on liquid-liquid extraction
• to develop a mathematical model for the mass transfer processes in a small pilot-scale
contactor
• to evaluate the performance of the less toxic solvent for extraction under fermentation
conditions (i.e. in presence of salts and lactose).
• to compare the results of the hollow-fibre experiments.
The results show that the new system has the potential to overcome some of the
disadvantages mentioned above. More research is required to optimise the experimental
conditions, to develop a more comprehensive mathematical model including extraction and
re-extraction and obtain performance data with “real” (rather than synthetic system) system.
In the next section, mathematical modelling is presented for liquid-liquid extraction and
mass transfer processes in a commercially available membrane module (i.e. HFMM). Rather
than a comprehensive approach a simple analysis is proposed to provide an understanding
of the mass transfer phenomena in a small pilot-scale module.
2. Modeling of equilibrium and mass transfer
2.1 Liquid-liquid extraction
The reaction of undissociated lactic acid (HLA) with a carrier (B) dissolved in the solvent
gives a reaction complex (BHLA) which remains largely in the organic phase and may be
represented by (Juang and Huang, 1997; Datta, et al., 2006; Yuchoukov, et al., 2005):
(
)
(
)
(
)
-
ΗLA B B LA
aq org
org
+
+⇔Η
(1)
A simple 1:1 stoichiometry (the molar ratio of organic acid to that of extractant) has been
proposed. However, this depends on the type of the organic acid and its ionic state, the type
of the extractant and the type of the solvent (Uslu et al., 2009). The reaction mechanism does
not change the mass transfer processes.
For reactive extractions microporous hollow fiber membrane contactors, in various
configurations have been evaluated (Klassen et al., 2005; Yang, and Cussler, 2000; Ren et al.,
Mass Transfer in Multiphase Systems and its Applications
370
2005; Tong et al., 1998; Juang, et al., 2000; Prasad and Sirkar, 1988). Typically two modules
are used, one for the extraction and the other for the re-extraction or stripping process.
Fig. 1. A schematic diagram of the mass transfer operation of the hollow-fibre membrane
contactor.
These are commercially available modules, e.g. a module with catalogue No. 5PCM-218,
obtained from Separation Products Division, Hoechst Celanese Corporation, Charlotte, NC,
USA, have been extensively used for mass transfer operation. The contactor has a shell-and-
tube configuration with a total of 10,000 polypropylene hollow fibers (Celgard X-30, 240 µm
ID, 300 µm, OD, length 15 cm) potted in polyethylene in a polypropylene case of 6 cm ID.
The surface area of the contactor is 1.4 m
2
. The hollow fiber module is usually set up as
Mass Transfer Investigation of Organic Acid Extraction
with Trioctylamine and Aliquat 336 Dissolved in Various Solvents
371
shown in Figure 1. When these modules are used, aqueous and organic solutions flow
continuously, one through the lumen side of the fibre and the other through the shell side.
The both the solutions get into contact through the pores of the wall. Phase entrainment is
avoided by applying a little higher pressure on the aqueous side. The pressure difference
between the phases is between 0.2 – 0.3 bar and it has been reported that it has no influence
on the mass transfer processes.
These contactors have been used in various process configurations such as hollow fibre
contained liquid membranes, HFCLM (Yang et al., 2003; Dai et al., 2000), hollow fibre
supported liquid membrane, HFSLM, (Yang and Kocherginsky, 2006; Rathore, et al., 2001),
non-dispersive solvent extraction, NDSX, Ortiz, et al., 2004) and hollow fibre renewal liquid
membranes, HFRLM, (Ren et al., 2008). The main difference between these configurations is
that the contacting pattern of the liquid phases are different. In a newly developed mass
transfer operation known as emulsion pertraction, PERT, a single module is used for
extraction and stripping simultaneously (Klaassen and Jansen, 2001; Klassen et al., 2005).
The emulsion consists of an organic solvent with a dissolved extractant phase with droplets
of strip liquid dispersed in it. The phases are separated by the hydrophobic membrane
surface. The contact between the water phase and emulsion phase occurs at the pore mouth.
The organic acid-extractant complex diffuses through the pores and on the other side of the
membrane the extractant is regenerated by strip liquid. The analysis below is not applicable
to the PERT process, it is devoted to extraction in a single module.
2.2 Mass transfer in a hollow fibre membrane contactor
A schematic of the transport mechanism of solute molecules from an aqueous feed side to
the organic side through hollow-fibre wall is shown in Figure 2 (Hossain and Mysuria,
2008). The mass transfer processes can be described by the solute transport through the
resistances from the aqueous feed (inside the fibre) to the organic phase (shell side). The
steps considered for the mass transport and reactive extraction, the solute (lactic acid)
molecules:
• are transported from the feed solution to the feed-pore interface and can be expressed
by Eq. (2).
• at the interface the reaction between the solute and the carrier takes place (Eq.1) to form
a solute-carrier complex. The equilibrium concentrations at the interface in the aqueous
and organic phases can be related by an apparent distribution coefficient (DE), given by
Eq. (3).
• The diffusion of the solute-carrier complex through the pores of the hollow-fibers filled
with the organic phase and this can be expressed by Eq. (4).
• The final step is the transport through the solvent boundary layer at the outer end of the
pore mouth and this step can be expressed as in Eq. (5).
The following assumptions have been considered for writing the model equations:
• The system works at isothermal conditions.
• Equilibrium is reached at the interfaces of the aqueous and organic phases.
• The curvature of the interfaces does not affect significantly the processes.
• The distribution coefficient of the solute is considered to be constant with the conditions
used
• Uniform pore size along the entire length of the contactor.
• The mass transfer processes in the boundary layer is described by the diffusion model.
• The phases are immiscible and the pores are wetted by the organic phase only.
Mass Transfer in Multiphase Systems and its Applications
372
()
aq org org
m
C
V
LAf
Convective flux -
u
f
Α z
in
The interfacial reaction:
(HLA) (B) (BH LΑ )
BH LΑ diffuses throu
g
h the wall
to the shell side (the diffusive flux)
m
C
m
LAo
Flux -K C
of LAf
D
E
∂
⎛⎞
=
⎜⎟
∂
⎝⎠
−+−
+⇔
+−
⎛⎞
⎜⎟
=−
⎜⎟
⎜⎟
⎝⎠
Fig. 2.(a) A schematic of the mass transfer processes in the membrane module.
Fig. 2.(b) Concentration profiles of lactic acid in the feed phase (fibre side), in membrane
wall and in the organic phase (shell side).
Mass Transfer Investigation of Organic Acid Extraction
with Trioctylamine and Aliquat 336 Dissolved in Various Solvents
373
The transport equations are
(
)
LAf f LAf LAfi
NkCC=−
(2)
/
ELAOiLA
f
i
DC C
=
(3)
(
)
LAm m
f
LA
f
iLAOi
NkCC=−
(4)
(
)
LAo o LAOi LAO
NkC C
=
−
(5)
where k
f
, k
mf
and k
o
are the mass transfer coefficient in the feed side, on the membrane and
in the organic side, respectively. The concentrations C
LAf
and C
LAfi
are the total lactic acid
concentrations in the bulk and at the interface, respectively. The concentrations C
LAOi
and
C
LAO
are the concentration of lactic acid at the membrane-organic interface and in the bulk
organic phase, respectively.
Combining the above equations the flux in the system at the steady state is obtained as:
(
)
LAf of LAf LAO E
NKCCD=−
(6)
where K
of
is the overall mass transfer coefficient of the process. K
of
is related to the
individual transfer coefficients by the following equation:
11 1 1
o
ff
Em
f
OE
KkDkkD
=+ +
(7)
In order to calculate the overall mass transfer coefficient from the above equation the
individual mass transfer coefficients have to be known in addition to the distribution ratio of
lactic acid between the aqueous-organic solutions. There are many correlations available in the
literature for calculating the individual mass transfer coefficients (Lin, and Chen, 2006;
Bringas, et al., 2009; Coelhoso et al. 2000). Each of the correlation is based on the specific
experimental conditions and equipment set-up used to develop the correlation. So the
assumption of the correlation needs to be matched for its appropriateness before applying to
any other system. The calculations from the correlations will be discussed later. In the section
below an approximate solution is presented for hollow-fibre membrane modules to evaluate
the overall mass transfer coefficient from an analysis of concentration versus time data.
2.3 Approximate solution for the mass transfer model
The membrane modules are operated in recycling mode as the percentage extraction in
once-through operation is small. In the recycling mode, it is considered that the feed and the
organic solutions are circulated through the fiber side and shell side of the module,
respectively.
The mathematical model consists of two mass balance equations, Eq. (8) and (9) that defines
the change in solute concentration (i) in the module and (ii) in the feed tank, where aqueous
solution is continuously circulated.
mm
m
LAf LAf
m
LAO
fofLAf
E
in in
CC
C
VV
uKC
At AZ D
∂∂
⎛⎞
⎛⎞ ⎛⎞
=− − −
⎜⎟
⎜⎟ ⎜⎟
⎜⎟
∂∂
⎝⎠ ⎝⎠
⎝⎠
(8)