Vital Signs and Resuscitation - part 2 docx
Bạn đang xem bản rút gọn của tài liệu. Xem và tải ngay bản đầy đủ của tài liệu tại đây (671.39 KB, 18 trang )
10
Vital Signs and Resuscitation
1
having a high temperature with shivering, then, “respiration infrequent, deep
for a while and then the breaths would be rapid. She died on the twenty-first
day, comatose with deep, intermittent respiration throughout”. He was not-
ing a type of periodic breathing seen in the terminally ill and described by
John Cheyne (1777-1836), a Scottish physician, and William Stokes (1804-
1836), an Irish doctor.
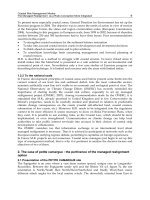
Fig. 1.6. Early Stethoscopes—circa 1889. Reprinted with permission from: National
Museum of American History, Smitsonian Institution #80-13427.
11
History of the Vital Signs
1
Aristotle (384-322 BC) believed that air is taken into the lungs, absorbed
by blood passing through the lungs, and delivered by the pulmonary vein to
a fiery heart that the air cools. Herophilus (335-280 BC) claimed that “lungs
absorb fresh air and breathe out devitalized air”. Erasistratus (310-250 BC)
indicated that air is absorbed by the lungs, transported by a “vein-like artery”
to the left ventricle to form a “vital spirit”, and conveyed by air-filled arteries
to various parts of the body. Galen postulated that blood absorbs air into the
lungs and is propelled by chest movements through the lungs into a veinlike
artery that delivers the mixture to the left ventricle. “There it cools the burning
heart, the source of innate heat”. Robert Hooke proved in 1667 that air is
necessary for life, showing that breathing provides air to the lungs, which
converts venous blood into arterial.
Increased interest in the respiratory system took place in the 18th century
because of the isolation of oxygen by Karl Scheele (1742-86) and Joseph
Priestley (1733-1804). A Scottish chemist, Joseph Black (1728-1799)
discovered carbon dioxide. Lavoisier (1743-94) gave the name “oxygen” to
the substance in air responsible for combustion and noted that respiration
was necessary in living tissue. The French physiologist Claude Bernard (1813-
1878) experimented with oxygen and carbon dioxide in the biological system.
Accurate localization of the respiratory center in the medulla was achieved
in 1824 by M.J. Flourens and in 1832 by the English physiologist Marshall
Hall. The spirometer was invented in 1846 by Hutchinson to measure lung
volumes in various groups of people in London, “including 121 sailors, 24
pugilists and wrestlers and 4 giants and dwarfs”. Proof that the function
of hemoglobin was to take up oxygen was provided by Felix Hoppe-
Seyler in 1862.
J.S. Haldane (1860-1936), a Scottish physiologist, discovered respiratory
principles as an outgrowth of problems connected with coal mining in
England. He found that breathing was regulated by the tension of carbon
dioxide in the blood on the respiratory center in the brain rather than by the
oxygen, and developed an apparatus for the investigation of respiration and
for blood-gas analysis.
Blood Pressure
Galen (mentioned earlier) demonstrated that arteries contain blood, not
air, as was thought for 400 years. He grasped the main principles of the
venous and arterial circulations, although he incorrectly postulated that the
septum of the heart possessed small micropores which allowed blood to move
from the right to the left side of the heart.
Nothing much was done after Galen to explore the course of blood flow
until the second major experimental physiologist, William Harvey (1578-
1657) in 1616 elucidated the mechanism of the pulse and proved that blood
circulated within a closed system. He concluded in 1628 in the Exercitatio
12
Vital Signs and Resuscitation
1
Anatomica de Moto Cordis et Sanguinis in Animalibus that “the movement of
the blood is constantly in a circle, and is brought about by the beat of the
heart”. Harvey wondered how Galen, having gotten so close to the answer,
did not arrive at the concept of a closed circulation.
In 1733, an English clergyman named Stephen Hales, measuring physi-
ological parameters in plants and animals, recorded the first blood pressure.
“I endeavoured to find what was the real force of the blood in December
I laid a common field gate on the ground, with some straw upon it, on
which a white mare was cast on her right side then laying bare the left
carotid artery, I fixed to it towards the heart a brass pipe whose bore was one
sixth of an inch in diameter and to that the wind-pipe of a goose; to the
other end of which a glass tube was fixed, of nearly the same diameter, which
was 12 feet 9 inches long; then untying the ligature on the artery, the blood
rose in the tube 9 feet 6 inches perpendicular above the level of the left
ventricle of the heart; but it did not attain to its full height at once; it rushed
up about half way in an instant, and afterwards gradually at each pulse 12, 8,
6, 4, 2, and sometimes 1 inch; when it was at its full height, it would rise and
fall at and after each pulse 2, 3, or 4 inches; and sometimes it would fall 12
or 14 inches, and have there for a time the same vibrations up and down, at
and after each pulse, as it had, when it was at its full height; to which it
would rise again, after forty or fifty pulses.” (Fig. 1.7)
Hales noted that the pulse rate is inversely related, and the blood pressure
directly related, to body size. He also found that the cardiac output is the
product of the pulse rate and the volume of the left ventricle, and concluded
that the blood pressure was the result of the dilation and constriction of
blood vessels.
In 1876, Ritter von Basch built an apparatus that indirectly measured the
blood pressure of man. This “sphygmomanometer” was the forerunner of a
simpler device constructed by an Italian physician, Scipione Riva-Rocci, in
1896. In 1905, Nicolai Korotkoff, a Russian physician, described taking a
man’s blood pressure, the sequence of which is applicable today: “The sleeve
of Riva-Rocci is placed on the middle 1/3 of the arm toward the shoulder.
The pressure in the sleeve is raised quickly until it stops the circulation of the
blood beyond the sleeve. Thereupon, permitting the mercury manometer to
drop, a child’s stethoscope is used to listen to the artery directly beyond the
sleeve. At first no audible sound is heard at all. As the mercury manometer
falls to a certain height the first short tones appear, the appearance of which
indicates the passage of part of the pulse wave under the sleeve. Consequently
the manometer reading at which the first tones appear corresponds to the
maximum pressure. With a further fall of the mercury systolic pressure mur-
murs are heard which change again to a sound (secondary). Finally, all sounds
disappear. The time at which the sounds disappear indicates a free passage of
13
History of the Vital Signs
1
the pulse wave; in other words, at the moment the sounds disappear, the
minimum blood pressure in the artery exceeds the pressure of the sleeve”
Claude Bernard, a third major physiologist, in 1852 discovered the vaso-
constrictor nerves. Etienne Marey, a French physician, in 1859 elucidated
the inverse relationship between blood pressure and heart rate. Ernest Star-
ling (1866-1927), an English physician, found that the cardiac output per
Fig. 1.7. Hale’s first blood pressure recording—1733. Reprinted with permission
from: Lyons A, Petrucelli J. Medicine: An Illustrated History. ©1987 Abradale Press/
Abrams, Inc.
14
Vital Signs and Resuscitation
1
beat is directly proportional to diastolic filling. Hering in 1927 elucidated
the baroreceptor system.
Origin of the Term “Vital Signs”
Because of the invention of the mercury thermometer by Fahrenheit and
its gradual modification for clinical use, a renewed interest in body tempera-
ture and its relationship to the pulse and respiratory rate came about in the
late eighteenth and early nineteenth centuries. In the 7th century, a fast
pulse, not an increase in temperature, was the main criterion for diagnosing
fever. Interestingly, this notion persisted throughout the 18th century.
Boerhaave asserted that a rapid pulse was pathognomonic of fever. Body
temperature was a side-issue.
John Hunter (mentioned earlier) in a treatise on the blood, inflamma-
tion, and gun-shot wounds in 1794, wrote of a relationship between pulse
Fig. 1.8. Early Sphygmomanometer—1896. Reprinted with permission from: National
Museum of American History, Smitsonian Institution #63367-D.
15
History of the Vital Signs
1
and temperature in several invertebrate species, as well as dogs, asses, frogs
and humans. James Currie (mentioned earlier) in 1797 made simultaneous
measurements of the pulse and temperature. In 1818, John Cheyne
(mentioned earlier) collected data on the pulse, respiratory rate and tem-
perature on certain patients admitted to the Hardwicke Fever Hospital. Alfred
Donne of Paris in 1835 published a series of similar measurements on the
relationships between pulse, body temperature, and the respiratory rate.
John Davy in 1863, an English physician, began recording pulse,
respirations and temperatures concurrently, noting an “intimate connexion
between them”. At about the same time, Joseph Jones, professor of medicine
at the Medical College of Georgia, presented case reports with observations
on the temperature, pulse and respirations in patients with malaria.
Two English translations of Wunderlich’s book were published in 1871,
one by W.B. Woodman, assistant physician to the London Hospital, and a
second by Edouard Seguin, a French psychiatrist and educator who
immigrated to America in 1848. Seguin was responsible, not only because
of his translation of Wunderlich’s book, but through a series of articles and
his own book, Medical Thermometry and Human Temperature, for introducing
the thermometer into usage in the United States. Wunderlich indicated that,
“Seguin has made our experience well known in America”.
In May, 1866, Edward Seguin, son of Edouard, while an intern at New
York Hospital, in collaboration with a colleague William Draper, published
an article in the Chicago Medical Journal reporting three cases of pneumonia,
including a picture of a chart, “believing that the matter may prove of inter-
est the following cases are accompanied by a diagram, fac simile of the
tables of ‘Vital Signs,’ used at the bedside to make the daily record of tem-
perature, pulse-beats and respirations.” It is labeled: Record of Vital Signs
(Fig. 1.9).
In October of the same year, a report in the New York Medical Journal by
Austin Flint, professor of medicine at Bellevue Hospital Medical College,
described a similar chart developed by J.M. DaCosta, physician to the
Pennsylvania Hospital. Vital sign recording became a part of clinical prac-
tice at Bellevue and New York hospitals in 1867.
Sometime in the early 20th century, blood pressure became a vital sign.
The phenomenon occurred subtly, almost imperceptibly, and its inclusion
seemed to depend on the type of hospital and patient acuity. In charts of the
1950’s, sometimes blood pressure was included as a vital sign, sometimes
not. In almost all charts of the 1970’s, blood pressure was included as a vital
sign (although, interestingly, in many hospitals today it is not included with
the vital signs). Level-1 trauma hospitals used it, a phenomenon not unlike
what is happening with level of consciousness today.
16
Vital Signs and Resuscitation
1
Level of Consciousness
An interest in coma (Gr: deep sleep) began in the 1960’s. In 1966, A.K.
Ommaya in England described a five-point level of consciousness scale in a
Fig. 1.9. First Record of “Vital Signs”—1866. Reprinted with permission from: Seguin E.
The use of the thermometer in clinical medicine. Chic Med J 1866; 23:193.
17
History of the Vital Signs
1
study of head trauma. In 1968, a neurosurgical “watch sheet”, consisting of
7 parameters for evaluating clinical improvement/deterioration of brain-
injured patients: ability to move, pupillary reaction, nonverbal reaction to
pain, ability to awaken, speech, consciousness and vital signs, was published
in the Journal of Trauma by W.F. Bouzarth, a Pennsylvania neurosurgeon.
Also in 1968, a digital scale evaluating 9 levels of response was developed by
the Birmingham Accident Hospital in Leeds, England (see Fig. 9.1).
A significant development, in 1970, was a series of discussions between Fred
Plum, chief neurologist at New York Hospital and two neurosurgeons from
Glasgow University, Graham Teasdale and Bryan Jennett, about whether vari-
ous treatments made a difference in the outcomes of coma patients. A multi-
national investigation was undertaken to study the progress of comatose patients.
After reviewing 14 “responsiveness” or “coma” scales, Jennett and Teasdale
published “A Practical Scale” in The Lancet in 1974 analyzing three aspects
of behavior: motor response, verbal response and eye opening. Originally
graded from 3 to 14, a ‘best motor response’ later increased the maximum
score to 15, where it is now. This Glasgow Coma Scale (GCS) has served a
useful purpose for nearly three decades as a model for the evaluation of level
of consciousness not only from trauma, but from metabolic, vascular and
infectious causes as well (Fig 6.2).
Although the GCS was originally designed to evaluate deterioration and
improvement in coma, it has now become widely used for evaluation and
management of level of consciousness by EMTs and emergency personnel.
A Pediatric Glasgow Coma Scale has materialized. The GCS is an integral
part of the Revised Trauma Score and is a component of the CRAMS Scale
(see Figs. 6.3, 7.8, 7.9 and 9.3).
References
1. Anning S. Clifford Allbutt and the clinical thermometer. The Practitioner 1966;
197:818.
2. Benzinger T. Temperature, Part I: Arts and Concepts. Stroudsburg: Dowden,
Hutchinson & Ross, 1977.
3. Bloch H. Phenomena of respiration: Historical overview to the twentieth century.
Heart Lung 1987; 16:419.
4. Bolton H. Evolution of the Thermometer. Easton: The Chemical Publishing Co.,
1900:1592-1743.
5. Bouzarth W. Neurosurgical watch sheet for craniocerebral trauma. J Trauma
1968; 8:29.
6. Burch G, DePasquale N. A History of Electrocardiography. Chicago: Year Book
Medical Publishers, 1964.
7. Clark-Kennedy A. Stephen Hales—An Eighteenth Century Biography. Cambridge:
At the University Press, 1929.
8. Comroe J. The soul of wit. In: Retrospectroscope: Insights into Medical Discovery.
Menlo Park: Von Gehr Press, 1977.
9. Cournand A. Historical details of Claude Bernard. Trans NY Acad Sci 1, 1980.
10. Davis A. Medicine and its Technology. Westport: Greenwood Press, 1981.
18
Vital Signs and Resuscitation
1
11. Dominguez E et al. Adoption of thermometry into clinical practice in the United
States. Rev Inf Dis 1987; 9:1193.
12. Dominguez E, Musher D. Clinical thermometry. In: Mackowiak P, ed. Fever. New
York: Raven Press, 1991.
13. Estes J. Quantitative observations of fever and its treatment before the advent of
short clinical thermometers. Medical History 1991; 35:189.
14. Fishman A, Richards D. Circulation of the Blood, Men and Ideas. New York: Ox-
ford Univiversity Press, 1964.
15. Gauchat H, Katz L. Observations on pulsus paradoxus. Arch Intern Med 1924;
33:350.
16. Hering H. Die Karotidssinus Reflexe auf Herz und Gefaesse. Leipzig: D.
Steinkopff, 1927.
17. Hess W. Hypothalamus and Thalamus, Experimental Documentation. Stuttgart:
George Thieme, 1956.
18. Heymans C, Neil E. Reflexogenic Areas of the Cardiovascular System. London:
Churchill, 1958.
19. Hutchinson J. On the capacity of the lungs. Med Chir Trans 1846; 29:137.
20. Kussmaul A. Ueber schwielige Mediastino—Pericarditis und den Paradoxen Puls.
Berl Klin Wochenschr 1873; 10:37-39.
21. Kussmaul A. Jugenderinnerungen (Memoirs of an Old Physician). Stuttgart: Adolf
Bons and Co., 1899./Translated by W. Stewart/ The Israel program for scientific
translations, Jerusalem; New Delhi: Amerind Publishing Co., 1981.
22. Laennec R. Treatise on the Diseases of the Chest and on Mediate Auscultation.
New York: Samuel Wood & Sons, 1830.
23. Lyons A, Petrucelli J. Medicine: An Illustrated History. New York: Abradale Press/
Abrams, Inc., 1987.
24. Mackowiak P, Worden G, Carl Reinhold. August Wunderlich and the evolution of
clinical thermometry. Clin Inf Dis 1993; 18:458.
25. Magner L. A History of Medicine. New York: M Dekker, Inc., 1992.
26. Margotta R. The Story of Medicine. New York: Golden Press, 1968.
27. Middleton W. A History of the Thermometer. Baltimore: The Johns Hopkins
Press, 1966.
28. Mitchell S. The Early History of Instrumental Precision in Medicine. New York:
Lenox Hill Pub., 1892.
29. Musher D, Dominguez EA, Bar-Sela A. Edouard Seguin and the social power of
thermometry. N Engl J Med 1987; 316:115.
30. Ommaya A. Trauma to the nervous system. Ann Roy Coll Surg Engl 1966; 39:317.
31. Price D. Factors restricting the use of coma scales. Acta Neurochir Suppl 1986;
36:106.
32. Ranson S. Some functions of the hypothalamus. Bull NY Acad Med 1937; 13:241.
33. Seguin E. The use of the thermometer in clinical medicine. Chic Med J 1866;
23:193.
34. Seguin E. Opera Minora. New York: GP Putnam’s Sons, 1884.
35. Stein D. Historical perspective on fever and thermometry. Clin Ped (suppl) 1991.
36. Sternbach G. The Glasgow Coma Scale. J Em Med 2000; 19:67.
37. Teasdale G, Jennett B. Assessment of coma and impaired consciousness: A practical
scale. Lancet 1974; 2:81.
38. Teasdale G, Jennett B. Assessment and prognosis of coma after head injury. Acta
Neurochir 1976; 34:45.
39. West J. Best and Taylor’s Physiological Basis of Medical Practice. Baltimore: Will-
iams & Wilkins, 1991.
40. Wilbur C. Antique Medical Instruments. Atglen: Schiffer Pub., 1987.
19
History of the Vital Signs
1
41. Wilks S. The scale of Fahrenheit’s thermometer. Brit Med J 1900; 2:1212.
42. Wunderlich C. Das Verhalten der Eigenwarme in Krankheiten (The Behavior of
Body Temperature in Disease). London: New Sydenham Society, 1871.
43. Wunderlich C, Seguin E. Medical Thermometry and Human Temperature. New
York: William Wood & Co., 1871.
20 Vital Signs and Resuscitation
2
CHAPTER 2
Vital Signs and Resuscitation, by Joseph V. Stewart. ©2003 Landes Bioscience.
Vital Sign #1: Temperature
Man, other mammals and birds are “warm-blooded” (homeothermic—
Gr: unchanging temperature), meaning that although exposed to a variety
of temperatures the body remains at a certain warm temperature. Cells of
the body function optimally within a narrow range (97.7-100.4˚F/
36.5-38˚C), and mammals and birds have evolved a way of regulating the
internal temperature to stay within this span. In contrast, amphibians, rep-
tiles and fish (“cold-blooded” or poikilothermic—Gr: variable temperature)
possess less sophisticated regulatory systems, take on the temperature of the
environment and must take radical moves to avoid extremes of hot and cold
(actually “cold-blooded” is a misnomer, since frogs, snakes and fish have
warm blood).
The temperature regulatory center in man is the hypothalamus, an area
of the brain above the pituitary gland which acts as a thermostat to maintain
the body’s internal, or core, temperature at a range of about 97-99.8˚F/
36.1-37.7˚C (Figs. 2.1, 2.2).
Heat Production and Loss
The body strives to maintain a balance between heat production and
loss. Heat is produced by muscular activity and cell metabolism. It is lost by
radiation, evaporation, conduction and convection. Radiation, the loss of
heat in the form of infrared waves, accounts for 60% of body heat loss.
Sweating and evaporation account for 25% of body heat loss. Conduction,
the transfer of heat from one object to another of lower temperature, and
convection, the removal of heat by air currents, are not significant sources of
heat loss.
Perception of and Reaction to Hot and Cold
Perception of Hot and Cold
Perception of hot and cold is by way of warm and cold receptor neurons
in the hypothalamus. A change in the temperature of blood flowing through
the hypothalamus activates mechanisms to stabilize body temperature. In
addition, warm and cold receptors in the skin and elsewhere send messages
to the hypothalamus to modify the temperature. Temperature and pain fibers
of the lateral spinothalamic tract run to the thalamus, and from there via the
21Vital Sign #1: Temperature
2
Fig. 2.1. Centigrade/Fahrenheit
scales.
thalamic radiation to the postcentral gyrus of the parietal lobe of the cere-
bral cortex. Connections exist between the postcentral gyrus, the thalamus,
the reticular formation and the hypothalamus.
Reaction to Cold
Blood vessels are innervated by sympathetic fibers of the autonomic ner-
vous system, with hypothalamic connections. When it is cold, sympathetic
fibers are stimulated and vessels constrict (vasoconstriction), conserving heat.
22 Vital Signs and Resuscitation
2
The person becomes more active (i.e., pacing, arm movements). Signals are
relayed down the spinal cord via the lateral columns and muscle tone is
increased. As the tone rises, involuntary contraction and twitching occur
(shivering). Shivering may increase body-heat to five times normal.
Reaction to Heat
When it is hot, sympathetic stimulation to vessels is inhibited and vessels
widen (vasodilation). Core body heat as sweat, an ultrafiltrate of blood, moves
through dilated vessels and sweat glands to skin, where evaporation takes
place. Body activity decreases to prevent unnecessary heat production. When
an adult is not sweating, about 700 ml of body water is lost from the skin
and lungs by evaporation each day (insensible water loss). On a hot day, an
active person may lose over a liter of fluid per hour by sweating. In a humid
environment, poor evaporation causes body heat to remain high, contribut-
ing to heat illness.
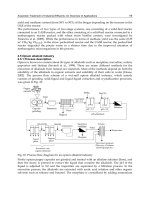
Fig. 2.2. Hypothalamus.
Brainstem
Hypothalamus
Pituitary
23Vital Sign #1: Temperature
2
Acclimatization
Acclimatization is the adaptation of the body to continuous heat or cold
over several weeks. In man, heat adaptation is more developed than cold
adaptation. Aerobic capacity increases. In a hot environment, heat produc-
tion decreases and heat loss increases for a given amount of work. Sweat
production may increase to 2 liters per hour. Increased aldosterone secretion
causes decreased salt loss. In a cold environment, heat production may be
increased by 10%.
Body Temperature
The concept of a “normal” body temperature is frequently reevaluated.
In spite of new instruments and studies, the results remain fairly constant.
Minor differences exist because of genetics, sex, age and body size. No two
studies agree on the range of normal oral, rectal and core temperatures.
However, as Wunderlich implied, some increases and decreases should prob-
ably be included in the normal physiological range. Current evidence indi-
cates that:
1. The normal core temperature range, verified by indwelling cath-
eters in the esophagus, urinary bladder, pulmonary artery and tym-
panic cavity, is from about 97.0-99.8˚F (36.1—37.7˚C). Slightly
higher or lower normal temperatures exist.
2. Oral and axillary temperatures parallel the core range. Occasion-
ally the readings are 1-2˚F (0.5-1.1˚C) lower than core. Low read-
ings may reflect user error. A recent study has suggested that the
mean oral temperature is 98.2˚F (36.8˚C), not 98.6˚F (37˚C). Al-
though axillary temperatures were the first used clinically, they have
become unreliable and must be verified by another method (see
next section, and Chapter 9).
3. Rectal temperatures parallel the core range. Readings are some-
times erratic, and are occasionally 1-2˚F (0.5-1.1˚C) higher than core.
4. A 0.1-2.4˚F (0.05-1.3˚C) diurnal range is present, with a low at 6
AM and a high at 6 PM.
5. Temperatures may drop to 97˚F (36.1˚C) during sleep and in cold
weather. Hot weather or strenuous activity may raise the tempera-
ture to 101-102˚F (38.3-38.9˚C).
6. Pediatric temperatures fluctuate, but generally parallel adult readings.
Methods of Temperature Measurement
The Mercury-glass thermometer is the standard to which other methods
of thermometry are compared. Today in most clinical circumstances elec-
tronic thermometers with digital displays and disposable sleeves are used. A
beep or the cessation of blinking indicates the reading. The device does not
measure tissue temperature, as does the glass thermometer, but rather the
24 Vital Signs and Resuscitation
2
temperature of the probe after contact with target tissue. It does not wait for
an equilibrium between the probe and target tissue; rather, it predicts the
equilibrium temperature with algorithmic calculations. Although subject to
error, it has proved reliable.
Oral
The probe should be under the tongue touching the sublingual gland
with the mouth tightly closed for at least 4 minutes with the glass thermom-
eter and an appropriate amount of time for the electronic probe. Factors
affecting an oral temperature include rapid breathing, the ingestion of hot
or cold beverages, and incorrect placement of the thermometer tip.
Axillary
The axillary temperature requires a closed axilla for 10 minutes before
placement of the thermometer or electronic probe, and four minutes is
required after placement. Because of the potential for error this is usually
impractical. It is used in the trauma patient when other sites are unavailable,
and occasionally in pediatrics (see Chapter 7).
Rectal
The rectal temperature is often avoided because of patient discomfort and
the extra effort required. Minimal problems occur if the probe is well lubri-
cated. The rectal temperature is least influenced by error. The patient is posi-
tioned on the left side with the right thigh and knee flexed. Small children and
infants are positioned on their backs and the thighs and knees are flexed while
they are held. Children can sometimes be held on their hands and knees. The
probe or thermometer is inserted 1-1/2 inches for adults, 1 inch for children, 1/
2 inch for infants, and the thermometer is read in 3 minutes. Contraindications
are hemorrhoids and rectal disease. Rectal temperatures may be hazardous in
newborns because of the possibility of perforation.
Vaginal
The vaginal temperature, similar to the rectal range, is used when other
sites are unavailable, as in trauma. It is contraindicated in the last trimester
of pregnancy and in uterine and vaginal disease.
Tympanic
The tympanic thermometer assesses infrared emissions from the tym-
panic cavity. A heat-sensitive probe, covered by a disposable plastic specu-
lum or a plastic-wrap type of material, is inserted into the auditory canal,
similar to how one uses an otoscope. The scan button is pressed, the signal is
digitized through a computerized processor, and in 2 seconds the tempera-
ture is displayed on a small liquid-crystal screen. The probe must make a
tight seal in the auditory canal or the reading will be in error. It is useful in
25Vital Sign #1: Temperature
2
the pediatric population, and in situations such as a wired jaw, the multiple
trauma patient, the obtunded elderly and the comatose patient. The only
contraindication is extensive bilateral auricular malformation/disease. Otitis
externa or media are not contraindications. Controversies regarding use and
evaluation of the instrument are discussed in Chapter 9 (Fig. 2.3).
Other
Other areas are used from time to time, such as forehead temperatures in
children. Plastic strips had been used, but were considered unreliable. Recently
a forehead temporal artery device was evaluated but was also considered
clinically unacceptable.
Fig. 2.3. Tympanic Thermometer.
26 Vital Signs and Resuscitation
2
High Temperature
Hyperthermia occurs when heat production exceeds heat loss. It is a
failure of the body’s heat dissipating mechanisms and is often seen in the
unacclimatized individual, particularly the elderly. Occasionally an adverse
genetic predisposition to certain drugs will cause hyperthermia. Fever, on
the other hand, does not involve exposure to heat but rather is the reaction
of the body to infection (occasionally other causes). It rarely involves failure of
the heat dissipating mechanisms unless the temperature is high and prolonged.
Fever
Fever is present when the core temperature is about 100˚F (37.8˚C) (99˚F/
37.2˚C in AM, 100˚F/37.8˚C in PM). The hypothalamus maintains the
internal or core temperature at a set point of about 97-99.8˚F (36.1-37.7˚C).
Fever resets the set point to a higher degree. Thus, even though the body is
hot, it feels cold because the set-point has been raised. Mechanisms to con-
serve heat, such as vasoconstriction and shivering, are activated (Fig. 2.4).
Bacteria, viruses, phagocytized breakdown products and toxins stimulate
monocytes and macrophages to release endogenous pyrogenic cytokines.
Antigen-antibody complexes, metabolites and dead tissue sometimes evoke
the same response. The main pyrogenic cytokines are interleukin-1,
interleukin-2 and tumor necrosis factor. These cytokines induce formation
of a prostaglandin (PGE-2) in the temperature center (thermoregulatory
center) of the hypothalamus. Prostaglandin resets the normal set point
(~98.6˚F) to a higher degree.
The majority of fevers are caused by infection, but some are the result of
malignancy, stroke and an assortment of allergic and autoimmune disorders.
In the typical case, microorganisms are killed, antibody production, an
important facet of the immune response, is enhanced and white blood cells
show increased phagocytic activity.
Since fever activates mechanisms that increase metabolism and heat pro-
duction, there is an increase in heart rate, respiratory rate and blood pressure
(primarily systolic). The heart rate is elevated by about 9-10 beats for each
degree Fahrenheit increase in temperature. The mental status is sometimes
affected but brain damage does not occur unless symptoms of heat stroke
appear (sustained temperature over 106˚F/41.1˚C), or meningo-encephali-
tis is also present.
Antifever drugs (antipyretics) such as aspirin, acetaminophen (Tylenol)
and nonsteroidal anti-inflammatory drugs such as ibuprofen (Advil, Motrin)
and naproxen (Naprosyn, Anaprox) act on the hypothalamus by blocking
prostaglandin synthesis. Steroids block both prostaglandins and endogenous
pyrogen, but are weak antipyretics.
27Vital Sign #1: Temperature
2
Antipyretics are routinely administered for fever, although the increase in
temperature is a primary defense against infection. The body raises the set-
point to kill microorganisms which survive poorly in a hot environment. As
the temperature increases, phagocytic activity and antibody production in-
crease. When the temperature falls after the administration of antipyretics,
phagocytic activity and antibody production decrease. Recent studies have
shown that the administration of antipyretic agents prolong the course of
infection. It is reasonable to use antipyretics to treat uncomfortable patients
and those with temperatures approaching hyperthermia (105˚F, 40.6˚C) (use
of antipyretics in pediatrics is discussed in Chapter 7, and the controversy is
further examined in Chapter 9).
Heat Stroke
Heat stroke is a failure of the body to rid itself of heat. In this condition,
heat-loss mechanisms fail in response to increased environmental tempera-
ture. It differs from fever in that there is no release of endogenous pyrogen
or resetting of the hypothalamic set-point. It is seen in those whose heat
Fig. 2.4. Mechanisms of Fever.