Financial management and analysis phần 7 pptx
Bạn đang xem bản rút gọn của tài liệu. Xem và tải ngay bản đầy đủ của tài liệu tại đây (1.7 MB, 103 trang )
604 FINANCING DECISIONS
the result is a net operating loss. The firm does not have to pay taxes in the
year of the loss and may “carry” this loss to another tax year.
This loss may be applied against previous years’ taxable income (with
some limits). The previous years’ taxes are recalculated and a refund of
taxes previously paid is requested. If there is insufficient previous years’
taxable income to apply the loss against, any unused loss is carried over
into future years (with some limits), reducing future years’ taxable income.
8
Therefore, when interest expense is larger than income before interest,
the tax shield is realized immediately—if there is sufficient prior years’ tax-
able income. If prior years’ taxable income is insufficient (that is, less than
the operating loss created by the interest deduction), the tax shield is less
valuable because the financial benefit is not received until some later tax
year (if at all). In this case, we discount the tax shield to reflect both the
uncertainty of benefitting from the shield and the time value of money.
To see how an interest tax shield may become less valuable, let’s
suppose The Unfortunate Firm has the following financial results:
Suppose further that the Unfortunate Firm has the following result for
Year 4:
8
The tax code provisions, with respect to the number of years available for net op-
erating loss carrybacks and carryovers, has changed frequently. For example, under
the Tax Reform Act of 1986, the code permits a carryback for three previous tax
years and a carryforward for fifteen future tax years [IRC Section 172 (b), 1986
Code].
The Unfortunate Firm
Year 1 Year 2 Year 3
Taxable income before interest $7,000 $8,000 $6,000
Interest expense 5,000
5,000 5,000
Taxable income $2,000 $3,000 $1,000
Tax rate 0.40
0.40 0.40
Tax paid $800 $1,200 $400
The Unfortunate Firm
Operating Results for Year 4
Taxable income before interest $1,000
Less: Interest expense 8,000
Net operating loss −$7,000
18-CapitalStructure Page 604 Wednesday, April 30, 2003 11:51 AM
Capital Structure 605
Suppose the tax code permits a carryback of three years and a carry-
over of 15 years. Unfortunate Firm can take the net operating loss of
$7,000 and apply it against the taxable income of previous years, begin-
ning with Year 1:
By carrying back the part of the loss, the Unfortunate Firm has
applied $6,000 of its Year 4 loss against the previous years’ taxable
income: $2,000(Year 1) + 3,000(Year 2) + 1,000(Year 3) and receives a
tax refund of $2,400 (= $800 + 1,200 + 400). There remains an unused
loss of $1,000 ($7,000 − $6,000). This loss can be applied toward
future tax years’ taxable income, reducing taxes in future years. But
since we don’t get the benefit from the $1,000 unused loss—the $1,000
reduction in taxes—until sometime in the future, the benefit is worth
less than if we could use it today.
The Unfortunate Firm, with an interest deduction of $8,000, bene-
fits from $7,000 of the deduction; $1,000 against current income and
$6,000 against previous income. Therefore, the tax shield from the
$8,000 is not $3,200 (40% of $8,000), but rather $2,800 (40% of
$7,000), plus the present value of the taxes saved in future years. The
present value of the taxes saved in future years depends on:
1. the uncertainty that Unfortunate Firm will generate taxable income
and
2. the time value of money.
The Unfortunate Firm’s tax shield from the $8,000 interest expense is less
than what it could have been because the firm could not use all of it now.
The bottom line of the analysis of unused tax shields is that the ben-
efit from the interest deductibility of debt depends on whether or not the
firm can use the interest deductions.
The Unfortunate Firm
Calculation of Tax Refunds Based
on Year 4 Net Operating Loss
Year 1 Year 2 Year 3
Taxable income before interest $7,000 $8,000 $6,000
Interest expense 5,000
5,000 5,000
Taxable income—original $2,000 $3,000 $1,000
Application of Year 4 loss –2,000
–3,000 –1,000
Taxable income—recalculated $0 $0 $0
Tax due—recalculated $0 $0 $0
Refund of taxes paid $800 $1,200 $400
18-CapitalStructure Page 605 Wednesday, April 30, 2003 11:51 AM
606 FINANCING DECISIONS
CAPITAL STRUCTURE AND FINANCIAL DISTRESS
A firm that has difficulty making payments to its creditors is in financial
distress. Not all firms in financial distress ultimately enter into the legal
status of bankruptcy. However, extreme financial distress may very well
lead to bankruptcy. While bankruptcy is often a result of financial diffi-
culties arising from problems in paying creditors, some bankruptcy fil-
ings are made prior to distress, when a large claim is made on assets (for
example, class action liability suit).
Costs of Financial Distress
The costs related to financial distress without legal bankruptcy can take
different forms. For example, to meet creditors’ demands, a firm takes
on projects expected to provide a quick payback. In doing so, the finan-
cial manager may choose a project that decreases owners’ wealth or may
forgo a profitable project.
Another cost of financial distress is the cost associated with lost
sales. If a firm is having financial difficulty, potential customers may shy
away from its products because they may perceive the firm unable to
provide maintenance, replacement parts, and warranties. If you are
arranging your travel plans for your next vacation, do you want to buy
a ticket to fly on an airline that is in financial difficulty and may not be
around much longer? Lost sales due to customer concern represent a
cost of financial distress—an opportunity cost, something of value
(sales) that the firm would have had if it were not in financial difficulty.
Still another example of costs of financial distress are costs associated
with suppliers. If there is concern over the firm’s ability to meet its obliga-
tions to creditors, suppliers may be unwilling to extend trade credit or
may extend trade credit only at unfavorable terms. Also, suppliers may be
unwilling to enter into long-term contracts to supply goods or materials.
This increases the uncertainty that the firm will be able to obtain these
items in the future and raises the costs of renegotiating contracts.
The Role of Limited Liability
Limited liability limits owners’ liability for obligations to the amount
of their original investment in the shares of stock. Limited liability for
owners of some forms of business creates a valuable right and an inter-
esting incentive for shareholders. This valuable right is the right to
default on obligations to creditors—that is, the right not to pay credi-
tors. Because the most shareholders can lose is their investment, there is
an incentive for the firm to take on very risky projects: If the projects
turn out well, the firm pays creditors only what it owes and keeps the
18-CapitalStructure Page 606 Wednesday, April 30, 2003 11:51 AM
Capital Structure 607
rest, and if the projects turn out poorly, it pays creditors what it owes—
if there is anything left.
We can see the benefit to owners from limited liability by comparing
the Unlimited Company, whose owners have unlimited liability, to the
Limited Company, whose owners have limited liability. Suppose that the
two firms have the following identical capital structures in Year 1:
Owners’ equity—their investment—is $3,000 in both cases.
If the value of the assets of both firms in Year 2 are increased to
$5,000, the value of both debt and equity is the same for both firms:
Now suppose the total value of both firm’s assets in Year 2 is $500
instead of $5,000. If there are insufficient assets to pay creditors the
$1,000 owed them, the owners with unlimited liability must pay the dif-
ference (the $500); if there are insufficient assets to pay creditors the
$1,000 owed them, the owners with limited liability do not make up the
difference and the most the creditors can recover is the $500.
In this case, the Unlimited Firm’s owners must pay $500 to their
creditors because the claim of the creditors is greater than the assets
available to satisfy their claims. The Limited Company’s creditors do
Year 1
Unlimited Company Unlimited Company
Debt $1,000 $1,000
Equity 3,000 3,000
Total value of firm’s assets $4,000 $4,000
Year 2
Unlimited Company Unlimited Company
Debt $1,000 $1,000
Equity 4,000 4,000
Total value of firm’s assets $5,000 $5,000
Year 2
Unlimited Company Unlimited Company
Debt $1,000 $500
Equity –500
0
Total value of firm’s assets $ 500 $500
18-CapitalStructure Page 607 Wednesday, April 30, 2003 11:51 AM
608 FINANCING DECISIONS
not receive their full claim and since the owners are shielded by limited
liability, the creditors cannot approach the owners to make up the dif-
ference.
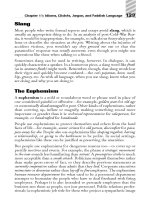
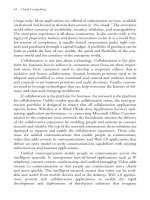
We can see the role of limited liability for a wider range of asset val-
ues by comparing the creditors’ and owners’ claims in Exhibit 18.8 for
the Unlimited Company (Panel a) and the Limited Company (Panel b).
The creditors make their claims at the expense of owners in the case of
the Unlimited Company for asset values of less than $1,000. If the value
of assets of the Unlimited Company is $500, the creditors recover the
remaining $500 of their claim from the owners’ personal assets (if there
are any such assets). In the case of Limited Company, however, if the
assets’ value is less than $1,000, the creditors cannot recover the full
$1,000 owed them—they cannot touch the personal assets of the owners!
The fact that owners with limited liability can lose only their initial
investment—the amount they paid for their shares—creates an incentive
for owners to take on riskier projects than if they had unlimited liabil-
ity: They have little to lose and much to gain. Owners of the Limited
Company have an incentive to take on risky projects since they can only
lose their investment in the firm. But they can benefit substantially if the
payoff on the investment is high.
For firms whose owners have limited liability, the more the assets
are financed with debt, the greater the incentive to take on risky
projects, leaving creditors “holding the bag” if the projects turn out to
be unprofitable. This is a problem: There is a conflict of interest between
shareholders’ interests and creditors’ interests. The investment decisions
are made by managers (who represent the shareholders) and, because of
limited liability, there is an incentive for managers to select riskier
projects that may harm creditors who have entrusted their funds (by
lending them) to the firm. The right to default is a call option: The own-
ers have the option to buy back the entire firm by paying off the credi-
tors at the face value of their debt. As with other types of options, the
option is more valuable, the riskier the cash flows.
However, creditors are aware of this and demand a higher return on
debt (and hence a higher cost to the firm).
9
The result is that sharehold-
ers ultimately bear a higher cost of debt.
9
Michael Jensen and William H. Meckling analyze the agency problems associated
with limited liability in their article “Theory of the Firm: Managerial Behavior,
Agency Costs and Ownership Structure,” Journal of Financial Economics (1976),
pp. 305–360. They argue that creditors are aware of the incentives the firm has to
take on riskier project. Creditors will demand a higher return and may also require
protective provisions in the loan contract.
18-CapitalStructure Page 608 Wednesday, April 30, 2003 11:51 AM
Capital Structure 609
EXHIBIT 18.8 Comparison of Claims for the Unlimited Company
Panel a: Claims on Assets: Unlimited Company
Panel b: Claims on Assets: Limited Company
18-CapitalStructure Page 609 Wednesday, April 30, 2003 11:51 AM
610 FINANCING DECISIONS
Bankruptcy and Bankruptcy Costs
When a firm is having difficulty paying its debts, there is a possibility
that creditors will foreclose (that is, demand payment) on loans, causing
the firm to sell assets which could impair or cease operations. But if
some creditors force payment, this may disadvantage other creditors. So
what has developed is an orderly way of dealing with the process of the
firm paying its creditors—the process is called bankruptcy.
Bankruptcy in the United States is governed by the Bankruptcy
Code, created by the Bankruptcy Reform Act of 1978. A firm may be
reorganized under Chapter 11 of this Code, resulting in a restructuring
of its claims, or liquidated under Chapter 7.
10
Chapter 11 bankruptcy provides the troubled firm with protection
from its creditors while it tries to overcome its financial difficulties. A
firm that files bankruptcy under Chapter 11 continues as a going con-
cern during the process of sorting out which of its creditors get paid and
how much. On the other hand, a firm that files under bankruptcy Chap-
ter 7, under the management of a trustee, terminates its operations, sells
its assets, and distributes the proceeds to creditors and owners.
We can classify bankruptcy costs into direct and indirect costs. Direct
costs include the legal, administrative, and accounting costs associated
with the filing for bankruptcy and the administration of bankruptcy.
These costs are estimated to be 6.2% of the value of the firm prior to
bankruptcy.
11
For example, the fees and expenses for attorneys represent-
ing shareholders and creditors’ committees in the Texaco bankruptcy
were approximately $21 million.
12
The indirect costs of bankruptcy are more difficult to evaluate. Oper-
ating a firm while in bankruptcy is difficult, since there are often delays
in making decisions, creditors may not agree on the operations of the
firm, and the objectives of creditors may be at variance with the objective
of efficient operation of the firm. One estimate of the indirect costs of
bankruptcy, calculated by comparing actual and expected profits prior to
bankruptcy, is 10.5% of the value of the firm prior to bankruptcy.
13
10
Bankruptcy Reform Act of 1978, Public Law No. 95-598.92 Stat. 2549 (1978).
11
The direct cost is taken from the study by Edward I. Altman, “A Further Empirical
Investigation of the Bankruptcy Cost Question,” Journal of Finance (September
1984), pp. 1067–1089, based on his study of industrial firms. An earlier study
[Jerold B. Warner, “Bankruptcy Costs: Some Evidence,” Journal of Finance (May
1977), pp. 337–347], estimated the direct costs of bankruptcy to be approximately
5% of the prebankruptcy market value of the firm.
12
Wall Street Journal (June 2, 1988), p. 25.
13
The indirect cost estimate is taken from Altman, “A Further Empirical Investiga-
tion,” p. 1077.
18-CapitalStructure Page 610 Wednesday, April 30, 2003 11:51 AM
Capital Structure 611
Another indirect cost of bankruptcy is the loss in the value of cer-
tain assets. Because many intangible assets derive their value from the
continuing operations of the firm, the disruption of operations during
bankruptcy may change the value of the firm. The extent to which the
value of a business enterprise depends on intangibles varies among
industries and among firms; so the potential loss in value from financial
distress varies as well. For example, a drug company may experience a
greater disruption in its business activities, than say, a steel manufac-
turer, since much of the value of the drug company may be derived from
the research and development that leads to new products.
Financial Distress and Capital Structure
The relationship between financial distress and capital structure is simple:
As more debt financing is used, fixed legal obligations increase (interest
and principal payments), and the ability of the firm to satisfy these
increasing fixed payments decreases. Therefore, as more debt financing is
used, the probability of financial distress and then bankruptcy increases.
For a given decrease in operating earnings, a firm that uses debt to a
greater extent in its capital structure (that is, a firm that uses more
financial leverage), has a greater risk of not being able to satisfy the debt
obligations and increases the risk of earnings to owners.
Another factor to consider in assessing the probability of distress is
the business risk of the firm. Business risk is the uncertainty associated
with the earnings from operations. Business risk is uncertainty inherent
in the type of business and can be envisioned as being comprised of sales
risk and operating risk.
Sales risk is the risk associated with sales as a result of economic and
market forces that affect the volume and prices of goods or services sold.
Operating risk is the risk associated with the cost structure of the
business firm’s assets. A cost structure is comprised of both fixed and vari-
able costs. The greater the fixed costs relative to variable costs, the greater
the operating risk. If sales were to decline, the greater the fixed costs in the
operating cost structure the more exaggerated the effect on operating earn-
ings. When an airline flies between any two cities, most of its costs are the
same whether there is one passenger or one hundred passengers. Its costs
are mostly fixed (fuel, pilot, gate fees, etc.), with very little in the way of
variable costs (the cost of the meal). Therefore, an airline’s operating earn-
ings are very sensitive to the number of tickets sold.
The effect of the mixture of fixed and variable costs on operating
earnings is akin to the effect of debt financing (financial leverage) on earn-
ings to owners. Here it is referred to as operating leverage: The greater
the fixed costs in the operating cost structure, the greater the leveraging
18-CapitalStructure Page 611 Wednesday, April 30, 2003 11:51 AM
612 FINANCING DECISIONS
effect on operating earnings for a given change in sales. The greater the
business risk of the firm, the greater the probability of financial distress.
Our concern in assessing the effect of distress on the value of the firm
is the present value of the expected costs of distress. And the present
value depends on the probability of financial distress: The greater the
probability of distress, the greater the expected costs of distress.
The present value of the costs of financial distress increase with the
increasing relative use of debt financing since the probability of distress
increases with increases in financial leverage. In other words, as the debt
ratio increases, the present value of the costs of distress increases, less-
ening some of the value gained from the use of tax deductibility of inter-
est expense.
Summarizing the factors that influence the present value of the cost
of financial distress:
1. The probability of financial distress increases with increases in business
risk.
2. The probability of financial distress increases with increases in financial
risk.
3. Limited liability increases the incentives for owners to take on greater
business risk.
4. The costs of bankruptcy increase the more the value of the firm
depends on intangible assets.
We do not know the precise manner in which the probability of dis-
tress increases as we increase the debt-to-equity ratio. Yet, it is reasonable
to think that the probability of distress increases as a greater proportion
of the firm’s assets are financed with debt.
PUTTING IT ALL TOGETHER
As a firm increases the relative use of debt in the capital structure, its
value also increases as a result of the tax shield of interest deductibility.
However, this benefit is eventually offset by the expected costs of finan-
cial distress. Weighing the value of the tax shield against the costs of
financial distress, we can see that there is some ratio of debt to equity
that maximizes the value of the firm. Because we do not know the pre-
cise relationship between the tax shield and distress costs, we cannot
specify for a given firm what the optimal debt-to-equity ratio should be.
And although we have not yet considered other factors that may play a
role in determining the value of the firm, we can say:
18-CapitalStructure Page 612 Wednesday, April 30, 2003 11:51 AM
Capital Structure 613
■ The benefit from the tax deductibility of interest increases as the debt-
to-equity ratio increases.
■ The present value of the cost of financial distress increases as the debt-
to-equity ratio increases.
This “tradeoff” between the tax deductibility of interest and the
cost of distress can be summarized in terms of the value of the firm in
the context of the Modigliani and Miller model:
The value of the firm is affected by taxes and the costs of financial
distress. As a firm uses more debt financing relative to equity financing,
its value is increased. And the costs associated with financial distress
(both direct and indirect costs) reduce the value of the firm as financial
leverage is increased. Hence, this is the tradeoff between the tax deduct-
ibility of interest and the costs of financial distress.
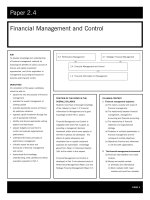
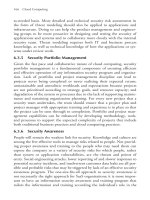
These considerations help to explain the choice between debt and
equity in a firm’s capital structure. As more debt is used in the capital
structure, the benefit from taxes increases the firm’s value, while the det-
riment from financial distress decreases its value. This tradeoff is illus-
trated in the three graphs in Exhibit 18.9, in which the value of the firm
is plotted against the debt ratio.
Case 3 is the most comprehensive (and realistic) case. At moderate
levels of financial leverage (low debt ratios), the value contributed by
tax shields more than offsets the costs associated with financial distress.
At some debt ratio, however, the detriment from financial distress may
outweigh the benefit from corporate taxes, reducing the value of the
firm as more debt is used. Hence, the value of the firm increases as more
debt is taken on, up to some point, and then decreases.
At that point, the value of the firm begins to diminish as the proba-
bility of financial distress increases, such that the present value of the
costs of distress outweigh the benefit from interest deductibility. The
Case 1: No interest tax deductibility, and no costs of financial distress
(panel a of Exhibit 18.9).
Case 2: Tax deductibility of interest, but no costs of financial distress
(panel b of Exhibit 18.9).
Case 3: Tax deductibility of interest and costs of financial distress
(panel c of Exhibit 18.9).
Value of the firm Value of the firm if all-equity financed=
Present value of the interest tax shield+
Present value of financial distress–
18-CapitalStructure Page 613 Wednesday, April 30, 2003 11:51 AM
614 FINANCING DECISIONS
mix of debt and equity that maximizes the value of the firm is referred
to as the optimal capital structure. This is the point where the benefit
from taxes exactly offsets the detriment from financial distress. The
optimal capital structure is that mix of debt and equity that produces
the highest value of the firm.
EXHIBIT 18.9 The Value of the Firm under Different Tax and Financial Distress
Scenarios
Case 1: The Value of the Firm Assuming No Interest Deductibility and No Costs of
Financial Distress
Case 2: The Value of the Firm Assuming Interest Deductibility, but No Costs of Fi-
nancial Distress
18-CapitalStructure Page 614 Wednesday, April 30, 2003 11:51 AM
Capital Structure 615
Exhibit 18.9 (Continued)
Case 3: The Value of the Firm Assuming Interest Deductibility and Costs of Financial
Distress
At first glance, the value enhancement from tax shields appears sim-
ple to calculate: Multiply the corporate tax rate times the face value of
debt. However, it is not that simple, for many reasons. The use of the τD
for valuation assumes:
1. A constant marginal corporate tax rate;
2. Refinancing debt at current interest rates; and
3. The firm will earn sufficient taxable income (before interest payments)
to be able to use the interest deduction.
Marginal corporate tax rates change periodically, at the discretion
of Congress. Interest rates change over time; it is therefore unlikely that
refinancing in, say, 20 years will be at current interest rates. Further, you
cannot always predict that a company will generate future income that
will be sufficient to cover the interest expenses.
And the expected costs of financial distress are difficult to calculate.
You cannot simply look at a firm and figure out the probability of dis-
tress for different levels of financial leverage. The probability of distress
at different levels of debt financing may differ among firms, dependent
upon their business risk. The costs of distress are also difficult to mea-
sure. These costs will differ from firm to firm, depending on the type of
asset (that is, intangibles versus tangibles) and the nature of the firm’s
supplier and customer relationships.
18-CapitalStructure Page 615 Wednesday, April 30, 2003 11:51 AM
616 FINANCING DECISIONS
RECONCILING THEORY WITH PRACTICE
So what good is this analysis of the tradeoff between the value of the
interest tax shields and the costs of distress if we cannot apply it to a
specific firm? While we cannot specify a firm’s optimal capital structure,
we do know the factors that affect the optimum. The analysis demon-
strates that there is a benefit from taxes but, eventually, this benefit may
be reduced by costs of financial distress.
Capital Structures among Different Industries
The analysis of the capital structure tradeoff leaves us with several finan-
cial characteristics of firms that affect the choice of capital structure:
■ The greater the marginal tax rate, the greater the benefit from the inter-
est deductibility and, hence, the more likely a firm is to use debt in its
capital structure.
■ The greater the business risk of a firm, the greater the present value of
financial distress and, therefore, the less likely the firm is to use debt in
its capital structure.
■ The greater extent that the value of the firm depends on intangible
assets, the less likely it is to use debt in its capital structure.
It is reasonable to expect these financial characteristics to differ
among industries, but be similar within an industry. The marginal tax
rate should be consistent within an industry since:
■ The marginal tax rates are the same for all profitable firms.
■ The tax law provides specific tax deductions and credits (for example,
depreciation allowances and research and development credits) that
creates some differences across industries, but generally apply to all
firms within an industry since the asset structure and the nature of
investment is consistent within an industry.
■ The firms in an industry are subject to the same economic and market
forces that may cause tax shields to be unusable. Therefore, it is rea-
sonable to assume that capital structures should be similar within
industry groups.
Capital Structures within Industries
The capital structures among firms within industries differ for several
possible reasons.
First, within an industry there may not be a homogeneous group of
firms. For example, Ben and Jerry’s, Brach’s Candy, and Sara Lee Corpo-
ration are all considered members of the food product industry, but they
18-CapitalStructure Page 616 Wednesday, April 30, 2003 11:51 AM
Capital Structure 617
have quite different types of business risk. The problem of industry
groupings is exacerbated by the recent acquisitions boom—many indus-
tries now include firms with dissimilar product lines.
Adding to the difficulty in comparing firms is the Financial Stan-
dards Accounting Board (FASB) requirement that firms consolidate the
accounting data of majority-owned subsidiaries.
14
The capital structure
of the automobile manufacturers (for example, General Motors and
Ford Motor Company) look quite different when the financing subsid-
iaries are included in the calculation of their debt ratios.
Another reason an industry may appear to comprise firms having
different capital structures is the way the debt ratio is calculated. We
can see this in Exhibit 18.10 where the debt to market value of equity
ratios are shown alongside the debt to book value of equity ratios for
firms in the amusement industry.
15
With book value of equity, the debt
ratio ranges from 1.405 to 34.432 times in the automotive industry,
whereas the debt ratios using the market value of equity ranges from
0.106 to 15.677 times.
Tradeoff Theory and Observed Capital Structures
The tradeoff theories can explain some of the capital structure varia-
tions that we observe. Firms whose value depends to a greater extent on
intangibles, such as in the semiconductor and drug industries, tend to
have lower debt ratios. Firms in volatile product markets, such as the
electronics and telecommunications industries, tend to have lower debt
ratios.
EXHIBIT 18.10
Comparison of Debt Ratios for a Sampling of Automotive
Companies
Source: Yahoo! Finance
14
Financial accounting Standards Board, Statement No. 94.
15
The book value of debt is used in the calculation of both ratios in the exhibit. This
is necessitated by the lack of current market value data on long-term debt.
Company
Debt to
Book Equity
Debt to
Market Equity
Debt to
Assets
DiamlerChryslerAG 4.318 4.867 77%
Ford Motor Company 34.432 15.677 97%
General Motors Corporation 1.544 14.699 94%
Toyota Motor Company 1.405 0.106 58%
18-CapitalStructure Page 617 Wednesday, April 30, 2003 11:51 AM
618 FINANCING DECISIONS
However, the tradeoff theories cannot explain all observed capital
structure behavior. We observe profitable firms in the drug manufacturing
industry that have no long-term debt. Though these firms do have a large
investment in intangibles, they choose not to take on any debt at all, even
though taking on some debt could enhance the value of their firms.
We also see firms that have high business risk and high debt ratios.
Firms in the air transportation industry experience a volatile product
market, with a high degree of operating leverage. Firms in this industry
must invest heavily in jets, airport gates, and reservations systems, and
have a history of difficulty with labor. However, these firms also have
high debt ratios, with upwards to 80% of their assets financed with
debt. One possible explanation for airlines taking on a great deal of
financial leverage on top of their already high operating leverage is that
their assets, such as jets and gates, can be sold quickly, offsetting the
effects of their greater volatility in operating earnings. Whereas the high
business risk increases the probability of financial distress, the liquidity
of their assets reduces the probability of distress. But hindsight tells us
more about the airline industry. The overcapacity of the industry just
prior to the recession of 1989–1991 meant that there wasn’t much of a
market for used jets and planes. The airlines suffered during this eco-
nomic recession: Of the 14 firms in existence just prior to 1989, four
firms entered bankruptcy (Continental, Pan Am, Midway, and America
West), and two were liquidated (Eastern Airlines and Braniff).
OTHER POSSIBLE EXPLANATIONS
Looking at the financing behavior of firms in conjunction with their div-
idend and investment opportunities, we can make several observations:
■ Firms prefer using internally generated capital (retained earnings) to
externally raised funds (issuing equity or debt).
■ Firms try to avoid sudden changes in dividends.
■ When internally generated funds are greater than needed for invest-
ment opportunities, firms pay off debt or invest in marketable securi-
ties.
■ When internally generated funds are less than needed for investment
opportunities, firms use existing cash balances or sell off marketable
securities.
■ If firms need to raise capital externally, they issue the safest security
first; for example, debt is issued before preferred stock, which is issued
before common equity.
18-CapitalStructure Page 618 Wednesday, April 30, 2003 11:51 AM
Capital Structure 619
The tradeoff among taxes and the costs of financial distress lead to
the belief that there is some optimal capital structure, such that the
value of the firm is maximized. Yet, it is difficult to reconcile this with
some observations in practice. Why?
One possible explanation is that the tradeoff analysis is incomplete.
We didn’t consider the relative costs of raising funds from debt and
equity. Because there are no out-of-pocket costs to raising internally
generated funds (retained earnings), it may be preferred to debt and to
externally raised funds. Because the cost of issuing debt is less than the
cost of raising a similar amount from issuing common stock (flotation
of 2.2% versus 7.1%), debt may be preferred to issuing stock.
Another explanation for the differences between what we observe
and what we believe should exist is that firms may wish to build up
financial slack, in the form of cash, marketable securities, or unused
debt capacity, to avoid the high cost of issuing new equity.
Still another explanation is that financial managers may be con-
cerned about the signal given to investors when equity is issued. It has
been observed that the announcement of a new common stock issue is
viewed as a negative signal, since the announcement is accompanied by
a drop in the value of the equity of the firm. It is also observed that the
announcement of the issuance of debt does not affect the market value
of equity. Therefore, the financial manager must consider the effect that
the new security announcement may have on the value of equity, and
hence, may shy away from issuing new equity.
The concern over the relative costs of debt and equity and the concern
over the interpretation by investors of the announcement of equity financ-
ing leads to a preferred ordering, or pecking order, of sources of capital:
first internal equity, then debt, then preferred stock, then external equity
(new common stock). A result of this preferred ordering is that firms prefer
to build up funds, in the form of cash and marketable securities, so as not
to be forced to issue equity at times when internal equity (retained earn-
ings) is inadequate to meet new profitable investment opportunities.
16
A CAPITAL STRUCTURE PRESCRIPTION
The analysis of the tradeoff and pecking order explanations of capital
structure suggests that there is no satisfactory explanation. What is
16
For a more complete discussion of the pecking order explanation, especially the
role of asymmetric information, see Stewart C. Myers, “The Capital Structure Puz-
zle,” Midland Corporate Finance Journal, Vol. 3, No. 3 (Fall 1985).
18-CapitalStructure Page 619 Wednesday, April 30, 2003 11:51 AM
620 FINANCING DECISIONS
learned from an examination of these possible explanations is that there
are several factors to consider in making the capital structure decision:
■ Taxes. The tax deductibility of interest makes debt financing attractive.
However, the benefit from debt financing is reduced if the firm cannot
use the tax shields.
■ Risk. Because financial distress is costly, even without legal bankruptcy,
the likelihood of financial distress depends on the business risk of the
firm, in addition to any risk from financial leverage.
■ Type of asset. The cost of financial distress is likely to be more for firms
whose value depends on intangible assets and growth opportunities.
■ Financial slack. The availability of funds to take advantage of profit-
able investment opportunities is valuable. Therefore, having a store of
cash, marketable securities, and unused debt capacity is valuable.
The financial manager’s task is to assess the business risk of the firm,
predicting the usability of tax deductions in the future, evaluating how
asset values are affected in the event of distress, and estimating the rela-
tive issuance costs of the alternative sources of capital. In the context of
all these considerations, the financial manager can observe other firms in
similar situations, using their decisions and consequences as a guide.
SUMMARY
■ Financial leverage is the use of fixed cost sources of funds. The effect of
using financial leverage is to increase both the expected returns and the
risk to owners.
■ Taxes provide an incentive to take on debt, since interest paid on debt
is a deductible expense for tax purposes, shielding income from taxa-
tion. But the possibility of incurring direct and indirect costs of finan-
cial distress discourages taking on high levels of debt.
■ Taxes and financial distress costs result in a tradeoff. For low debt
ratios, the benefit of taxes more than overcomes the present value of
the costs of financial distress, resulting in increases in the value of the
firm for increasing debt ratios. But beyond some debt ratio, the benefit
of taxes is overcome by the costs of financial distress; the value of the
firm decreases as debt is increased beyond this point.
■ An explanation for the capital structures that we observe is that firms
prefer to raise capital internally, but will raise capital externally accord-
ing to a pecking order from safe to riskier securities.
18-CapitalStructure Page 620 Wednesday, April 30, 2003 11:51 AM
Capital Structure 621
■ We cannot figure out the best capital structure for a firm. We can pro-
vide a checklist of factors to consider in the capital structure decision:
taxes, business risk, asset type, issuance costs, and investor interpreta-
tions of security issuance announcements.
QUESTIONS
1. What is financial leverage and how does it affect the risk associated
with future earnings to shareholders?
2. If the marginal tax rate on corporate income were to increase, what
do you expect to be the effect of this on the tax shield from interest
deductibility?
3. Consider three financing alternatives:
Alternative A: Finance solely with equity
Alternative B: Finance using 50% debt, 50% equity
Alternative C: Finance solely with debt
a. Which of the three alternatives involves the greatest financial
leverage?
b. Which of the three alternatives involves the least financial lever-
age?
4. List the potential costs associated with financial distress.
5. How does limited liability affect the incentives of shareholders to
encourage investment in riskier projects?
6. List the potential direct and indirect costs associated with bank-
ruptcy.
7. Shareholders may be viewed as having a call option on the firm.
What is this call option? Identify the elements of an option in the
context of the equity of a firm:
a. exercise price
b. expiration date
8. Explain why firms in the electric utility industry tend to have higher
debt ratios than firms classified as industrials.
9. Rank the following sources of capital in order of preference, accord-
ing to the pecking order explanation of capital structure:
■ Issue debt
■ Sell shares of stock
■ Retained earnings
10. What is financial slack? Why do firms wish to have financial slack?
18-CapitalStructure Page 621 Wednesday, April 30, 2003 11:51 AM
622 FINANCING DECISIONS
11. Consider the information on the three firms A, B, and C:
a. Calculate the debt ratio for each firm.
b. Calculate the debt-to-assets ratio for each firm.
12. The Chew-Z Corporation is considering three possible financing
arrangements to raise $10,000 of new capital. Currently, the capital
structure of Chew-Z consists of no debt and $10,000 of equity.
There are 500 shares of common stock currently outstanding, sell-
ing at $20 per share. The Chew-Z is expected to generate $12,000
of earnings before interest and taxes next period. It is expected that
the interest rate on any debt would be 10%. The three possible
financing alternatives are:
Alternative 1: Finance completely with new equity.
Alternative 2: Finance using 50% debt and 50% new equity.
Alternative 3: Finance completely with new debt.
a. Calculate the following items for each alternative, assuming that
there are no taxes on corporate income:
■ Earnings to owners
■ Earnings per share
■ Distribution of income between creditors and shareholders
b. Calculate the following items for each alternative, assuming that
the marginal rate of tax on corporate income is 40%:
■ Earnings to owners
■ Earnings per share
■ Distribution of income among creditors, shareholders, and the gov-
ernment
13. The financial manager of the Variable Corporation has looked into
the department’s crystal ball and estimated the earnings per share
for Variable under three possible outcomes. This crystal ball is a bit
limited, for it can only make projections regarding the earnings per
share and the probability that each will occur. Unfortunately, it can-
not tell the financial manager which of the three possible outcomes
will occur. The data provided by the crystal ball indicates:
Capital Firm A Firm B Firm C
Debt $1,000 $2,000 $3,000
Equity $3,000 $2,000 $1,000
18-CapitalStructure Page 622 Wednesday, April 30, 2003 11:51 AM
Capital Structure 623
Help the financial manager assess this data by calculating the
expected earnings per share and the standard deviation of earnings
per share for Variable Corporation.
14. Calculate the capitalization rate (discount rate) for equity for the
following three firms, D, E and F:
Assume that there are no corporate income taxes and that the
cost of equity for an unlevered firm is 10% and the cost of risk-free
debt is 6%
15. The I.O. Corporation has $10,000 of debt in its capital structure.
The interest rate on this debt is 10%. What is the present value of
the tax shield from interest deductibility if the tax rate on corporate
income is:
a. 0%?
b. 20%?
c. 40%?
d. 60%?
e. 80%?
16. The I.R.S. Corporation has $10,000 of debt in its capital structure.
The interest rate on this debt is 10%. What is the present value of
the tax shield from interest deductibility if the tax rate on corporate
income is 45%?
17. The Lou Zer Corporation generated a net operating loss of $5,000
in 2001. Assume that the current tax law allows the loss to be car-
ried back three years to reduce previous years’ taxes and that previ-
ous tax returns reveal the following information:
Economic Environment Probability Earnings per Share
Good 50% $10.00
OK 20% $5.00
Bad 30% $1.00
Capital Firm D Firm E Firm F
Debt $1,500 $1,000 $2,000
Equity $1,500 $2,000 $1,000
Tax Year Taxable Income Taxes Paid
2000 $1,000 $400
1999 $2,000 $800
1998 $3,000 $1,200
1997 $2,000 $800
18-CapitalStructure Page 623 Wednesday, April 30, 2003 11:51 AM
624 FINANCING DECISIONS
a. What is the amount of tax refund that Lou Zer can apply for as a
result of the 2001 loss?
b. How would your answer differ if the tax law permitted the loss to
be carried back only two years?
18. General Stuff is a food processing company that manufacturers a
wide variety of food products, including pasta, cereal, juice bever-
ages, and confectionery goods. In addition to food processing, Gen-
eral Stuff has acquired a small, regional restaurant chain within the
past year. The management of General Stuff believes that the most
profitable course would be to expand the restaurant chain to become
a major player in the national market. To do this, however, requires
cash—which General Stuff doesn’t have quite enough of right now.
General Stuff’s management has determined that it needs to raise $1
million in capital next year beyond the funds generated internally.
General Stuff had revenues of around $1.2 billion in the last fis-
cal year and revenues are expected to increase at a rate of 8% per
year for the next five years if the restaurant chain is expanded as
planned. The vast majority (80%) of the revenues are currently
from the food processing business, but it is expected that the restau-
rant chain will provide up to 40% of General Stuff’s revenues
within three years. General Stuff’s net profit margin last year was
5%, but the typical net profit margin for retail food businesses is
10%. General Stuff’s return on assets last year was 25% and return
on equity was 40%.
The beta (an indicator of an asset’s systematic risk) assigned to
General Stuff’s common stock by a major financial analysis service
was 1.2 prior to its acquisition of the restaurant chain. The beta was
revised upward slightly to 1.3 following this acquisition.
Other firms in the food processing industry have capital struc-
tures comprising 40% debt and 60% equity, though the use of debt
ranges from a low of 15% to a high of 72%. Firms in the retail food
industry have capital structures of 45% debt and 55% equity, rang-
ing from 35% to 70% debt.
a. Compare General Stuff’s capital structure with that of the industry.
b. Provide a recommendation for the amount of debt and equity
General Stuff should issue to support the expansion program.
List any assumptions you have made in your analysis. Briefly dis-
cuss additional information that would be useful in making a
recommendation.
18-CapitalStructure Page 624 Wednesday, April 30, 2003 11:51 AM
PART
Five
Managing Working Capital
Part5 Page 625 Wednesday, April 30, 2003 11:36 AM
Part5 Page 626 Wednesday, April 30, 2003 11:36 AM
CHAPTER
19
627
Management of Cash and
Marketable Securities
s we saw in Part Three, managers base decisions about investing in
long-term projects on judgments about future cash flows, the uncer-
tainty of those cash flows, and the opportunity costs of the funds to be
invested. As we turn in Part Five to the management of short-term
assets, we will see that such decisions are made in similar ways, but over
much shorter time horizons. Thus considerations of risk will take a
smaller role in our discussions in the next few chapters, while the oper-
ating cycle becomes more important.
Recall from our discussion in Chapter 6 that the operating cycle
refers to the time it takes to turn the investment of cash (e.g., buying
raw materials) back into cash (e.g., collecting on accounts receivables).
As our opening example shows, the operating cycle in part determines
how long it takes for a firm to generate cash from its short-term assets
and, therefore, the risk and cost of its investment in current assets, or
working capital. Working capital is the capital that managers can
immediately put to work to generate the benefits of capital investment.
Working capital is also known as current capital or circulating capital.
Firms invest in current assets for the same reason they invest in long-
term, capital assets: to maximize owners’ wealth. But because managers
evaluate current assets over a shorter time frame (less than a year), they
focus more on their cash flows and less on the time value of money.
How much should a firm invest in current assets? That depends on
several factors:
■
The type of business and product
■
The length of the operating cycle
A
19-MgmtCash_MarketSecs Page 627 Wednesday, April 30, 2003 12:08 PM
628 MANAGING WORKING CAPITAL
■
Customs, traditions, and industry practices
■
The degree of uncertainty of the business
The type of business, whether retail, manufacturing, or service,
affects how a firm invests. In some industries, large investments in
machinery and equipment are necessary. In other industries, such as
retail firms, less is invested in plant and equipment and other long-term
assets, and more is invested in current assets such as inventory.
The firm’s operating cycle—the time it takes the firm to turn its
investment in inventory into cash—affects how much the firm ties up in
current assets. The operating cycle comprises the time it takes to: manu-
facturer the goods, sell them and collect on their sale. The net operating
cycle considers the benefit from purchasing goods on credit; the net
operating cycle is the operating cycle less the number of days of pur-
chases. The longer the net operating cycle, the larger the investment in
current assets.
Let’s look at firms’ investments in current and noncurrent assets, as
summarized in Exhibit 19.1. As shown in Panel (a), approximately 30
to 40% of firms’ investment is in current assets. As we see in Panel (b),
within current assets, inventories are the largest investment, followed by
cash and cash equivalents. Firms that manufacture goods, such as steel,
tend to have more invested in long-term assets than, say, retail shoe
stores. Of the manufacturing firms, those with greater raw material
price uncertainty, such as the sugar and confectionery processors and
the beverage producers, tend to have more invested in current assets.
EXHIBIT 19.1
Asset Composition of U.S. Corporations
Panel a: Current versus Noncurrent Assets
19-MgmtCash_MarketSecs Page 628 Wednesday, April 30, 2003 12:08 PM