Financial management and analysis phần 9 ppsx
Bạn đang xem bản rút gọn của tài liệu. Xem và tải ngay bản đầy đủ của tài liệu tại đây (1.49 MB, 103 trang )
810 FINANCIAL STATEMENT ANALYSIS
The basic difference between NFCF and free cash flow is that the
financing expenses—interest and, in some cases dividends—are
deducted. If preferred dividends are perceived as nondiscretionary—that
is, investors come to expect the dividends—dividends may be included
with the interest commitment to arrive at net free cash flow. Otherwise,
dividends are deducted from net free cash flow to produce cash flow.
Another difference is that NFCF does not consider changes in working
capital in the analysis.
Further, cash taxes are deducted to arrive at net free cash flow. Cash
taxes is the income tax expense restated to reflect the actual cash flow
related to this obligation, rather than the accrued expense for the
period. Cash taxes are the income tax expense (from the income state-
ment) adjusted for the change in deferred income taxes (from the bal-
ance sheets).
15
For Procter & Gamble in 2002,
In the case of Procter & Gamble for 2002,
The free cash flow amount per this calculation differs from the $5,785
that we calculated earlier for two reasons: Changes in working capital and
the deduction of taxes on operating earnings were not considered.
Net cash flow gives the analyst an idea of the unconstrained cash
flow of the company. This cash flow measure may be useful from a cred-
itor’s perspective in terms of evaluating the company’s ability to fund
additional debt. From a shareholder’s perspective, net cash flow (i.e., net
Income tax expense $2,031
Deduct increase in deferred income tax (389)
Cash taxes $1,642
15
Cash taxes require taking the tax expense and either increasing this to reflect any
decrease in deferred taxes (that is, the payment this period of tax expense recorded
in a prior period) or decreasing this amount to reflect any increase in deferred taxes
(that is, the deferment of some of the tax expense).
EBIT $6,986
Add depreciation and amortization 1,693
Earnings before interest, taxes, depreciation, and amortization $8,679
Deduct capital expenditures (1,679)
Free cash flow $7,000
Deduct interest (603)
Deduct cash taxes (1,642)
Net free cash flow $4,755
Deduct cash common dividends (2,095)
Net cash flow $2,660
24-Cash Flows Page 810 Wednesday, April 30, 2003 12:15 PM
Cash Flow Analysis 811
free cash flow net of dividends) may be an appropriate measure because
this represents the cash flow that is reinvested in the company.
THE USEFULNESS OF CASH FLOWS IN FINANCIAL ANALYSIS
The usefulness of cash flows for financial analysis depends on whether
cash flows provide unique information or provide information in a man-
ner that is more accessible or convenient for the analyst. The cash flow
information provided in the statement of cash flows, for example, is not
necessarily unique because most, if not all, of the information is avail-
able through analysis of the balance sheet and income statement. What
the statement does provide is a classification scheme that presents infor-
mation in a manner that is easier to use and, perhaps, more illustrative
of the company’s financial position.
An analysis of cash flows and the sources of cash flows can reveal
information to the analyst, including:
■ The sources of financing the company’s capital spending. Does the com-
pany generate internally (i.e., from operations) a portion or all of the
funds needed for its investment activities? If a company cannot gener-
ate cash flow from operations, this may indicate problems up ahead.
Reliance on external financing (e.g., equity or debt issuance) may indi-
cate a company’s inability of to sustain itself over time.
■ The company’s dependence on borrowing. Does the company rely heavily
on borrowing that may result in difficulty in satisfying future debt ser-
vice?
■ The quality of earnings. Large and growing differences between income
and cash flows suggests a low quality of earnings.
Consider financial results of OEA, Inc., a manufacturer of propel-
lants and pyrotechnic devices (such as those used in air bags), as pre-
sented in Exhibit 24.6.
16
As we can see in this exhibit, both operating
income and net income are growing over time, with a slight interruption
of this growth in 1992. We can take off the “rose-colored glasses” of
income and look at cash flows to get a much different picture of the
company, as shown in Exhibit 24.7. As we can see in this exhibit, the
growth in investment expenditures has continued over time, yet the
company is less able to generate funds from operations; in fact, in 1997
OEA relied entirely on external financing. This difficulty is associated
with the recent concerns over air bags, the reengineering of air bags, and
16
OEA, Inc. was acquired in 2000 by Autoliv Inc.
24-Cash Flows Page 811 Wednesday, April 30, 2003 12:15 PM
812 FINANCIAL STATEMENT ANALYSIS
OEA’s heavy reliance on the airbags for its revenues (80%). OEA’s
recent financial challenges are not reflected in the income figures, but
are detected with an analysis of the sources of cash flows.
Ratio Analysis
One use of cash flow information is in ratio analysis, much like we did in
Chapter 4 primarily with the balance sheet and income statement infor-
mation. In that chapter we used a cash flow-based ratio, the cash flow
interest coverage ratio, as a measure of financial risk. There are a number
of other cash flow-based ratios that the analyst may find useful in evaluat-
ing the operating performance and financial condition of a company.
A useful ratio to help further assess a company’s cash flow is the cash
flow to capital expenditures ratio, or capital expenditures coverage ratio:
17
EXHIBIT 24.6 OEA Inc., Operating and Net Income 1988–1997
Source: OEA, Inc., Annual Reports, various years
17
The cash flow measure in the numerator should be one that has not already re-
moved capital expenditures; for example, including free cash flow in the numerator
would be inappropriate.
Cash flow to capital expenditures
Cash flow
Capital expenditures
=
24-Cash Flows Page 812 Wednesday, April 30, 2003 12:15 PM
Cash Flow Analysis 813
EXHIBIT 24.7 OEA, Inc., Sources of Cash Flows, 1988-1997
Source: OEA, Inc., Annual Reports, various years
This ratio gives the analyst information about the financial flexibil-
ity of the company and is particularly useful for capital-intensive firms
and utilities.
18
The larger the ratio, the greater the financial flexibility.
The analyst, however, must carefully examine the reasons why this ratio
may be changing over time and why it might be out of line with compa-
rable firms in the industry. For example, a declining ratio can be inter-
preted in two ways. First, the firm may eventually have difficulty adding
to capacity via capital expenditures without the need to borrow funds.
The second interpretation is that the firm may have gone through a
period of major capital expansion and therefore it will take time for rev-
enues to be generated that will increase the cash flow from operations to
bring the ratio to some normal long-run level.
Another useful cash flow ratio is the cash flow to debt ratio:
where debt can be represented as total debt, long-term debt, or a debt
measure that captures a specific range of maturity (e.g., debt maturing in 5
years). This ratio gives a measure of a company’s ability to meet maturing
debt obligations. A more specific formulation of this ratio is Fitch’s CFAR
18
Fridson, Financial Statement Analysis, p. 173.
Cash flow to debt
Cash flow
Debt
=
24-Cash Flows Page 813 Wednesday, April 30, 2003 12:15 PM
814 FINANCIAL STATEMENT ANALYSIS
ratio, which compares a company’s 3-year average net free cash flow to its
maturing debt over the next five years.
19
By comparing the company’s
average net free cash flow to the expected obligations in the near term (i.e.,
five years), this ratio provides information on the company’s credit quality.
Using Cash Flow Information
The analysis of cash flows provides information that can be used along
with other financial data to help the analyst assess the financial condi-
tion of a company. Consider the cash flow to debt ratio calculated using
three different measures of cash flow—EBITDA, free cash flow, and cash
flow from operations (from the statement of cash flows)—each com-
pared with long-term debt, as shown in Exhibit 24.8 for Weirton Steel.
This example illustrates the need to understand the differences
among the cash flow measures. The effect of capital expenditures in the
1988–1991 period can be seen by the difference between the free cash
flow measure and the other two measures of cash flow; both EBITDA
and cash flow from operations ignore capital expenditures, which were
substantial outflows for this company in the earlier period.
EXHIBIT 24.8
Cash Flow to Debt Using Alternative Estimates of Cash Flow for
Weirton Steel, 1988–1996
Source: Weirton Steel’s 10-K reports, various years
19
Daniel J. McConville, “Cash Flow Ratios Gains Respect as Useful Tool for Credit
Rating,” Corporate Cashflow Magazine (January 1996), p. 18.
24-Cash Flows Page 814 Wednesday, April 30, 2003 12:15 PM
Cash Flow Analysis 815
Cash flow information may help the analyst identify companies that
may encounter financial difficulties. Consider the study by Largay and
Stickney that analyzed the financial statements of W.T. Grant during the
1966–1974 period preceding its bankruptcy in 1975 and ultimate liqui-
dation.
20
They noted that financial indicators such as profitability
ratios, turnover ratios, and liquidity ratios showed some down trends,
but provided no definite clues to the company’s impending bankruptcy.
A study of cash flows from operations, however, revealed that company
operations were causing an increasing drain on cash, rather than pro-
viding cash.
21
This necessitated an increased use of external financing,
the required interest payments on which exacerbated the cash flow
drain. Cash flow analysis clearly was a valuable tool in this case since
W.T. Grant had been running a negative cash flow from operations for
years. Yet none of the traditional ratios discussed above take into
account the cash flow from operations. Use of the cash flow to capital
expenditures ratio and the cash flow to debt ratio would have high-
lighted the company’s difficulties.
More recently, Dugan and Samson examined the use of operating cash
flow as an early warning signal of a company’s potential financial prob-
lems.
22
The subject of the study was Allied Products Corporation because
for a decade this company exhibited a significant divergence between cash
flow from operations and net income. For parts of the period, net income
was positive while cash flow from operations was a large negative value.
In contrast to W.T. Grant that went into bankruptcy, the auditor’s report
in the 1991 Annual Report of Allied Products Corporation did issue a
going concern warning. Moreover, the stock traded in the range of $2 to
$3 per share. There was then a turnaround of the company by 1995. In its
1995 annual report, net income increased dramatically from prior periods
(to $34 million) and there was a positive cash flow from operations ($29
million). The stock traded in the $25 range by the Spring of 1996.
23
As
with the W.T. Grant study, Dugan and Samson found that the economic
realities of a firm are better reflected in its cash flow from operations.
20
J.A. Largay III and C.P. Stickney, “Cash Flows, Ratio Analysis and the W.T. Grant
Company Bankruptcy,” Financial Analysts Journal (July/August 1980), pp. 51–54.
21
For the period investigated, a statement of changes of financial position (on a
working capital basis) was required to be reported prior to 1988.
22
Michael T. Dugan and William D. Samson, “Operating Cash Flow: Early Indica-
tors of Financial Difficulty and Recovery,” Journal of Financial Statement Analysis
(Summer 1996), pp. 41–50.
23
As noted for the W.T. Grant study by Largay and Stickney, cash flow from oper-
ations had to be constructed from the statement of changes in financial positions that
companies were required to report prior to 1988.
24-Cash Flows Page 815 Wednesday, April 30, 2003 12:15 PM
816 FINANCIAL STATEMENT ANALYSIS
The importance of cash flow analysis in bankruptcy prediction is
supported by the study by Benjamin Foster and Terry Ward, who com-
pared trends in the statement of cash flows components—cash flow
from operations, cash flow for investment, and cash flow for financing—
between healthy companies and companies that subsequently sought
bankruptcy.
24
They observe that healthy companies tend to have rela-
tively stable relations among the cash flows for the three sources, cor-
recting any given year’s deviation from their norm within one year. They
also observe that unhealthy companies exhibit declining cash flows from
operations and financing and declining cash flows for investment one
and two years prior to the bankruptcy. Further, unhealthy companies
tend to expend more cash flows to financing sources than they bring in
during the year prior to bankruptcy. These studies illustrate the impor-
tance of examining cash flow information in assessing the financial con-
dition of a company.
SUMMARY
■ The term “cash flow” has many meanings and the analyst’s challenge is
to determine the cash flow definition and calculation that is appropri-
ate.
■ The simplest calculation of cash flow is the sum of net income and non-
cash expenses. This measure, however, does not consider other sources
and uses of cash during the period.
■ The statement of cash flows provides a useful breakdown of the
sources of cash flows: operating activities, investing activities, and
financing activities. Though attention is generally focused on the cash
flows from operations, the analyst must also examine what the com-
pany does with the cash flows (i.e., investing or paying off financing
obligations) and what are the sources of invested funds (i.e., operations
versus externally financing).
■ Minor adjustments can be made to the items classified in the statement
of cash flows to improve the classification.
■ The analyst can examine different patterns of cash flows to get a gen-
eral idea of the activities of the company. For example, a company
whose only source of cash flow is from investing activities, suggesting
the sale of property or equipment, may be experiencing financial dis-
tress.
24
Benjamin P. Foster and Terry J. Ward, “Using Cash Flow Trends to Identify Risks
of Bankruptcy,” The CPA Journal (September 1997), p. 60.
24-Cash Flows Page 816 Wednesday, April 30, 2003 12:15 PM
Cash Flow Analysis 817
■ Free cash flow is a company’s cash flow that remains after making cap-
ital investments that maintain the company’s current rate of growth. It
is not possible to calculate free cash flow precisely, resulting in many
different variations in calculations of this measure.
■ A company that generates free cash flow is not necessarily performing
well or poorly; the existence of free cash flow must be taken in context
with other financial data and information on the company.
■ One of the variations in the calculation of a cash flow measure is net
free cash flow, which is, essentially, free cash flow less any financing
obligations. This is a measure of the funds available to service addi-
tional obligations to suppliers of capital.
QUESTIONS
1. A temporary downturn in a company’s fortunes may be suggested
by the presence of a negative operating cash flow and positive cash
flows from investing and financing activities. Explain how these
cash flows may suggest a temporary financial problem.
2. Classify each of the following according to the statement of cash
flow activity (i.e., operating, investing, or financing):
a. Cash received from the issuance of bonds
b. Cash dividends paid
c. Cash from the sale of equipment
d. Cash paid for treasury stock
e. Cash received from the sale of inventory
3. Classify each of the following companies as mature, growing, or
downsizing based on these cash flows:
4. Consider the following statement: “Companies that consistently
generate free cash flows are good performing companies that will do
quite well in the future.” Is this statement true? Explain.
5. Explain briefly what is meant by cash flow, discretionary cash flow,
free cash flow, and net free cash flow. What are the distinguishing
characteristics of each of these measures?
Company
Cash Flow from
Operations
Cash Flow from (for)
Investing Activities
Cash Flow from (for)
Financing Activities
A $550,345,890 $(300,532,400) $(232,221,891)
B $33,114,893 $(145,231,879) $120,133,155
C $2,900,311 $3,000,200 $(5,444,656)
D $1,918,777 $(5,506,990) $3,899,231
24-Cash Flows Page 817 Wednesday, April 30, 2003 12:15 PM
818 FINANCIAL STATEMENT ANALYSIS
6. The following are adjustments to net income to arrive at cash flow
from operations from Kmart’s 1997 Consolidated Statement of
Cash Flows:
■ Asset impairment charges
■ Cash used for store restructuring and other charges
■ Decrease in other long-term liabilities
■ Cash used for discontinued operations
■ Loss on disposal of discontinued operations
Support the classification of these items as adjustments to arrive at
cash flows from operations or suggest and support a reclassification
to either the cash flows for investing or cash flows from financing.
7. Calculate the amount of free cash flow for Gap Inc., for the year
ended January 31, 1998. State any assumptions that you make in
your calculations.
Gap Inc., Statement of Cash Flows, in thousands
CASH FLOWS FROM OPERATING ACTIVITIES
Net earnings $53,901
Adjustments to reconcile net earnings to net cash provided by operat-
ing activities
Depreciation and amortization 269,706
Tax benefit from exercise of stock options by employees and from vest-
ing of restricted stock 23,682
Deferred income taxes (13,706)
Change in operating assets and liabilities
Merchandise inventory (156,091)
Prepaid expenses and other (44,736)
Accounts payable 63,532
Accrued expenses 107,365
Income taxes payable (8,214)
Deferred lease credits and other long-term liabilities 69,212
Net cash provided by operating activities $844,651
CASH FLOWS FROM INVESTING ACTIVITIES
Net maturity (purchase) of short-term investments 174,709
Net purchase of long-term investments (2,939)
Net purchase of property and equipment (465,843)
Acquisition of lease rights and other assets 19,779
Net cash used for investing activities (313,852)
24-Cash Flows Page 818 Wednesday, April 30, 2003 12:15 PM
Cash Flow Analysis 819
Gap Inc., Income Statement, in thousands
CASH FLOWS FROM FINANCING ACTIVITIES
Net increase in notes payable 44,462
Net issuance of long-term debt 495,890
Issuance of common stock 30,653
Net purchase of treasury stock (593,142)
Cash dividends paid (79,503)
Net cash used for financing activities (101,640)
Net sales $6,507825
Costs and expenses
Cost of goods sold and occupancy expenses 4,021,541
Operating expenses 1,635,017
Net interest income (2,975)
Earnings before income taxes $842,242
Income taxes 320,341
Net earnings $533,901
24-Cash Flows Page 819 Wednesday, April 30, 2003 12:15 PM
24-Cash Flows Page 820 Wednesday, April 30, 2003 12:15 PM
PART
Seven
Selected Topics in
Financial Management
Part7 Page 821 Wednesday, April 30, 2003 11:35 AM
Part7 Page 822 Wednesday, April 30, 2003 11:35 AM
CHAPTER
25
823
International Financial
Management
inancial management decisions of most firms are not confined to
domestic borders. Many financing and investment decisions involve
economies and firms outside a firm’s own domestic borders either
directly, through international transactions, or indirectly, through the
effects of international issues on the domestic economy. International
financial management is the management of a firm’s assets and liabili-
ties considering the global economy in which the firm operates.
Many U.S. firms derive a large part of their income from interna-
tional operations. Exhibit 25.1 shows the proportion of 2001 sales
derived from domestic and foreign sales for a sample of U.S. companies.
Walt Disney derives a small portion of its sales from outside the United
States, whereas Coca-Cola, the second-largest U.S. corporation, derives
most of its sales from outside the United States.
EXHIBIT 25.1
Sales Derived from Domestic and Foreign Sales for a Sample of
U.S. Companies: 2001
Source: Company annual reports
Company Domestic Sales Foreign Sales
Coca-Cola 38 62
Dow Chemical 42 58
General Electric 50 50
International Business Machines 41 59
Philip Morris 57 43
Timberland Co. 70 30
Walt Disney 83 17
F
25-IntnatlFinancial Page 823 Wednesday, April 30, 2003 12:13 PM
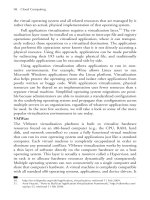
824 SELECTED TOPICS IN FINANCIAL MANAGEMENT
In this chapter, we discuss special factors that must be considered in
international corporate financial management. We begin with a review
of the global economy, looking at recent international agreements that
affect financial decisions. We will also examine the reasons why firms
expand operations beyond their domestic borders and the issues related
to taxes and with foreign currencies. Finally we discuss issues related to
financing, capital structure, investing, and working capital management.
THE GLOBAL ECONOMY
Many countries export a substantial portion of the goods and services
they produce. Looking at just the United States, we see in Exhibit 25.2
that the role of exports and imports in the economy is ever increasing.
In panel (a), we see the imports and exports growing through time. In
panel (b), we see the net trade balance (that is, exports less imports),
which illustrates that the United States has maintained a negative trade
balance (referred to as a “deficit”) for an extended period. The major
exports of the United States are chemicals, computers, and consumer
durable goods. The major imports of the United States are petroleum,
automobiles, clothing, and computers. The top three trading partners of
the United States in 2001, in terms of exports and imports, were Can-
ada, Mexico, and Japan.
Countries trade with each other, exporting and importing, because
it allows them to specialize. This ability to specialize makes for more
efficient production and, ultimately, greater output. Countries will pro-
duce and export goods and services for which they have a comparative
or competitive advantage and countries will import goods and services
for which other countries have a comparative or competitive advantage.
A comparative or competitive advantage may originate from a country’s
natural resources (such as petroleum), its human resources (such as edu-
cation), its capital investment (which may or may not be aided by the
government), or its laws or regulations that may promote certain activi-
ties. For example, the chief exports of the United States are machinery,
transportation equipment (e.g., trucks and aircraft), chemicals, and
grain products, which relate to the vast capital investment in the heavy
industries (e.g., steel production) and the acreage devoted to farm prod-
ucts. The chief import of the United States is petroleum because of the
diminished U.S. oil reserves combined with the strong demand for fuel
and petroleum-based products (e.g., plastics).
25-IntnatlFinancial Page 824 Wednesday, April 30, 2003 12:13 PM
International Financial Management 825
EXHIBIT 25.2 United States’ Exports and Imports, 1919–2001 in Real Dollars
Panel a: Exports and Imports
Panel b: Net Trade Balance
Source: Federal Reserve Bank of St. Louis
25-IntnatlFinancial Page 825 Wednesday, April 30, 2003 12:13 PM
826 SELECTED TOPICS IN FINANCIAL MANAGEMENT
Many advocate free trade, which is trading among countries with-
out barriers such as export or import quotas and tariffs (taxes on
imported goods). The benefits of free trade include enhanced competi-
tion, which ultimately benefits the consumer. However, for countries for
which there are few or no comparative or competitive advantages, free
trade may not be beneficial, and such countries may impose barriers to
protect their own companies. These barriers may affect foreign compa-
nies’ investment and financing decisions in that country.
Throughout history, most countries have exercised some protection-
ism. However, trends throughout the twentieth century reduced protec-
tionism. One such agreement is the General Agreement on Tariffs and
Trade (GATT), which was first signed by 23 countries in 1947. GATT is
basically a forum for negotiating the reduction in trade barriers on a
multilateral basis—that is, many countries agreeing to such reductions
at one time. Through time, other nations joined in GATT.
Monetary cooperation is facilitated through the International Mone-
tary Fund (IMF), an agency of the United Nations, which began opera-
tions in 1947. The objective of the IMF is to promote monetary
cooperation and encourage international trade. An important function of
the IMF is to facilitate trade through a system of payments for current
transactions. Further, the IMF strives to reduce and eliminate restrictions
on foreign exchange. In 2001, there were 184 member nations of the IMF.
Two recent major agreements affect trade among major industrialized
nations: the European Union and the North American Free Trade Agree-
ment. The European Union (EU) is an organization, consisting in 1996 of
15 European countries, whose goal is to increase economic cooperation
and integration among its member countries. The European Union was
established with the Maastricht Treaty in November 1993, which was
then ratified by the member nations, forming the European Economic
Community (EEC). Under this treaty, citizens of the member countries
gain mobility because immigration and customs requirements are reduced.
An objective of this union was the development of a common currency for
all member nations. The European countries that did not join the Euro-
pean Union remained in its predecessor, the European Free Trade Associa-
tion (EFTA), which was formed to reduce trade barriers and to enhance
economic cooperation. A January 1994 agreement eliminated trade barri-
ers between the EU and the EFTA by creating the European Economic
Area, and creating the largest free trading area in the world.
The North American Free Trade Agreement (NAFTA) is a pact
among Canada, Mexico, and the United States for the gradual removal
of trade barriers for most goods produced and sold in North America.
This pact became effective January 1, 1994, and makes North America
the world’s second largest free trade zone. It is expected that this pact
25-IntnatlFinancial Page 826 Wednesday, April 30, 2003 12:13 PM
International Financial Management 827
will expand to encompass Latin American countries, but the economic
requirements imposed upon included countries may be difficult for some
countries to satisfy, as least in the near term.
Most of the significant trade pacts involve major industrial nations.
However, because many of the future growth opportunities are in lesser-
developed nations, barriers to free trade exist and are important consid-
erations in many aspects of financial decision making.
MULTINATIONAL FIRMS
A multinational company is a firm that does business in two or more
countries. Most large U.S. corporations are multinational firms, deriving
a large part of their income from operations beyond the U.S. borders.
The largest multinational firms at the end of 2001 are listed in
Exhibit 25.3, along with their home countries and their revenues in U.S.
dollars. Many U.S. firms derive a large portion of their sales and income
from their foreign operations as we saw in Exhibit 25.1.
Companies expand beyond their domestic borders for many rea-
sons, including:
■
To gain access to new markets. Growth in the domestic market may
slow, but there may be opportunities to grow in other countries. For
example, as the domestic discount retail market became saturated in
the mid-1990s, Wal-Mart opened stores in Mexico.
EXHIBIT 25.3 The Largest Multinational Companies, 2001
Source: www.fortune.com, 2002 Global 500
Rank Company Country
Revenues
(Millions of $ U.S.)
1 Wal-Mart Stores United States $219,812
2 Exxon Mobil United States 191,581
3 General Motors United States 177,260
4 BP PLC United Kingdom 174,218
5 Ford Motor United States 162,412
6 Enron United States 138,718
7 DaimlerChrysler AG Germany 136,897
8 Royal Dutch/Shell Group Netherlands &
United Kingdom
135,211
9 General Electric United States 125,913
10 Toyota Motor Japan 120,814
25-IntnatlFinancial Page 827 Wednesday, April 30, 2003 12:13 PM
828 SELECTED TOPICS IN FINANCIAL MANAGEMENT
■
To achieve production efficiency. By shifting operations to other,
lower-cost nations, a company can reduce its operating costs.
■
To gain access to resources. Companies that rely on natural resources,
such as oil companies, establish access to these resources by establish-
ing subsidiaries in other countries. This assures these companies of
their basic materials to maintain uninterrupted operations.
■
To reduce political and regulatory hurdles. Shifting operations to
other countries may be necessary to overcome the many hurdles
established by nations to protect their domestic businesses. For
example, in the 1970s Japanese auto firms established manufactur-
ing and assembly plants in the United States to avoid import quotas
imposed by the United States.
■
To diversify. Over any given period of time, the level of business
activity may be different in different countries. This results in
opportunities to reduce the overall fluctuations in a firm’s business
revenues and/or costs by doing business abroad. For example, in the
1980s, the Japanese economy was flourishing, while the U.S. econ-
omy was in a recession; in contrast, during the early 1990s, the Jap-
anese economy did poorly, while the U.S. economy was prospering.
■
To gain access to technology. As technology is developed in other
countries, a firm may expand operations in other countries, say,
through joint ventures, to assure access to patents and other develop-
ments that ensure its competitiveness both domestically and interna-
tionally.
The many changes in the world political economy have enhanced
opportunities. These changes include changes in domestic laws and reg-
ulations, such as increased import quotas and the reduction in regula-
tions on banking activities, and changes outside the United States, such
as NAFTA and the European Free Trade Association (EFTA).
FOREIGN CURRENCY
Doing business outside of one’s own country requires dealing with the cur-
rencies of other countries. Financial managers must be aware of the issues
relating to dealing with multiple currencies. In particular, the financial man-
ager must be aware of exchange rate and the related currency risk.
Exchange Rates
The exchange rate is the number of units of a given currency that can be
purchased for one unit of another country’s currency; the exchange rate
25-IntnatlFinancial Page 828 Wednesday, April 30, 2003 12:13 PM
International Financial Management 829
tells us about the relative value of any two currencies. The exchange rate
can be quoted in term of the number of units of the domestic currency rel-
ative to a unit of the foreign currency (referred to as a direct quotation),
or in terms of the number of units of the foreign currency relative to a
unit of the domestic currency (referred to as an indirect quotation).
Consider the exchange rate of U.S. dollars and Swiss francs. From
the perspective of the U.S. firm, the exchange rate would be the number
of U.S. dollars needed to buy a Swiss franc. If the rate is 0.70, this
means that it takes $0.70 to buy one Swiss franc, 1CHF. From the per-
spective of the Swiss firm, the rate is US$0.70/1CHF = 1.4286; that is, it
takes 1.4286 Swiss francs to buy one U.S. dollar.
Countries have different policies concerning their currency exchange
rate. In the floating exchange rate system, the currency’s foreign exchange
rate is allowed to fluctuate freely by supply and demand for the currency.
Another type of policy is the fixed exchange rate system, where the gov-
ernment intervenes to offset changes in exchange rates caused by changes
in the currency’s supply and demand. The third type of policy is a man-
aged floating exchange rate system, which falls somewhere between the
fixed and floating systems. In the managed floating rate system, the cur-
rency’s exchange rates are allowed to fluctuate in response to changes in
supply and demand, but the government may intervene to stabilize the
exchange rate in the short-run, avoiding short-term wild fluctuations in
the exchange rate.
The international foreign currency market has undergone vast
changes since the gold standard was abolished in 1971. Prior to August
1971, the value of the U.S. dollar was tied to the value of gold (fixed at
$35 per ounce) and the value of other countries’ currency was tied to
the value of the U.S. dollar. In other words, the world’s currencies were
on a type of fixed exchange rate system. Since August 1971, the values
of the U.S. dollar and other currencies have been allowed to change
according to supply and demand. However, the United States, like other
countries, does occasionally intervene. Therefore, the U.S. currency pol-
icy is best described as a managed floating rate system.
The value of a country’s currency depends on many factors, includ-
ing the imports and exports of goods and services. As the demand and
supply of countries’ currencies rises and falls, the exchange rates, which
reflect the currencies’ relative values, change if rates are allowed to
“float.” For example, if a Swiss company purchases U.S. goods, the
Swiss company must buy U.S. dollars to purchase the goods, thus creat-
ing demand for U.S. dollars. If a U.S. company purchases Swiss goods,
the U.S. company must buy Swiss francs, thus creating demand for Swiss
francs. If there is increased demand for U.S. dollars, the price of the dol-
lar relative to the Swiss franc increases—the U.S. dollar appreciates and
25-IntnatlFinancial Page 829 Wednesday, April 30, 2003 12:13 PM
830 SELECTED TOPICS IN FINANCIAL MANAGEMENT
the Swiss franc depreciates. But this system does not go unchecked—
countries’ central banks may buy or sell currencies to affect the exchange
rates, thus managing the rate changes. Usually, the role of the central
banks is to smooth out any sudden fluctuations in exchange rates.
Another factor that affects the relative value of currencies is the
movement of investment capital from one country to another. If interest
rates are higher in one country, investors may buy the currency of that
country in order to buy the interest-bearing securities in that country.
This shifting of investment capital increases the demand for the cur-
rency of the country with the higher interest rate.
When a currency loses value relative to other currencies, we say that
the currency has “depreciated” if the change is due to changes in supply
and demand, or has been “devalued” if the change is due to government
intervention. If the currency gains value relative other currencies, we say
that the currency has “appreciated” or been “revalued.”
Currency Risk
The uncertainty of exchange rates affects a financial manager’s deci-
sions. Consider a U.S. firm making an investment that produces cash
flows in British pounds, £. Suppose you invest £10,000 today and
expect to get £12,000 one year from today. Further suppose that £1 =
$1.48 today, so you are investing $1.48 times 10,000 = $14,800. If the
British pound does not change in value relative to the U.S. dollar, you
would have a return of 20%:
But what if one year from now £1 = $1.30 instead? Your return
would be less than 20% because the value of the pound has dropped in
relation to the U.S. dollar. You are making an investment of £10,000, or
$14,800, and getting not $17,760, but rather $1.30 times £12,000 =
$15,600 in one year. If the pound loses value from $1.48 to $1.30, your
return on your investment is:
Currency risk, also called exchange-rate risk, is the risk that the rela-
tive values of the domestic and foreign currencies will adversely change in
the future, changing the value of the future cash flows. Financial manag-
Return
£12,000 £10,000–
£10,000
or
$17,760 $14,800–
$14,800
20%==
Return
$15,600 $14,800–
$14,800
$800
$14,800
5.41%===
25-IntnatlFinancial Page 830 Wednesday, April 30, 2003 12:13 PM
International Financial Management 831
ers must consider currency risk in investment decisions that involve other
currencies and make sure that the returns on these investments are suffi-
cient compensation for the risk of changing values of currencies.
The buying and selling of foreign currency takes place in the foreign
exchange market, which is an over-the-counter market consisting of
banks and brokers in major world financial centers. Trading in foreign
currencies may be done in the spot market, which is the buying and sell-
ing of currencies for immediate delivery, or in the forward market,
which is the buying and selling of contracts for future delivery of cur-
rencies. If a U.S. firm needs euros in 90 days, it can buy today a contact
for delivery of euros in 90 days.
Forward contracts can be used to reduce uncertainty regarding foreign
exchange rates. By buying a contract for euros for 90 days from now, the
firm is locking in the exchange rate of U.S. dollars for euros. This use of
forward contracts in this manner is referred to as hedging. By hedging, the
financial manager can reduce a firm’s exposure to currency risk.
Purchasing Power Parity
If there are no barriers or costs to trade across borders (including costs
to move the good or service), the price of a given product will be the
same regardless of where it is sold. This is referred to as the law of one
price. Applied to a situation in which there are different currencies on
either side of the borders, this means that after adjusting for the differ-
ence in currencies, the price of a good or service is the same across bor-
ders. In the case of different currencies, the law of one price is known as
purchasing power parity (PPP).
If purchasing power parity holds, we can evaluate the exchange rate
of two currencies by looking at the price of a good or service in the two
different countries. In a light-hearted look at purchasing power parity,
the financial magazine, the Economist, periodically publishes the price
of the McDonald’s Big Mac in different countries. The Economist uses
the price of the Big Mac in different countries, along with information
on current exchange rates, to predict future exchange rates. For exam-
ple, in April 2002, the Big Mac price in China was Yuan 10.50, which
was equivalent to $1.27 using the exchange rate in existence then of
8.28 Yuan/USD [Economist, April 25, 2002]. Comparing this Big Mac
price with that of the Big Mac in the U.S. at the time, $2.49, this sug-
gests—if you believe that this is a good indicator of relative valuation—
that the Yuan in undervalued by 49% relative to the U.S. dollar.
Any mispricing in terms of current exchange rates is interpreted as a
sign of future changes in currency valuations. In most situations, there
are barriers (e.g., import or export quotas) and costs (e.g., tariffs) asso-
25-IntnatlFinancial Page 831 Wednesday, April 30, 2003 12:13 PM
832 SELECTED TOPICS IN FINANCIAL MANAGEMENT
ciated with moving goods across borders. Therefore, purchasing power
parity does not likely hold precisely.
1
The Euro
The European Union consists of 15 European member countries that
engage in European economic and political activities. In February 1992,
the Treaty on European Union of 1992 established that monetary union
would take place by January 1999. The treaty, also called the Maas-
tricht Treaty because its terms were agreed to at the European Council
meeting in Maastricht (Netherlands) in December 1991, called for a sin-
gle currency and monetary policy for member countries in Europe.
Monetary policy was to be administered by the European Central Bank.
The Economic and Monetary Union (EMU) represents the member
countries that are part of the European Union that have adopted the sin-
gle currency and monetary policy.
At the time of the treaty, the single currency was to be the economic
currency unit (ECU). This was the most widely used composite currency
unit for capital market transactions. It was created in 1979 by the Euro-
pean Economic Community (EEC). The currencies included in the ECU
were those that were members of the European Monetary System
(EMS). The weight of each country’s currency is figured according to the
relative importance of a country’s economic trade and financial sector
within the EEC. Exchange rates between the ECU and those countries
not part of the EEC float freely. The exchange rate between countries in
the EEC, however, may fluctuate only within a narrow range.
However, at a meeting of the heads of government in Madrid in
December 1995, it was agreed that the name of the single currency
would be called the euro. The reason that the ECU was not selected as
the single currency was due to the opinion of Germans that the ECU
was perceived to be a weak currency. For the countries of the European
Union electing to be members of the EMU, there is a fixed conversion
rate against their national currencies and relative to the euro. However,
the value of the euro against all other currencies, including member
states of the European Union that did not elect to join the EMU, fluctu-
ate according to market conditions.
Members of the EMU are said to be part of “euroland” or the “euro
zone” because the euro became the only legal currency. Initially, the
member countries maintained their own physical currencies, although
1
There is a variation of purchasing power parity that states that changes in the rela-
tive inflation rates between two countries is reflected in the change in the exchange
rate between the two currencies.
25-IntnatlFinancial Page 832 Wednesday, April 30, 2003 12:13 PM
International Financial Management 833
they were fixed in value relative to the euro, and the euro had no physi-
cal existence. The actual euro currency physically replaced the individ-
ual currencies of the participating countries on January 1, 2002. The
relevant authorities of each member country began to withdraw their
old national currency from circulation and when this process is com-
pleted, their old national currency will no longer be legal tender.
For corporations, the primary issuance of corporate debt denomi-
nated in the euro has become large and liquid. Both European and U.S.
investment banks play significant roles in these fundings.
TAX CONSIDERATIONS
Taxes paid by corporate entities can be classified into two types: income
taxes and indirect taxes. The former includes taxes paid to the central
government based on corporate income and possibly any local income
taxes. Indirect taxes include real estate value-added and sales taxes, as
well as miscellaneous taxes on business transactions. In this section, we
provide an overview of the key corporate income tax issues that affect
investing decisions and financing decisions in foreign countries.
Establishing a Business Entity
As explained in Chapter 5, the United States has several forms of taxable
entities: individuals, partnerships, and corporations. The choice of the
structure is determined by a myriad of factors, including the minimiza-
tion of taxes (income taxes and other business taxes), the desire for lim-
ited liability, and the ease with which ownership can be transferred. The
same factors also influence the structure a firm elects when establishing a
subsidiary in a foreign country. The form of business entity chosen by
major commercial entities in the United States is the corporation.
As examples of the business entities that are available outside the
United States, let’s look at Germany and France. Germany has six forms
of commercial enterprises: (1) the corporation (Aktiengellschaft—
abbreviated AG), (2) limited liability company (Gesellschaft mit bes-
chrankter Haftung—GmbH), (3) general commercial partnership
(offene Handelgellschaft—oHG), (4) limited partnership (Kommandit-
gesellschaft—KG), (5) limited partnership with share capital (Komman-
ditgellschaft auf Aktien—KGaA), and (6) branch of a domestic or
foreign company (Zweignierderlassung). Corporate income taxes are
assessed on AGs, GmbHs, and nonresident companies that establish
German branches. The other forms are not taxed at the entity level but
at the individual level; that is, the income is allocated to the individual
25-IntnatlFinancial Page 833 Wednesday, April 30, 2003 12:13 PM
834 SELECTED TOPICS IN FINANCIAL MANAGEMENT
partners who are then taxed at their appropriate tax rate. The preferred
form used by foreigners is either the GmbH or a branch.
The principal forms of French commercial enterprises are (1) the
corporation (societe annonyme—abbreviated SA), (2) limited liability
company (societe a responsabilite limitee—SARL), (3) general partner-
ship (societe en nom collectif—SCS), (4) partnership limited by shares
(societe en commandite par actions—SCPA), (5) joint ventures, and (6)
branch (succursale). The commercial entities liable for corporate
income taxes are SAs, SARLs, SCPAs, and nonresident companies with
branches. The other entities may elect to be taxed as corporate entities
or as individuals. Foreign entities predominately use SAs and SARLs.
Corporate Income Tax Rates
The basic corporate income tax imposed by central governments is a
fixed percentage or an increasing percentage of the statutorily deter-
mined corporate income. The rate varies significantly from country to
country. Countries typically tax resident corporations on worldwide
income regardless of whether the income is repatriated. Nonresident
corporations, that is, corporations whose corporate seat and place of
management are outside the country, are typically subject only to corpo-
rate taxes derived from within the country.
To list the basic tax rates by country would be misleading for sev-
eral reasons. First, the calculation of corporate income varies based on
the types of revenues that may or may not be included as taxable and
permissible deductions. Second, there may be a refund for corporate
income distributed to shareholders that lowers the effective tax rate or
an additional corporate tax paid on distributed income that raises the
effective tax rate. Third, there may be a different tax rate based on the
characteristics of the commercial entity, such as its size. Fourth, the
effective tax rate may be different for undistributed income and income
distributed to shareholders. Finally, the tax rate can vary for resident
and nonresident business entities.
Several countries impose no tax or minimal tax rates. These coun-
tries are referred to as tax havens. The Cayman Islands and Bermuda
are examples. Tax havens are used by some entities to avoid or reduce
taxes. The use of tax havens by U.S. entities was significantly reduced by
the Tax Reform Act of 1986.
A country’s tax authorities withhold taxes on income derived in
their country by nonresident corporations. The withholding tax rate
may vary, depending on the type of income: dividends, interest, or roy-
alties. Major trading countries often negotiate tax treaties to reduce the
double taxation of corporate income.
25-IntnatlFinancial Page 834 Wednesday, April 30, 2003 12:13 PM