Báo cáo nghiên cứu khoa học " Calibration and verification of a hydrological model using event data " pot
Bạn đang xem bản rút gọn của tài liệu. Xem và tải ngay bản đầy đủ của tài liệu tại đây (579.6 KB, 11 trang )
VNU Journal of Science, Earth Sciences 26 (2010) 64-74
64
Calibration and verification of a hydrological model using
event data
Nguyen Tien Giang*, Tran Anh Phuong
Hanoi University of Science, VNU, 334 Nguyen Trai, Hanoi, Vietnam
Received 05 September 2010; received in revised form 24 September 2010
Abstract. The topic of calibration and verification of rainfall-runoff model has been subject of
many researches. However, most of the researches using the continuous data for this task, while in
the conditions of Vietnam, it is difficult to collect the sub-day continuous data. This leads to the
need for methods that can calibrate and verify the model parameters from the event data. This
paper introduces such a method. Idea of the method is to combine the auto-calibration and trial-
and-error methods. Auto-calibration is executed to locate the optima sets of parameters for
individual storm event by using the shuffled complex evolution algorithm. Then, the trial-and-
error method will attempt to find the most suitable parameters for all of the events in the ranges
defined by the parameters in the auto-calibration step. The method was applied to calibrate and
verify MIKE-NAM model parameters with the case study of Ben Hai river basin. Because the
searching space of parameters is narrowed, it is much easier and quick to find the best overall
parameters than the traditional trial-and-error method.
Keywords: Rainfall-runoff, event data, auto- calibration, trial-and-error, searching space.
1. Introduction
Rainfall-runoff models are particularly
effective tools to predict the responses of a
basin with a given amount of rainfall. They,
therefore, can be used for many purposes like
flood forecast, planning, design, operation and
management of the water resources systems.
However, before applying them for these
purposes, the models need to be calibrated and
verified to ensure that they are accurate and
persistent.
The topic of parameter calibration and
validation has been the subject of many
discussions. However, no consensus
_______
Corresponding author. Tel.: 84-4-35576903.
E-mail:
methodology exists [1,2]. There has been much
attention given to specify the procedure for
parameter calibration and validation using the
continuous simulation [3-7], while a very
limited attention has been so far devoted to
solve the same problem with interrupted (event)
data. The common way is using the continuous
simulation with the long time series data.
Compared with the continuous long time series
of data, calibration using the event data is more
difficult. Because the storm events occurred at
different years, the basin conditions change,
leading to the change of model parameters
which represent for the basin characteristics. In
that sense, a set of model parameters, that is
optimal for this storm event, may be not
suitable to other events. Another difficult for
N.T. Giang, T.A. Phuong / VNU Journal of Science, Earth Sciences 26 (2010) 64-74
65
calibration with the discontinuous data is that
we have to determine the initial conditions
(state variables at the beginning of each event)
which do not need for continuous simulation.
The same amount of rainfall can cause a large,
medium or small flood depending partly on the
basin’ hydrological pre-condition.
In the conditions of Vietnam where so far
the sub-day data in long period have not been
always available, the continuous simulation is
impossible especially in the steep, small basins
with short time of concentration. This leads to
the demand that we have to calibrate and
validate the hydrological model using the
individual storm events. The traditional
calibration method with the event data is trial-
and-error, i.e. people run model with various
sets of parameters for all of the events to find
the best set among them. The drawbacks of this
method are that 1) it depends on the experience
of the user; 2) it takes a long time to calibrate
because the parameter space is too large.
Therefore, in this paper, we introduce a
procedure to quickly calibrate and verify
parameters of the rainfall-runoff model, MIKE-
NAM, using interrupted data collected from
different storm events in different years. Our
idea is to combine two methods au-calibration
and trial-and-error. Auto-calibration is to locate
the optima set of parameters for each of the
event by shuffled complex evolution algorithm
available in MIKE-NAM model. Trial-and-
error then will find the best parameters for all
events in the parameter space defined by the
optima sets of parameters in the auto-calibration
step. This combination makes the calibration
quickly because we do not need to use trial-and-
error to find the optima parameters in their large
origin space but in a narrow space determined
in the auto-calibration step. The case study to
illustrate for the method is Gia Vong, a small
river basin in Quang Tri province.
The paper is organized as the following.
Section 2 continues with the detail procedure to
calibrate and verify the model parameters. Case
study with Gia Vong river basin to illustrate for
our method is introduced in section 3. Section
4 will close our paper with some conclusions
obtained from the research.
2. Methodology
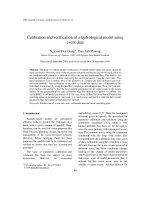
Figure 2.1 below presents the general
procedure for model calibration and
verification. As can be seen, the procedure
includes six steps in which the first five steps
are the calibration and the final step is the
verification.
Selection of the simulation model: In order
to simulate the rainfall-runoff processes, there
are enormous numbers of numerical models
depending on the purposes and characteristics
of the applied region. The MIKE-NAM model
developed by DHI Water & Environment was
selected for the study. Basically, the model was
constructed based on the idea that uses four
different and mutually interrelated storages to
represent for different physical elements of the
basin. These storages are: snow storage, surface
storage, lower zone (root zone) storage and
ground storage (refer to [8] for more details on
the theory of this model). The model has been
widely used in Viet Nam for its simplicity and
suitability with the Vietnamese basins’
characteristics.
Determine model parameters for
calibration and verification: MIKE-NAM
works with several parameters divided into four
groups: Surface and root zone, Groundwater,
Snow melt, Irrigation. Because there is no
intensive irrigation during the raining season in
Quang Tri, no irrigation parameters have been
used in this study. Also the snow melt
parameters have been excluded, because the
temperature in this province is almost never
below 5°C. Therefore, there are total 9
parameters (table 2.1) needed to calibrate and
verify in this study.
N.T. Giang, T.A. Phuong / VNU Journal of Science, Earth Sciences 26 (2010) 64-74
66
Figure 2.1. Procedure for parameter calibration and verification.
Shamsudin and Hashim [9] described the effects of these parameters on the total runoff volume
and on the peak of the runoff. Their conclusions are shown in table 2.2.
Table 2.1. NAM parameter explanation and boundaries
NAM Parameter NAM Parameter Description Unit Parameter
boundaries
U
max
Maximum water content in surface storage mm 10 – 20
L
max
Maximum water content in root zone storage mm 50 – 300
CQOF Overland flow runoff coefficient - 0 – 1
CKIF Time constant for routing interflow hours 500 – 1000
CK
1,2
Time constant for routing overland flow hours 3 – 48
TOF Root zone threshold value for overland flow - 0 – 0.7
TIF Root zone threshold value for interflow - 0 – 1
TG Root zone threshold value for groundwater recharge - 0 – 0.7
CKBF Time constant for routing base flow hours -
Select the model
Find optimal parameters for all
events
Determine model parameters for calibration
and verification
Fin
d optimal parameters for each
event
Do the verification
Select objective function
N.T. Giang, T.A. Phuong / VNU Journal of Science, Earth Sciences 26 (2010) 64-74
67
Table 2.2. Observed effects of NAM parameters by Shamsudin and Hashim (2002)
Parameters Change Effects
L
max
Increase Peak runoff decreased
Runoff volume reduced
U
max
Increase Peak runoff decreased
Runoff volume reduced
CQOF
Increase Peak runoff decreased
Runoff volume increased
TOF Increase Peak runoff decreased
Runoff volume reduced
CK1 & CK2 Increase Peak runoff decreased
The triangular shape expand horizontally
CKBF Increase Base flow decreased
Maximum groundwater depth causing base flow Increase Peak runoff decreased
Runoff volume reduced
Objective function: In general term, the
objective of model calibration can be stated as
below: Selection of model parameters so that
the model simulates the hydrological behavior
of the basin as closely as possible [10]. The
question is how is “close”? MIKE-NAM uses
multi-objective approach to answer the
question. This means that several numerical
performance measures are accounted in the
optimization process including (1) a good
agreement between the average simulated and
observed basin runoff volume; (2) a good
overall agreement of the shape of the
hydrograph; (3) a good agreement of the peak
flow with respect to timing, rate and volume;
and (4) a good agreement for low flows. For the
purpose of flood forecast, in this study, three
first objectives were preferred.
Simulation and auto-calibration for each
event: Like other conceptual models, the
parameters of MIKE-NAM cannot be obtained
directly from measurable quantities of basin
characteristics [6] and hence model calibration
is needed. Using the observed rainfall and
evaporation data of each storm event as inputs,
model will automatically estimate the optimal
set of parameters that best match the computed
hydrograph with the observed one at the outlet
of the basin. The optimization method used by
MIKE-NAM is shuffled complex evolution
(SCE) algorithm. The SCE method is a global
search method in the sense that it especially
designed for locating the global optima of the
objective function and not being trapped in
local optima.
Calibration for all events: Because the
storm events occurred at different time, it is
difficult for them to share a common optima set
of parameters. Thus, we have to find a set of
parameters that is suitable with all events. For
this task, we use the trial and error method, the
model parameters are changed to match the
computed with observed hydrographs of all
storm events as much as possible using the
rules presented in table 2.2. Our assumption is
that the most suitable parameters for all events
lie somewhere in the range determined by the
optima parameters of each event and therefore,
the parameter space for the task of trial-and-
error is narrowed.
Verification: According to Refsgaard
(1996), a model is said to be validated if its
accuracy and predictive capacity in the
verification period have been proven to lie
within acceptable limits. The verification is
implemented by using the new set of observed
N.T. Giang, T.A. Phuong / VNU Journal of Science, Earth Sciences 26 (2010) 64-74
68
data and the parameters that have been
calibrated in the previous step. Several
statistical measures will be adopted to evaluate
if the calibrated parameters can reproduce the
hydrographs suitable with the observed one,
they are:
Correlation coefficient:
s
s
QQCov
CC
0
,
0
(2.1)
Peak error:
sp
spop
Q
PeakErr
(2.2)
Wave error type 1:
n
i
op
isio
Q
n
WaveErr
1
,,
1
1
(2.3)
Wave error type 2:
2
1
,
,,
1
2
n
i
io
isio
Q
n
WaveErr
(2.4)
Volume error:
n
i
io
n
i
isio
Q
VolErr
1
,
1
,,
(2.5)
where Q
op
and Q
sp
are observed peak and
simulated peak; Q
o,i
and Q
s,i
are observed and
simulated values at time step i; n is number of
time steps.
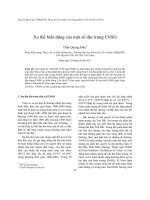
3. Description of study area
Figure 3.1. Gia Vong basin.
N.T. Giang, T.A. Phuong / VNU Journal of Science, Earth Sciences 26 (2010) 64-74
69
Study area: In order to illustrate for the
parameter calibration and verification procedure
introduced above, Gia Vong – a river basin in
Quang Tri was taken as a case study (Figure
3.1). The basin has an area of about 275 km
2
, a
perimeter of 111.9 km and an average rainfall
of 2500 mm/year.
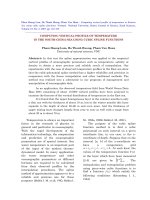
In Quang Tri, there are a wet and a dry
period in a year. The dry period lasts 8 months
from January to August, while the wet period
lasts 4 month from September to December but
heavy rainfall mostly concentrates in the period
from September to November (Figure 3.2). The
variation in the rainfall and flow of the rivers in
Quang Tri has is relatively huge. The wet
season makes up around 70% of annual rainfall,
causing the severe flooding every year. In the
province, there are three main rivers, namely
Ben Hai, Thach Han and O Lau. Gia Vong is
located at Ben Hai river.
Figure 3.2. Average monthly rainfall at Gia Vong station over the period 1977-2009.
Data available: For this study, rainfall data
has been selected from five flooding events
occurred in the years 1999, 2004, 2005, 2007
and 2009. The rainfall data were collected at
Gia Vong station. The temporal resolution for
rainfall is 6 hours. It seems relatively large for a
small basin like Gia Vong.
MIKE-NAM requires evaporation data as
input for the model. The daily evaporation data
at Khe Sanh station were used as inputs for the
model. For the model calibration and
verification, discharge data is required. The
study used hourly data from Gia Vong station at
the outlet of the basin. In some periods when
hourly data are not available, interpolation
technique was applied to generate hourly data.
Initial conditions: Initial conditions
represent for the state of the basin at the
beginning of the storm event. For the MIKE-
NAM, these conditions include the initial
N.T. Giang, T.A. Phuong / VNU Journal of Science, Earth Sciences 26 (2010) 64-74
70
relative water contents of surface and root zone
storages and initial baseflow. In our study, we
changed these values until the computed flow at
the beginning of each event is approximately
equal to the observed value.
Calibration results: Of five flood events
with available data, four events (2004, 2005,
2007 and 2009) were chosen for calibration to
find out the best parameter set of NAM model,
the remaining event (1999) for testing the
consistency of the calibrated parameters. With
the auto-calibration method available in NAM
model, the best sets of parameters have been
made for each event. These optimal parameters
are shown in the columns from 2 to 5 of table
3.1. Based on these parameters, the best set of
parameters for all calibration events was
determined using the trial-and-error method.
Compare tables 2.1 and 3.1, we can see that the
ranges of parameters reduces noticeably after
the auto-calibration step, which makes the trial-
and-error much more easily and quickly to find
the best parameters for all four storm events.
Table 3.1. Different sets of parameter for MIKE-NAM
Parameter
Best parameters
for 2004
Best parameters
for 2005
Best parameters
for 2007
Best parameters
for 2009
Best parameters
for all events
Umax 16.5 16.7 18.5 20 18.9
Lmax 175 90 294 298 220
CQOF 0.94 0.98 0.9 0.95 0.94
CKIF 50.88 45 46.98 51.2 50.27
CK1,2 23.8 28 14.5 24.6 23.70
TOF 0.076 0.076 0.883 0.690 0.43
TIF 0.487 0.158 0.466 0.309 0.36
TG 0.84 0.98 0.087 0.005 0.48
CKBF 1270 1127 1602 1067 1267
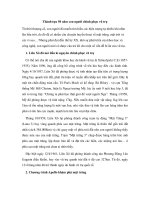
Tables 3.2 and figures from 3.3 to 3.6
compare the observed and computed
hydrographs of four calibration events with the
optimal parameters for individual event and for
all events. It can be seen that compared to the
cases modeled by using the set of parameters
for all events, the obtained hydrographs were
relatively better when the optimal parameters
for each event were applied.
Table 3.2. Results of verification with the optimal parameters for individual event
With the optimal parameters for
individual event
With the optimal parameters
for all events
Statistic criteria
2004 2005 2007 2009 2004 2005 2007 2009
Correlation coefficient 0.978 0.973 0.905 0.919 0.959 0.943 0.842 0.97
Peak error 0.019 0.158 -0.007 -0.115 0.045 0.133 0.001 -0.396
Wave error type 1 0.002 0.002 0.003 0.006 0.002 0.003 0.006 0.007
Wave error type 2 0.064 0.256 0.179 0.149 0.365 0.422 0.249 0.26
Volume error 0.169 0.222 0.292 0.285 0.248 0.29 0.373 0.31
N.T. Giang, T.A. Phuong / VNU Journal of Science, Earth Sciences 26 (2010) 64-74
71
Peak error values are quite good for events
2004 and 2007 and acceptable for event 2005.
However, the observed peak flow of event 2009
is considerably higher than the simulated one.
This can attributed to the large interval of
rainfall data. In this study, we only have rainfall
data with interval of 6 hours and thus we never
know the distribution of rainfall at the intervals
lower than 6 hours, which can be ignore the
high intensity values of rainfall. Another reason
for this disagreement is the change in the
characteristics of Gia Vong basin. The
simulated timing to peak is relatively suitable
with the observation both single peak and
multi-peak events.
The high value of correlation coefficients
(greater than 0.84) and small values of wave
error type 1 and 2 show that regarding to the
shape of the hydrograph, computation estimated
in two cases is quite similar to the observation,
especially the high flow part.
As for volume, the computed volumes are
lower than the observed ones in four events
(volume error is positive for all events), causing
by the fact that model did not simulate well the
low flow part of the hydrograph. Once again,
this can be caused by the large time interval of
rainfall data.
a) With optimal parameters for 2004 event.
b) With optimal parameters for all events.
Figure 3.3. Simulated 2004-flood hydrograph
compared to the observed 2004 flood hydrograph.
a) With optimal parameters for 2005 event.
b) With optimal parameters for all events
Figure 3.4. Simulated 2005-flood hydrograph
compared to the observed 2005 flood hydrograph.
N.T. Giang, T.A. Phuong / VNU Journal of Science, Earth Sciences 26 (2010) 64-74
72
a) With optimal parameters for 2007 event
b) With optimal parameters for all events
Figure 3.5. Simulated 2007-flood hydrograph
compared to the observed 2007 flood hydrograph.
a) With optimal parameters for 2009 event
b) With optimal parameters for all events
Figure 3.6. Simulated 2009-flood hydrograph
compared to the observed 2009 flood hydrograph.
Model verification: Using the parameter set
obtained from calibration, MIKE-NAM model
has been verified using event November 1999.
The statistical measures and simulated and
observed hydrographs are shown in Table 3.7
and figure 3.7, respectively. Similar to the
calibration stage, the correlation coefficients of
two verification flood events are quite great
(approximately 0.95). The volume error and
wave error type 1 are 0.33 and 0.003, while the
difference between computed and observed
peak flow is lower than 8%. This proves that
the calibration parameter set is consistent,
predictive and can be used for estimation of
flood frequency from rainfall data.
Table 3.3. Accuracy of the parameters compared to
the observed floods for verification stage
Flood
Correlation
coefficient
Peak
error
Wave
error
type 1
Wave
error
type 2
Volume
error
1999 0.948 -0.078
0.003 0.412 0.33
N.T. Giang, T.A. Phuong / VNU Journal of Science, Earth Sciences 26 (2010) 64-74
73
Figure 3.7. Simulated 1999-flood hydrograph
compared to the observed 1999 flood hydrograph.
4. Conclusion
This paper introduces a method to calibrate
and verify the parameters of hydrological
models with the interrupted (event) data.
General speaking, the method is the
combination of auto-calibration and trial-and-
error methods. Auto-calibration is executed to
locate the optima sets of parameters for
individual storm event by using the SCE
algorithm. Then, the trial-and-error method will
attempt to find the most suitable parameters for
all of the events in the ranges defined by the
parameters in the auto-calibration step. This
means that the searching parameter space of
trial-and-error method is narrowed, supporting
to find the best set of parameters of all events
quickly. The rainfall-runoff model was adopted
in this study is MIKE-NAM model. There are
nine main parameters needed to calibrate and
verify in this model. Data required by the model
include rainfall, evaporation and discharge.
In order to illustrate for the method, Gia
Vong river basin in Quang Tri province was
selected as a case study. The data are available
for five recent large storm events occurring in
the year 1999, 2004, 2005, 2007 and 2009 in
which event 1999 was used for verification and
the remaining events were used for calibration.
First of all, sets of parameters were individually
estimated for each of four calibration events.
After that, the most suitable parameters for all
events were chosen within the range defined by
four parameter sets in the previous step. With
the support of auto-calibration method, the
ranges of parameters decreased considerably
compared to the original ranges, helping the
trial-and-error more quickly and easily to find
the best parameters for all events. The results
show the good agreements of the hydrograph
shape and total flow volume between
simulation and observation for all four
calibration events. The peak flow simulation is
quite good for event 2004 and 2007 and
acceptable for event 2005. However, the peak
flow of observation is much higher than that of
simulation. This can be attributed to both of the
large interval of rainfall data and the changes of
basin characteristics. The calibrated parameters
were afterward verified using data from 1999
flood event. The good agreement of the
verification results indicate that the parameters
are consistent, predictive and can be applied for
different purposes such as flood forecast, water
resources planning and management.
Acknowledgements
This paper is resulted from an ongoing
project (CR.4114. VN) funded by World Bank.
The authors would like to thank all of the
people who support that project.
References
[1] T. G. Nguyen, J. L. De Kok, Systematic testing
of an integrated systems model for coastal zone
management using sensitivity and uncertainty
analyses, Environmental Modelling & Software
22 (2007) 1572.
[2] J.C. Refsgaard, B. Storm, Construction,
calibration and validation of hydrological
models, Distributed hydrological modelling.
N.T. Giang, T.A. Phuong / VNU Journal of Science, Earth Sciences 26 (2010) 64-74
74
Dordrecht, Netherlands. Kluwer Academic
Publishers, 1996.
[3] H.V. Gupta, S. Sorooshian, P.O.Yapo, Toward
improved calibration of hydrological models:
multiple and noncommensurable measures of
information, Water Resour. Res. 34 (4), 1998,
751.
[4] G. Lindstro¨m, A simple automatic calibration
routine for the HBV model, Nordic Hydrol. 28
(3), 1997, 153.
[5] S.Y. Liong, S.T. Khu, W.T. Chan, Construction
of multiobjective function response surface with
genetic algorithm and neural network. In:
Proceedings of the International Conference on
Water Resources and Environmental Research,
29–31 October, Kyoto, Japan, vol. II, 1996, pp.
31–38.
[6] S.Y. Liong, S.T. Khu, W.T. Chan, Derivation of
Pareto front with accelerated convergence
genetic algorithm, ACGA. In: Babovic, V.,
Larsen, L.C. (Eds.). Hydroinformatics’98,
Balkema, Rotterdam, The Netherlands, 1998, pp.
889–896.
[7] P.O. Yapo, H.V. Gupta, S. Sorooshian, Multi-
objective global optimization for hydrological
models. J. Hydrol. 204 (1998) 83.
[8] DHI Water & Environment, 2004. MIKE 11
Reference Manual.
[9] S. Shamsudin, N. Hashim, Rainfall runoff
simulation using MIKE11 NAM. Jurnal
kejuruteraan awam, Journal of civil engineering,
vol. 15, No. 2, 2002.
[10] Madsen, H., 2000. Automatic calibrating of a
conceptual rainfall-runoff model using multiple
objectives. Journal of Hydrology 235 (2000)
276.