Báo cáo khoa hoc:" A review on SNP and other types of molecular markers and their use in animal genetics" ppt
Bạn đang xem bản rút gọn của tài liệu. Xem và tải ngay bản đầy đủ của tài liệu tại đây (473.67 KB, 31 trang )
Genet. Sel. Evol. 34 (2002) 275–305 275
© INRA, EDP Sciences, 2002
DOI: 10.1051/gse:2002009
Review
A review on SNP and other types
of molecular markers and their use
in animal genetics
Alain V
IGNAL
a∗
, Denis M
ILAN
a
,
Magali S
AN
C
RISTOBAL
a
, André E
GGEN
b
a
Laboratoire de génétique cellulaire, Inra, chemin de Borde-Rouge,
Auzeville BP 27, 31326 Castanet-Tolosan cedex, France
b
Laboratoire de génétique biochimique et de cytogénétique, Inra,
domaine de Vilvert, 78352 Jouy-en-Josas cedex, France
(Received 11 February 2002; accepted 8 March 2002)
Abstract – During the last ten years, the use of molecular markers, revealing polymorphism at
the DNA level, has been playing an increasing part in animal genetics studies. Amongst others,
the microsatellite DNA marker has been the most widely used, due to its easy use by simple
PCR, followed by a denaturing gel electrophoresis for allele size determination, and to the high
degree of information provided by its large number of alleles per locus. Despite this, a new
marker type, named SNP, for Single Nucleotide Polymorphism, is now on the scene and has
gained high popularity, even though it is only a bi-allelic type of marker. In this review, we will
discuss the reasons for this apparent step backwards, and the pertinence of the use of SNPs in
animal genetics, in comparison with other marker types.
SNP / microsatellite / molecular marker / genome / polymorphism
1. INTRODUCTION: OLDER TYPES OF MOLECULAR GENETIC
MARKERS
Molecular markers, revealing polymorphisms at the DNA level, are now key
players in animal genetics. However, due to the existence of various molecular
biology techniques to produce them, and to the various biological implications
some can have, a large variety exists, from which choices will have to be made
according to purposes.
Two main points have to be considered, when using molecular markers
for genetic studies. As seen from the molecular biologist’s point of view, the
genotyping procedure should be as simple and have as low a cost as possible, in
∗
Correspondence and reprints
E-mail:
276 A. Vignal et al.
order to generate the vast amount of genotyping data often necessary. From the
statistician’s point of view, according to the type of analysis to be performed, a
few characteristics are important, such as the dominance relationships, inform-
ation content, neutrality, map positions or genetic independence of markers.
Whatever the system chosen, the data must of course be as reliable as possible.
From the molecular mechanism point of view, the three main variation
types at the DNA level, are single nucleotide changes, now named SNPs for
single nucleotide polymorphisms; insertions or deletions (Indels) of various
lengths ranging from 1 to several hundred base pairs and VNTR, for variations
in the number of tandem repeats (Tab. I). The molecular techniques used for
genotyping will be adapted to the variation type and to the scale and throughput
envisaged (Tab. II).
If we consider molecular genetic DNA markers in terms of the type of
information they provide at a single locus, only three main categories can
be described, in increasing degrees of interest: the bi-allelic dominant, such
as RAPDs (random amplification of polymorphic DNA), AFLPs (amplified
fragment length polymorphism); the bi-allelic co-dominant, such as RFLPs
(restriction fragment length polymorphism), SSCPs (single stranded conform-
ation polymorphism) and the multi-allelic co-dominant, such as the microsatel-
lites. Bearing this in mind, some variations in the popularity of the markers
used at different periods of time in the recent and quickly evolving field of
molecular genetics, can be easily understood.
One of the most dramatic examples, is that of the replacement of RFLPs by
microsatellites for building genetic maps in human and animal species. Indeed,
the first large scale effort to produce a human genetic map, was performed
mainly using RFLP markers, the best known genetic markers at the time [20].
However, with the generalisation of PCR and the demonstration of Mendelian
inheritance of the multiple alleles due to variations in the number of short
nucleotide repeats observed at microsatellite loci [50, 81], a change in strategy
was quickly made and all the successive genetic maps in humans [14,18,82]
were based mainly on this new type of marker. Two main reasons were behind
this quick shift. The first was the high number of alleles present at a single
microsatellite locus, leading to high heterozygosity values, therefore enabling
to dramatically reduce the number of reference families to be used for building
the map. The second was the possibility to perform genotypes by simple PCR,
followed by allele sizing on polyacrylamide gels. Microsatellite based maps
also exist for species of agricultural interest, with the main ones being the
cow [38], pig [67], chicken [27], sheep [53], goat [77], and horse [75].
As for the other marker types, although at a first glance they do not seem
that interesting to use, due to the fact that they are of the dominant type, the
RAPDs and AFLPs have a great advantage in terms of ease of use in the
laboratory. Indeed, fingerprint types of patterns are produced by just using
SNPs in animal genetics 277
standard oligonucleotides in combination (in addition to restriction enzymes
in the case of AFLPs), considerably reducing the effort and consumables,
and therefore the price, needed to produce the genotypes for a large scale
study. Once the technique has been set to work in the laboratory, data can
be produced for different species by using exactly the same reagents and
conditions. However, the drawback is that the markers are generally dominant
and generated at random. The dominance problem can be partially overcome
by the possibility of quickly generating high density maps and the lack of prior
mapping information means that once linkage has been established between
markers from a linkage group and a phenotype, the work will focus only on
that one particular region, leaving the rest of the genome aside. One major
problem with the RAPDs, is their low reproducibility, depending highly on the
PCR conditions. Contrariwise, AFLP markers can still be a good choice for
QTL mapping or diversity studies in species devoid of dense marker maps [78].
After a whole decade of domination in the molecular genetics field for
human and animal genome studies by the microsatellite markers, a new type
of marker, named SNP (single nucleotide polymorphism), recently appeared
on the scene. To have a better prospect on the implications they have, we will
describe SNPs together with the methods used for producing and genotyping
them. Comparisons with other types of markers will be done, as a guideline to
the markers to be chosen according to the various types of studies envisaged.
2. SNPS
2.1. Definition of SNPs and the generation of single nucleotide
polymorphisms
As suggested by the acronym, an SNP (single nucleotide polymorphism)
marker is just a single base change in a DNA sequence, with a usual alternative
of two possible nucleotides at a given position. For such a base position
with sequence alternatives in genomic DNA to be considered as an SNP, it
is considered that the least frequent allele should have a frequency of 1% or
greater. Although in principle, at each position of a sequence stretch, any
of the four possible nucleotide bases can be present, SNPs are usually bi-
allelic in practice. One of the reasons for this, is the low frequency of single
nucleotide substitutions at the origin of SNPs, estimated to being between
1 × 10
−9
and 5 × 10
−9
per nucleotide and per year at neutral positions in
mammals [48,57]. Therefore, the probability of two independent base changes
occurring at a single position is very low. Another reason is due to a bias in
mutations, leading to the prevalence of two SNP types. Mutation mechanisms
result either in transitions: purine-purine (A ⇔ G) or pyrimidine-pyrimidine
(C ⇔ T) exchanges, or transversions: purine-pyrimidine or pyrimidine-purine
278 A. Vignal et al.
(A ⇔ C, A ⇔ T, G ⇔ C, G ⇔ T) exchanges. With twice as many possible
transversions than transitions, the transitions over transversions ratio, should
be 0.5 if mutations are random. However, observed data indicate a clear bias
towards the transitions. For instance a study comparing rodent and human
sequences indicates a transition rate equal to 1.4 times that of transversions,
implying that each type of transitional change is produced 2.8 times as often as
each type of transversional change [11]. More recent results obtained from a
study of human SNPs from EST sequence trace databases gave a transition to
transversion ratio of 1.7 [63]. The results obtained to date in chickens indicate
higher ratios than in mammals: SNPs mined from EST sequence traces gave
a ratio of 2.3 [74] or 4 [39] and a survey of 138 SNPs from non-coding DNA
in chickens gave a ratio of 2.36 (Vignal and Weigend, unpublished data). One
probable explanation for this bias is the high spontaneous rate of deamination
of 5-methyl cytosine (5mC) to thymidine in the CpG dinucleotides, leading to
the generation of higher levels of C ⇔ T SNPs, seen as G ⇔ A SNPs on the
reverse strand [13,80].
Some authors consider one base pair indels (insertions or deletions) as SNPs,
although they certainly occur by a different mechanism.
2.2. SNPs: a new type of molecular marker?
What is the reason for the increasing popularity of SNPs, whereas in terms of
genetic information provided, as simple bi-allelic co-dominant markers, they
can be considered as a step backwards when compared to the highly informative
multi-allelic microsatellites? Are we not only putting a new name on what has
just been considered until now as a common polymorphism and originally
studied as RFLPs? In fact, the more recent SNP concept has basically arisen
from the recent need for very high densities of genetic markers for the studies
of multifactorial diseases, and the recent progress in polymorphism detection
and genotyping techniques.
3. SNP DISCOVERY
3.1. Principal strategies
Although numerous approaches for SNP discovery have been described,
including some also currently used for genotyping, the main ones are based on
the comparison of locus-specific sequences, generated from different chromo-
somes. The simplest, when targeting a defined region for instance containing
candidate genes, is to perform direct sequencing of genomic PCR products
obtained in different individuals. However, on a large scale, this approach
tends to be costly due to the need for locus-specific primers, is limited to
regions for which sequence data is available, and produces a diploid sequence
SNPs in animal genetics 279
1
2
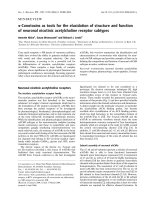
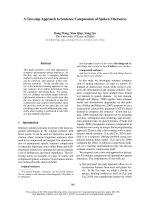
Figure 1. SNP discovery by alignment of sequence traces obtained from direct sequen-
cing of genomic PCR products.
It is not always possible to distinguish between sequence artefacts and true polymorph-
ism, when two peaks are present at one position. Box 1: top sequence homozygote
AA, middle sequence heterozygote AG, bottom sequence homozygote GG. Box 2: The
polymorphism detection software Polyphred [58] has considered the top and bottom
sequences as heterozygote CT and the middle one as homozygote CC. Clonal sequence
removes many of such ambiguities, since any double peak is a sequence artefact.
in which it is not always easy to distinguish between sequencing artefacts
and polymorphism when double peaks, as expected in heterozygotes, are
observed (Fig. 1). Therefore, different approaches based on the comparison of
sequences obtained from cloned fragments can be considered for developing
an SNP map of a genome. In this case, any double peak in a sequence trace
is always considered as an artefact. The comparison of sequence data from
EST production projects, especially if the libraries used were constructed using
tissues from different individuals, can be a good source of SNPs that will have
the additional interest of a greater chance of being in a coding region and
hence have an influence on phenotypes [63]. Over a thousand SNPs have
thus been identified in chickens [39]. However, the numbers generated by
this approach will be limited, due to the selection pressure undergone by the
coding sequences. In some rare instances, SNPs detected from EST sequence
data, will in reality be a result of RNA editing. As a similar type of approach,
in genomes for which complete genomic sequencing projects are undertaken,
sequence comparisons in BAC clone overlaps will be a source of polymorphism.
280 A. Vignal et al.
Genomic DNA from
genetically distant
individuals.
Mixing, restriction
digestion
Agarose gel
electrophoresis
Excise, clone in
plasmid
Sequence library
Align sequence traces
and search for
mismatches
ACGTGAATTCACTAG
ACGTGAATTCACTAG
ACGTGAACTCACTAG
ACGTGAATTCACTAG
ACGTGAACTCACTAG
ACGTGAATTCACTAG
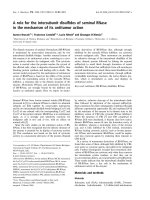
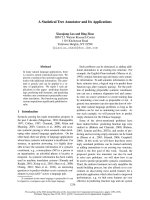
Figure 2. Reduced representation shotgun (RRS), for SNP discovery.
As a test for human SNP discovery, the BglII restriction enzyme was used. There
is on average one BglII restriction site every 3 100 bp in the human genome, giving
26 000 fragments between 500 and 600 base pairs, representing 0.5% of the genome.
Therefore, 52 000 sequences are needed for a twofold coverage. To develop high
numbers of SNPs, The SNP Consortium (TSC) used several restriction enzymes and
size ranges, to produce several libraries shared between sequencing centres [70].
The drawback in this case will be an uneven distribution of SNPs, due to the
dependence of SNP detection on the number of overlapping BAC clones of
different genetic origin along the genome [70]. These two approaches have
the inconvenient of depending highly on the choice of the individuals at the
origin of the cDNA or BAC libraries. More recently, a new approach, termed
reduced representation shotgun (RRS) [3] was used for the production of a
very high number of SNPs in humans. In this approach, DNA from different
individuals are mixed together and plasmid libraries composed of a reduced
representation of these genomes are produced by using a subset of restriction
fragments purified by agarose gel electrophoresis (Fig. 2). A 2–5 fold shotgun
sequencing of the libraries is performed and aligned overlapping sequences are
screened for polymorphism. This last “in silico” step of identifying the SNPs in
the sequence traces, whatever the way they were produced, has greatly benefited
from the development of programs estimating the quality of base calling, such
as PHRED [22,23] and of other programs using this quality assessment for
polymorphism detection, such as POLYPHRED [58] or POLYBAYES [56].
When searching for SNPs, care must be taken since there is the possibility of
false positives due to the alignment of sequences from repeated loci, especially
in random approaches such as RRS and the comparison of EST sequences. This
can be partially overcome for species in which databases of repeated elements
are available, that can be used to filter the sequence reads prior to alignment.
However, the case of duplicated loci always remains difficult to manage.
SNPs in animal genetics 281
Whitehead Institute: 589 209 SNPs
Sanger Centre: 262 279 SNPs
Washington University: 172 462 SNPs
The SNP Consortium (TSC)
5.42 million sequences => 2/3 of SNPs
24 ethnically different individuals
Reduced Representation shotgun
Detection: NQS or Polybayes
1 023 950 SNPs
Human Genome Project (HGP)
BAC or P1 clone overlaps
Dense groups all over the genome
971 077 SNPs
Specific gene studies
by sequences specific PCR:
5% of known SNPs
Non redundant SNPs: 1 433 393
Redundancy mainly in the BAC overlaps
1 419 190 SNPs: unique localisation on the
2.7 Gb of assembled sequence
1 SNP every 1.91 kb
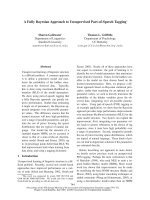
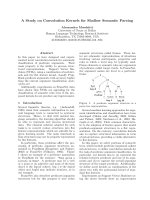
Figure 3. Generation of a 1 419 190 SNP map of the human genome. Over 2 million
SNPs were generated by the reduced representation shotgun (RRS), by the analysis
of clone overlaps from the Human Genome Project and by the analysis of specific
genes. Localisation was performed by comparison to the assembled human genome
sequence [70].
3.2. The human genome example
As often in molecular genetics, work progress in the human genome is
the most advanced and an overview of what has been going on lately in this
field will help understand what may be the future of animal genetics. Studies
on numerous SNPs in defined regions, generally each concerning one gene,
have been published with estimates of SNP frequencies and the extent of
linkage disequilibrium. The involvement of specific SNP haplotypes in given
phenotypes, usually diseases, has also been investigated. However, recently a
more general approach in SNP development and analysis was followed.
High numbers of SNPs were generated by two main approaches. Shotgun
sequencing of reduced representations of the genome, composed of a mix-
ture of 24 ethnically diverse individuals [12], was performed by The SNP
Consortium (TSC), composed of biotechnology and pharmaceutical compan-
ies ( Also, a sequence comparison of regions of over-
lap between the large insert BAC (bacterial artificial chromosome) clones
sequenced by the Human Genome Project (HGP) (Fig. 3) was done. By March
2001, 2.84 million SNPs had been deposited in a public database, 1.65 million
of which were non-redundant [55]. Mapping of the SNPs was performed
by sequence comparison with the assembled human genome sequence. In
total, a map of 1.42 million SNPs, providing an average density of one
SNP every 1.91 kb, was produced by February 2001 [70]. A few general
conclusions can be withdrawn from this work, such as the normalised measure
of heterozygosity (π), representing the likelihood that a nucleotide position will
282 A. Vignal et al.
be heterozygous, when compared across two chromosomes chosen at random
from the population. For the human genome, π = 7.51× 10
−4
, the expectation
when comparing two chromosomes is therefore one SNP every 1 331 bp.
With such high densities available, general detailed genome-wide studies can
give new insights into population and genome dynamics. Although general
studies on linkage disequilibrium (LD) show a heterogeneity between genomic
regions, it extends on larger distances than first suspected in human populations,
suggesting the occurrence of ancient demographic events, such as bottlenecks
and migrations [65]. Genome dynamics can also be studied in great detail and
for instance, the fine haplotype structure of human chromosome 21 was studied
by determining the SNP content of 20 somatic cell hybrids, each containing
a unique chromosome 21 of a different origin. More than 35 000 SNPs were
thus identified, with known allelic phases and it was thus shown that large
blocks of limited haplotype diversity exist on this chromosome [61]. Similar
results indicating a structure composed of discrete blocks of 10 to 100 kb, each
having only a limited number of common haplotypes and separated by small
recombination hot spot regions, have been described in the class II region
of the major histocompatibility complex [34] and over a 500 kb region of
chromosome 5, in which 11 blocks of low haplotype diversity covered more
than 75% of the sequence [17]. A study of 135 kb out of nine genes, has also
revealed long stretches of linkage disequilibrium, suggesting that the common
haplotype diversity of genes should be defined by a systematic approach, as an
aid to the evaluation of their implication in common diseases [35]. However,
if the long-range linkage disequilibrium induced by the underlying haplotype
structure of the genome will help in defining small regions influencing traits in
the first place, it will be difficult afterwards to pinpoint causal mutations on the
basis of genetic evidence alone. Indeed, many SNPs will have equivalent
association properties within a highly conserved common haplotype [66].
Association between a marker and a trait may even be difficult to find, in
the case of a recent low frequency causal mutation embedded in a more ancient
common haplotype.
3.3. Farm animals
No such extended studies have yet been made for farm animals, but from
the limited data available, indications of high densities of SNPs in defined
regions can be found. A sequencing study of fragments of the leptin and
amyloid precursor protein (APP) genes in 22 diverse individuals from the two
subspecies Bos taurus and Bos indicus, gave π values of 0.0026 and 0.019
respectively [41]. Within Bos Taurus alone, the π values were 0.0023 (one
SNP every 434 bp) and 0.0096 (one SNP every 104 bp) for these fragments.
Although it is clear from this study that the APP region studied is hypermutable,
it can be concluded that high levels of diversity exist in this species. This has
SNPs in animal genetics 283
been confirmed by a study of 5.3 kb of genomic DNA from cytokine genes, in 26
individuals from a cattle reference population, in which an average 1 SNP per
443 bp was found [31]. These higher heterozygosity values found in cattle as
compared to humans, may be a consequence of a pre-selection of the fragments
studied, previously known to contain SNPs. However, studies in primates
showing that diversity is reduced in humans, as compared to great apes [36],
could suggest an alternative explanation for this phenomenon. In chickens,
one SNP per 225 bp was observed in a survey of 31 000 bases analysed from
broiler and layer lines [73] and one SNP per 2 119 bp was observed in chicken
ESTs [39]. However, in these studies, the number of individuals sampled was
not indicated and the heterozygosity value is therefore not available. A more
random approach was also undertaken in chickens, in which a diversity study
on more than 3 kb of DNA in 100 individuals from diverse European chicken
breeds indicated varying levels of diversity ranging from no SNP to 17 SNPs
in fragments of 500 bp each [79].
4. GENOTYPING SNPS
For microsatellite markers, there is a standard procedure for genotyping,
involving PCR and size determination of the amplified fragment by acrylamide
gel electrophoresis. The only differences in the techniques used in different
laboratories are minor ones, principally concerning the use or not of an auto-
matic sequencing machine for size determination. For SNP genotyping, this is
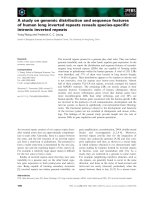
not the case, and there are many techniques available. One key feature of most
SNP genotyping techniques, apart from those based on direct hybridisation,
is the two step separation: 1) generation of allele-specific molecular reaction
products; 2) separation and detection of the allele specific products for their
identification (Fig. 4). Due to the very broad range available, we will only
present the main categories of SNP genotyping techniques here. Many are
available as commercial kits.
4.1. Direct hybridisation techniques: from ASO to chips
Most hybridisation techniques are derived from the Dot Blot, in which DNA
to be tested, either genomic, cDNA or a PCR reaction, is fixed on a membrane
and hybridised with a probe, usually an oligonucleotide. In the Reverse
Dot Blot technique, it is the oligonucleotide probes that are immobilised.
When using allele specific oligonucleotides (ASOs), genotypes can be inferred
from hybridisation signals. Throughput has now been greatly improved by
using filters or glass slides containing very high probe densities. However,
although conceptually simple, hybridisation techniques are error prone and
need carefully designed probes and hybridisation protocols [59]. The latest
284 A. Vignal et al.
Analysed product
Reaction
Analysed product
Reaction
Restriction Enzyme
1) Restriction Enzyme
DNA Dénaturation
DNA strand
Conformation
Primer Extension
3) Primer Extension
Oligo Ligation
4) Ligation
5’ Nuclease
6) Invader Assay
Hybridization
7) Hybridization
5) 5’ Nuclease
FLAP
2)
4a
SNPs in animal genetics 285
1 :
PCRRFLP
, 2 :
LAR or OLA
, 3 :
Good Assay,
4 :
Minisequencing techniques, Snapshot ,
5 :
SSCP or DGGE
, 6 : DHPLC,
7 : Pyrosequencing, READit, 8 :
SNP it,
9 :
Taqman
, 10 :
Invader Assay
, 11 :
Microarray or DNA chips
Gel Electrophoresis
MALDITOF
Array or chips
1
2
4
9
5
3
Detection technique used to reveal the polymorphism
7
Fluorimetry
Chromatography
6
Mass or Size Analysis
Conformation Analysis
8
Molecular technique applied to the target DNA
Ligation
Primer Extension
FLAP
5’ Nuclease
DNA strand
conformation
Restriction Enzyme
Hybridization
4b
10
11
Figure 4. SNP genotyping techniques.
4a: principal molecular reactions used to generate allele-specific signals.
4b: links between the signal generation and detection. The reason for the broad range of techniques available appears clearly, since many
of the products generated by the allele-specific reactions can be detected with different methods.
286 A. Vignal et al.
improvements of this family of techniques, is the use of DNA chips, on which
the probes are directly synthesised using a parallel procedure involving masks
and photolithography [62]. The densities thus obtained are extremely high and
reliability is improved by using a tiled array scheme, multiplying the number
of probes used for each base position questioned [29,80].
4.2. Techniques involving the generation and separation
of an allele-specific product
4.2.1. Restriction enzyme cutting
If the SNP to be studied involves a restriction enzyme site, PCR-RFLP can
be a genotyping procedure that is easy to set up in any molecular biology
laboratory. PCR products, if cut by the restriction enzyme, will generate
typical fragments to be analysed by a size fractionation procedure, usually gel
electrophoresis.
4.2.2. Single strand DNA conformation and heteroduplexes
Single strand conformation polymorphism (SSCP) is based on the spe-
cificity of folding conformation of single stranded DNA, when placed in non-
denaturing conditions. One single base difference in DNA fragments of up to
300 bp, will usually change the conformation in a way that can be detected
by non denaturing poly-acrylamide gel electrophoresis. Denaturing gradient
gel electrophoresis (DGGE), is based on the fact that the melting point of
double stranded DNA will be influenced by the presence of a mismatch. When
the melting point is reached in a poly-acrylamide gel containing a gradient
of denaturant, the electrophoretic mobility will be reduced. In a more recent
version of this technique, denaturing high performance liquid chromatography
(DHPLC), is used for the separation of the heteroduplex and homoduplex
strands [51].
4.2.3. Primer extension
In this technique, an oligonucleotide is used, to prime DNA synthesis by
a polymerase, as performed in a standard sequencing reaction or in PCR.
Two main variations of the technique exist, the substrate being for both a
PCR product obtained from the genomic DNA to be tested. In the first
primer extension technique, two oligonucleotides are used, each with a 3
nucleotide complementary to one of the SNP alleles, since only perfectly
matched oligonucleotides will prime DNA polymerase extension with dNTPs.
One possibility for allele separation is to perform the primer extension directly
on microarrays [60]. The use of mismatched primers can also theoretically be
used to perform an allele-specific PCR, in which the oligonucleotides specific
SNPs in animal genetics 287
for each allele are of different sizes or labelled with different dyes. However, in
practice, the PCR conditions can be difficult to set up and reliability is low. In
the second primer extension technique, a single base extension (SBE) primer
is used, whose 3
end is positioned on the base just preceding the SNP to be
tested. The DNA polymerase is then used to incorporate labelled ddNTPs, each
of four labelled with a different fluorescent dye. Any method that will allow to
separate the labelled oligonucleotides from the non-incorporated ddNTPs, will
be able to score the results simply on a fluorescence plate reader. Multiplex-
ing of this procedure has been described thus reducing costs and improving
throughput. In these methods, the different loci genotyped simultaneously
are separated either by gel electrophoresis [49] or by hybridisation to arrayed
tags [32]. Recently, Matrix-assisted laser desorption/ionisation time-of-flight
mass spectrometry (MALDI-TOF) was developed as a tool for differentiating
genotypes, by comparing the mass of DNA fragments after a single ddNTP
primer extension reaction, in which no labelling is necessary. The precise mass
of the product, that will depend on which ddNTP is incorporated, is determined.
High levels of throughput and automation can be attained [8].
4.2.4. Oligonucleotide ligation assay (OLA)
Oligonucleotides are designed so that they join at the position of the poly-
morphism to be tested. Covalent joining, performed by a DNA ligase, occurs
only when the match is perfect. The test is usually performed by designing
two oligonucleotides specific for each allele and labelled differently on one
side of the SNP, and one common oligonucleotide on the other. Detection of
the alleles can be performed directly in the microplate wells by colorimetric
approaches [76]. Multiplexing and the use of gel separation has also been
described [28].
4.2.5. Pyrosequencing
Pyrosequencing is a recent rapid re-sequencing technology, in which
template-mediated, oligonucleotide primed incorporation of nucleotides by
a polymerase, is monitored by a measure of pyrophosphate (PPi) release. The
four possible nucleotides are injected sequentially in the reaction mixture and
the succession of successful incorporations, recorded on a pyrogram, gives
the sequence. Comparison of the sequences with a reference enables to score
SNPs [68]. An advantage of the method is that any new polymorphism will
be detected. However, specific equipment is needed for the injection of the
nucleotides.
4.2.6. Exonuclease detection (TaqMan)
The 5
→ 3
exonuclease activity of Taq polymerase is used to degrade an
internal fluorescence resonance energy transfer (FRET) probe, that contains
288 A. Vignal et al.
a reporter and a quencher fluorescent dye. As long as they are linked to the
oligonucleotide, the dyes are close together and the fluorescence is quenched.
Upon degradation of the probe by the Taq polymerase, the fluorophore is
released and the fluorescence thus emitted can be monitored. This reaction can
be allele-specific, by using two different internal probes [46].
4.2.7. Invasive cleavage of oligonucleotide probes (invader assay)
This assay uses the property of Flap endonucleases (FENs), for removing
the redundant portions (flap) from the 5
end of a downstream DNA fragment
overlapping an upstream (invader) DNA fragment. An invader oligonucleotide
is designed, with its 3
ending on the polymorphism to be tested. Two oligonuc-
leotide signal probes are designed, overlapping the polymorphic site and each
corresponding to one of the alleles. After displacement of the signal probes
by the invader probe, FEN-mediated cleavage occurs only for the perfectly
matched allele-specific signal probe [52]. Generation of the cleaved fragment
is monitored, for instance by using it in a second reaction as an invader probe
to cleave a fluorescence resonance energy transfer (FRET) probe [45]. This
assay does not require PCR amplification of the locus to be tested and scoring
is done using a simple fluorescence plate reader.
4.3. Changing genotyping techniques: the example of PrP
From the progress made in genotyping techniques, but also due to the
number of different SNPs and/or individuals to genotype simultaneously, and
the throughput needed, different options will be chosen. For example, the
genotyping of polymorphisms at codons 136, 154 and 171 of the ovine PrP gene,
implicated in susceptibility mechanisms to scrapies in sheep, was recently done
at Labogena (Jouy-en-Josas, France) by using the PCR-RFLP method. After
having improved throughput first by switching from an agarose gel method
to a procedure using an automatic sequencing machine [4], the most recent
genotyping set up for these 3 SNPs will now use the Taqman assay, based
on 5
→ 3
exonuclease removal of a quencher and fluorimetry (Boscher and
Amigues, personal communication).
4.4. Which technique for the future?
It is difficult to predict if one technique, from the broad range available,
will emerge in the future as a standard, especially since the needs will vary
quite a lot between the extremes, such as the academic laboratory performing
medium-scale studies, and commercial companies or genome centres aiming
at very high throughput. In the first case, the choice may be influenced by
the equipment and expertise available in the laboratory, whereas in the second,
SNPs in animal genetics 289
to invest in new expensive dedicated machinery that can be necessary for
some of the genotyping techniques, is less of a problem. Another important
point to consider is the type of project envisaged, since it is quite different to
perform genotypes with a limited number of SNPs on very large population
samples, or a large number of SNPs on a limited number of individuals. In
the first case, techniques that require an important investment in consumables
specific to each SNP, such as expensive dedicated FRET primers, as used in the
Taqman or Invader assays can be used, whereas they should be excluded in the
second. Many techniques described here are protected by patents, a fact that
can influence prices. Also, the scale of a study has an influence on the price of
the consumables. Nevertheless, for studies involving large sets of samples, the
use of primer extension techniques analysed by MALDI-TOF technology hold
high promises in terms of automation, accuracy, throughput (a few seconds
per genotype, for the acquisition step) and price (20 cents per genotype, Gut,
personal communication). Pyrosequencing is also a very promising technique,
with prices and throughput that might reach those of MALDI-TOF. It also has
the great advantage of generating a complete short sequence stretch of about
50 base pairs, instead of just one genotype at a single base.
5. SNPS VERSUS MICROSATELLITES: ALLELE CALLING
AND QUALITY OF DATA
5.1. Technical considerations
One technical problem with microsatellites is the fact that it is not always
possible to compare data produced by different laboratories, due to the even-
tuality of inconsistencies in allele size calling. If this is usually not a problem
for familial studies, such as those performed in QTL scans, it can be a serious
issue when genotyping data from isolated individuals are used, such as in
population studies. Such inconsistencies are mainly due to the large variety of
automatic sequencing machines used, each providing different gel migration,
fluorescent dyes and allele calling software possibilities. For instance, the
type of fluorescent dye used will influence migration, and moreover, this will
depend on the length and sequence of the DNA strand [30]. In some cases, even
the use of multiple standard samples loaded on gels does not solve problems,
particularly when large size differences between alleles exist.
Another particular case of error in size determination is due to the PCR
reaction itself: according to the conditions used, the Taq polymerase catalyses
the addition of an extra base (usually an adenine) at the 3
end of the PCR
product. The proportion of fragments with this extra base may vary from
none to 100%, inducing one base pair size differences and complicating data
analysis. Although biochemical treatments after PCR or modification of PCR
primers can circumvent this problem [9, 26], they are seldom used.
290 A. Vignal et al.
Allele definition for microsatellites is done by assuming that size variation
of PCR products is directly correlated with differences in repeat numbers of the
simple motif. Although this is generally true, in some instances, size variations
can be due to small deletions or insertions in flanking sequences and two PCR
products of identical sizes can in reality be different alleles.
The allele nomenclature problem is much simpler in the case of SNPs, for
which the results can just be coded as a YES/NO problem, in which each of
the two alleles can be simply considered as being present or absent. This
simplification in the scoring of alleles will enable the data analysis step of
genotyping to be automated to a higher degree than with microsatellites, which
still require a great investment of time for reading the data, even with the
use of analysis software such as GENOTYPER (Applied Biosystems) or other
automated allele analysis methods [33].
5.2. Statistical considerations
In any statistical analysis,one key point is the link between data and statistical
treatment. The precise knowledge of the data generation process is needed
in order to build a good statistical model. A particular point on which we
would like to emphasize, is that of genotyping errors. Those inherent to
human manipulation problems, can be overcome by careful planning of the
laboratory procedures, the inclusion of well defined controls and increasing the
degree of automation. However, those due to the biochemical processes used
for genotyping are sometimes difficult to overcome and should be taken into
account. The types of errors and the frequency at which they occur will be
different between microsatellites and SNPs. In the case of microsatellites, the
typical error will be that of size determination, in which case an allele will be
replaced by one of the many other possibilities at the locus in consideration. In
some instances, new alleles will be described, that are in reality artefacts. This
can be easily corrected in family analyses, but the consequences of creating
false alleles can be drastic in population genetics. In the case of SNPs, the only
two frequent errors are the non detection of one of the two alleles, in which case
a heterozygote individual will be genotyped as a homozygote, and the inverse,
that is the false genotyping of a homozygote as a heterozygote. No creation of
false alleles is possible. For both types of markers, the presence of null alleles
is possible.
If the existence of typing errors is not taken into account, the results may
be drastically biased and can be quite misleading. For instance, SanCristobal
and Chevalet (1997) [71] showed in simulations of assignments of offspring
to parents, that the assumption of the absence of typing errors can lead to
a large number of wrong assignments even when only a few errors exist in
reality in the data. Moreover, when a non null typing error rate is allowed
for in the statistical treatment, even if higher than it really is, the assignment
SNPs in animal genetics 291
process remains powerful. A demonstration of paternity assignments in red
deer populations, taking genotyping errors into account, was done by Marshall
et al. [54].
Likelihood-based approaches are generally powerful but not always robust.
Statistical independence between markers is often required for simplicity of
calculations. However, if too many markers are considered in an analysis, this
assumption is obviously violated due to the limited size of genetic maps. The
lower heterozygosity values of single locus SNPs as compared to microsatel-
lites, implies the use of higher numbers and therefore raises the question of
the statistical treatment of (at least partially) linked loci. If independence is
nevertheless assumed, power is expected to fall down, and the estimates to
be biased [43]. This is probably what happened to Ajmone-Marsan et al.
(2001) [2] in a genetic diversity study in Italian goat populations, in which they
reported that the coefficient of variation of the genetic indexes tested decreased
only marginally when using more than 100 AFLP markers and bootstrapping on
them. The use of alternative and model free methods, such as artificial neural
networks (ANN) [6,15], may circumvent this drawback in some cases, since
they can give powerful results of assignment of individuals to a population, with
the advantage that no hypotheses concerning the markers, and particularly the
statistical independence, are needed. These methodologies should therefore
enable the use of dense sets of SNPs.
Neutrality of markers is the base assumption in population genetics. The
first idea that comes in mind is that microsatellites only seldom found in coding
sequences, are by definition neutral, whereas in the case of SNPs, this will have
to be checked for each marker. Indeed, even though most DNA sequences in
eukaryotic genomes are non coding, many SNPs have been developed while
working on specific genes or by comparison of EST sequences. However, the
reality is not quite so clear cut and when tests for neutrality are performed,
some microsatellites are clearly not neutral. Kantanen et al. (2000) [37], found
that 2 out of 10 microsatellite loci significantly violated the null hypothesis
of neutrality, when the Ewens-Watterson test was applied. In fact, this kind
of approach can be used to test the effects of selection and was applied on a
selection experiment in chickens, by calculating genetic distances between the
initial and final generations, for many loci along a genetic map (Laval, personal
communication). A marker presenting an increased genetic distance between
generations, may suggest an effect of selection in its vicinity. Such methods
could be used to detect regions containing QTLs in relation with the selection
criteria.
Mutation can be neglected in population genetics problems involving small
generation numbers, such as parentage testing and related problems, but also
in genetic diversity studies of closely related breeds. Contrariwise, for high
divergence times, mutation models are needed. Several possible models have
292 A. Vignal et al.
been proposed in the field of population genetics, and the choice of one or
another has some influence on the statistical performances. For instance,
Cornuet et al. [16], showed that genetic markers were always more efficient
when evolving under the infinite allele model than under the stepwise mutation
model, for selecting or excluding populations as the origin of individuals. Their
inference was based on the genetic distance between individuals and popula-
tions. Authors seem to agree that microsatellite markers mutate according to
a stepwise mutation model, whereas another model such as the infinite allele
model will be used for SNPs.
Also, the much higher mutation rate of microsatellites, estimated to be as
high as 1 × 10
−5
[42] when compared to the 1 × 10
−9
for SNPs [48, 57], can
be a concern, especially for association and linkage disequilibrium studies.
6. ON THE CHOICE OF MARKERS, ACCORDING TO SPECIFIC
PROJECTS
Lets set aside the RFLP markers, mainly presented for their past importance.
They are now replaced by PCR-RFLP so as to avoid using the Southern-blot
technique; the various markers referred to in Tables I and II are still in use
and the choice of one or another can be guided by the variety of parameters
indicated, mainly according to the goal of the study and the importance of the
species considered. Whatever the project, the higher heterozygosity values of
microsatellites will enable to use lower numbers.
6.1. Traceability, paternity testing, population genetics
6.1.1. The use of fingerprinting techniques
In some species, only a limited number of microsatellite markers may have
been produced, if any. In this case, the usual alternative is to use a fingerprint-
ing technique, such as RAPD or AFLP. Although RAPD is technically less
demanding than AFLP, the latter technique will produce more reproducible
data, which will be easier to share between laboratories. The main interest
of both techniques, is to use the same reagents, whatever the species studied.
However, RAPD and AFLP produce bi-allelic dominant types of markers and
therefore, to achieve the same resolution power as with microsatellites or even
SNPs, a higher number of markers will have to be studied. Moreover, in most
of the analyses performed, independence between markers is assumed and
therefore, although fingerprinting techniques will easily produce high numbers
of markers, care will have to be taken when using too many, especially since
their map position is completely unknown.
SNPs in animal genetics 293
Table I. The main categories of molecular markers.
Variation type Information content
Marker
name
SNP
1
Indel
2
VNTR
3
2 dominant
alleles
2 co-dominant
alleles
Multi allelic
co-dominant
RFLP + (+)
4
(+) − + (+)
5
PCR-RFLP + (+)
4
(+) − + −
RAPD + (+)
4
(+) + − −
AFLP + (+)
4
(+) + (+)
6
−
SSCP + (+)
4
(+) − + (+)
5
Microsatellite − (+)
7
+ − − +
SNP + (+)
8
− − + −
1
Single nucleotide polymorphism: any kind of base substitution. The fact that
SNPs appear both as a variation type and a marker name, is due to the fact that in
reality, many genotyping techniques used for genotyping SNPs are grouped under
this generic marker name.
2
Insertions and deletions.
3
Variable number of tandem repeats.
4
Although the RAPD, AFLP, RFLP, PCR-RFLP and SSCP techniques will detect
base substitutions in the vast majority of cases, the two other types of DNA variation
can also be analysed.
5
In some instances, more than two alleles can be analysed.
6
With an automatic sequencer, some markers can be scored as co-dominant.
7
Variations in PCR product length can be due to a deletion in the sequence flanking
the microsatellite.
8
Many SNP detection techniques can also be used for scoring small insertions or
deletions (indels).
6.1.2. SNPs
versus
microsatellites
Individual traceability of bovine meat
It has been proposed that standardised sets of SNPs could be used to produce
digital DNA signatures for animal tagging [25]. After performing blind gen-
otypings and allowing for a non-null error rate in the analyses, a minimal set
of eight microsatellites could be kept, to assure perfect traceability of bovine
meat [72]. Using this as a reference, a comparison with SNPs was done
by drawing random bi-allelic markers assuming statistical independence, first
with equal, then with uniformly distributed allelic frequencies. As expected,
the presence of rare alleles leads to a dramatic fall in power, the maximum
power being reached with (50%–50%) allelic frequencies. With uniformly
distributed biallelic markers, a set of at least 30 was necessary to obtain perfect
individual traceability (SanCristobal and Marimbordes, unpublished data).
294 A. Vignal et al.
Table II. Technical requirements and characteristics.
Technical requirements Technical characteristics
Marker
name
Restriction
enzyme
PCR Specific
primers
Gel Development
effort
Genotyping
effort
Reproducibility
1
Accuracy
2
RFLP + − −
3
+ High High High Very high
PCR-RFLP + + + + High Medium High Very high
RAPD − + − + Very low Very low Low Very low
AFLP + + − + Low Very low High Medium
SSCP − + + + Medium Medium Medium Medium
Microsatellite − + + + High Low High High
SNP − + + +/−
4
High Variable
4
High Very high
1
Refers to the genotyping error rate of the method: results may vary from one experiment to another.
2
Refers to the precision at which true allele recognition can be performed.
3
However, the RFLP technique relies on the use of a specific probe for the Southern-blot technique. Nowadays, RFLPs are usually
genotyped by PCR-RFLPs, requiring specific primers.
4
According to the genotyping technique used (see Fig. 3).
SNPs in animal genetics 295
Parentage assignment, pedigree reconstruction and related problems
There are situations in animal breeding, in which relationships between
two or more individuals, such as parent-child, full sibs, half-sibs, or unrelated
individuals, have to be tested. Obviously, the size of the design will have an
influence on the power of any statistical analysis performed. For instance, the
assignment of the true father among a set of S sires is less powerful when S is
large. Consequently, more loci will be needed to maintain a correct assignment
level at a given rate when increasing S. Also, the number of loci will be critical if
some individuals are missing, such as the mother or some of all of the potential
fathers.
A numerical example can be given in the particular case where a finite
set of potential sires is genotyped with markers and the mother is either or
not genotyped. This situation is encountered in fish breeding, in which fry
are mixed together so as to avoid environmental heterogeneity, or in sheep
breeding, where several sires in natural mating systems are introduced together
in a given flock. This latter case has been studied by considering 20 potential
sires and using six microsatellite markers, with allelic frequencies estimated
from French sheep breeds and assuming a 1% genotyping error rate. Simulation
results indicate that 10% (respectively 18%) of assignment error occurs with
the six microsatellites if the dam is typed (respectively non typed). Considering
uniformly distributed allele frequencies, 30 (respectively 70) biallelic markers
are needed to achieve the same error rates (SanCristobal and Amigues, unpub-
lished data). This shows a higher need of biallelic markers (compared with
multiallelic) when the mother is not genotyped, than when she is.
Even though the parent-offspring links are hence easy to ascertain with
hypervariable loci, the grand-parent-offspring links require a greater genotyp-
ing effort: when matings are known, 95% correct grand-parentage assignments
typically require at least twofold more alleles per locus than do 95% correct
parentage assignments [47]. In terms of the number of loci, such a recognition
may be prohibitive with SNPs.
When parentage is to be tested, typically one checks for incompatibilities
between sire and child genotypes. Theoretically, no genotyping error is
assumed to occur. The power of a set of markers depends on the global
exclusion probability (PE). This kind of question is commercially important
especially in horse breeding, but also in dairy cattle when sires have a high
commercial value. Some formulas for PE can be found in Dodds et al.
(1996) [19]. For instance, when a mother and child are genotyped, a wrong
putative father is excluded with a probability PE(k) at a locus with k alleles.
Comparing a set of L(2) loci with two alleles and a set of L(k) loci with k alleles,
the same exclusion probability is obtained if
[1 − PE(2)]
L(2)
= [1 − PE(k)]
L(k)
.
296 A. Vignal et al.
It follows that assuming equal allele frequencies at any locus, 2.23 (respect-
ively 3.38) times more biallelic loci are needed than tri-allelic loci (respectively
with four alleles).
Minimising the mean kinship between animals within populations has been
suggested as a general approach for the conservation of genetic diversity. As
for other applications, there is a strong effect of the polymorphism of markers
on the good classification of the relatedness between individuals in categories
such as full sibs, half sibs or parent-offspring pairs. For instance, almost
twice as many loci of expected heterozygosity He = 0.62 (three alleles of
frequencies 0.5, 0.3 and 0.2) are required to achieve the same accuracy as with
loci of He = 0.75 (four alleles of frequency 0.25 each) [7]. To be able to
accurately distinguish between non-inbred full sibs and half sibs, at least 30 to
50 unlinked markers with 5 to 10 alleles each are needed [21]. Therefore, the
use of biallelic loci may not be a good solution for kinship estimation, since
the numbers used will have to be very high.
The very high level of polymorphism found at some microsatellite loci in
wild species, such as a 54 allele microsatellite locus found in the Pilot Whale
by Amos et al. [5], is also in favour of their use: the development and especially
the genotyping of SNPs representing a bigger effort, due to the larger numbers
needed.
Genetic distances between populations
Genetic distances between pairs of populations are often the basis for
diversity analyses. Usually, the simplest model is assumed, where a founder
population splits into two daughter populations, which then diverge. For
closely related populations, as encountered in diversity studies of livestock
species, the meaningful parameter is the average inbreeding coefficient F. Dis-
tances estimating this inbreeding coefficient have approximately the following
accuracy (see Laval 2001 for simulations and references) [44]:
2
L(k
0
− 1)
F +
1
m
2
where L is the number of loci, k
0
the number of founder alleles, and m the
average number of sampled individuals in the final populations. It follows
immediately that (k
0
− 1) times more biallelic markers are needed to achieve
the same genetic distance accuracy than a set of microsatellites with k
0
alleles.
This formula also implies that the coefficient of variation is very sensitive
to the sample size for a small F, so the genotyping effort will have to be
particularly important for very small divergence times, small sample sizes and
when using bi-allelic markers, if accurate estimates of genetic distances are
required.
SNPs in animal genetics 297
When performing studies on admixture, bi-allelic loci provide little inform-
ation about the admixture proportion and the time since admixture, even for
very small amounts of drift, but they can be powerful when many loci are
used [10].
Assignment of an individual to a population
The structure of populations, which varies according to the species studied
due to variations in breeding strategies, will probably have an influence on
the number of markers to be used for solving the problem. As few as four
hypervariable microsatellite loci are sufficient to distinguish populations of
brown trout and properly assign an individual to its population [6]. It has
been shown in chickens, that this minimal number will have to be slightly
larger, being between 10 and 20 [69]. However, given the low numbers of
microsatellite markers needed, the matching number of SNP markers will
remain low enough to develop a set with statistical independence.
6.2. Maps and QTL scans
Although the use of microsatellite markers is the best choice for the con-
struction of a reference map for a species, the inclusion of type I markers
(genes) is necessary both for the development of comparative maps and for
the generation of positional candidate genes. Apart from a few cases in which
microsatellites close to the coding sequences have been found, this has usually
been done through the use of SNPs.
The mapping of regions containing QTLs involves the genotyping of markers
covering the complete genome. These can be chosen from a reference map
when available, in which case the markers are chosen as much as possible at
regular intervals along the linkage groups. If available, the best to use in this
case are the microsatellites, since they are highly informative and easy to use
by PCR. However, in species for which no maps are available, QTL scans are
performed with AFLP markers. Apart from the problem inherent to the use
of dominant markers in this latter case, another drawback comes from the fact
that no information on the position of the markers on the genome is available.
Therefore, linkage groups specific to the cross studied have to be constructed,
before the QTL analysis. After this step, since the polymorphism underlying an
AFLP marker is usually an SNP, by converting the AFLP markers found linked
to the QTL into a corresponding SNP [40], both advantages of co-dominance
and locus-specificity will then be available. Also, once linkage to a QTL has
been found, the real position on the genome will have to be determined by
anchoring the particular linkage group on the cytogenetic map, so as to have
means of developing new markers in a targeted way. Several approaches can
then be taken, such as chromosome scraping or use of comparative mapping
data.
298 A. Vignal et al.
One possibility for species of minor agricultural importance, for which
mapping data is scarce, is to use as many locus-specific markers as possible,
such as microsatellites or SNPs, together with the AFLPs. The former will
help exchange mapping data between different crosses studied and also help
provide information on the chromosomes concerned. The latter will help build
linkage groups and ensure a correct genome coverage by allowing an increase
in marker density.
It can be noted, that even in species for which dense maps with many
microsatellites are available, the number of evenly spaced informative markers
for a given cross may be too low. This will particularly be the case when closely
related populations, such as two lines of a common origin, are divergently
selected and crossed together for a QTL study. This is a current practice in
chickens for instance. In such cases, SNPs are the only possible alternative.
6.3. Fine QTL mapping, candidate genes and complex traits
Several approaches can be taken for fine QTL mapping, such as increasing
the number of meiosis events by increasing the size and/or the number of fam-
ilies for genotyping, selecting recombination events in recurrent backcrosses,
using advanced intercross lines (AIL) or performing linkage disequilibrium
and haplotype-based studies in outbread populations. However, whatever the
approach taken, high densities of markers will be needed. In some instances,
when the populations studied are closely related, even the microsatellite mark-
ers may not be heterozygous for the F1 animals. Also, for some species, such
as chickens, the density of microsatellites will be low [64].
Testing of candidate genes and candidate polymorphisms in exons, pro-
moters or other important regions such as splice sites, promoters or other
regulatory regions, will have to be done using the SNP approach, since this
will be the most common polymorphism and the more likely responsible for
phenotypic variation.
When testing for the association between complex phenotypic traits and
candidate loci, single-loci SNP analyses present a loss of information due to the
bi-allelic nature of the markers, as compared to the multi-allelic microsatellites.
However, by performing haplotype frequency estimations over several SNPs
from a locus, this can be overcome [24] and even possibly improved, due to the
fact that SNPs will more often be close to the site responsible for the variation
than microsatellites.
7. CONCLUSION
Although in a strict molecular sense, SNPs are just what has been previously
known as base substitutions, the fact of naming molecular markers by this
SNPs in animal genetics 299
acronym meaning single nucleotide polymorphism, is an indication of the new
importance that this type of polymorphism has in molecular genetics. Indeed,
if in some instances, the lack of information due to the bi-allelic nature of
SNPs is a limitation, there are cases in which they can provide valuable data on
associations between specific genes or other DNA structures and phenotypes,
or on population and genome dynamics.
The very high density of SNPs in genomes, usually allows to develop several
of them in a single locus of a few hundred base pairs. By reconstructing
haplotypes, multi-allelic systems can eventually be defined for analyses, to
overcome the limitations due to the low heterozygosity of SNPs. With increas-
ing progress being made in the molecular techniques used to produce SNP
data, in the automation of allele scoring and in the development of algorithms
for genetic analyses [1], the effort needed to produce an equivalent amount of
information as with microsatellites may some day be equivalent.
REFERENCES
[1] Abecasis G.R., Cherny S.S., Cookson W.O., Cardon L.R., Merlin-rapid analysis
of dense genetic maps using sparse gene flow trees, Nat. Genet. 30 (2002) 97–101.
[2] Ajmone-Marsan P., Negrini R., Crepaldi P., Milanesi E., Gorni C., Valentini A.,
Cicogna M., Assessing genetic diversity in Italian goat populations using AFLP
markers, Anim. Genet. 32 (2001) 281–288.
[3] Altshuler D., Pollara V.J., Cowles C.R., Van Etten W.J., Baldwin J., Linton L.,
Lander E.S., An SNP map of the human genome generated by reduced repres-
entation shotgun sequencing, Nature 407 (2000) 513–516.
[4] Amigues Y., Mériaux J C., Boscher M Y., Utilisation de marqueurs génétiques
en sélection : les activités de Labogéna, INRA Prod. Anim. Hors série (2000)
203–210.
[5] Amos B., Schlotterer C., Tautz D., Social structure of pilot whales revealed by
analytical DNA profiling, Science 260 (1993) 670–672.
[6] Aurelle D., Lek S., Giraudel J.L., Berrebi P., Microsatellite and artificial neural
networks: tools for the discrimination between natural and hatchery brown trout
(Salmo trutta L.) in Atlantic populations, Ecol. Model. 120 (1999) 313–324.
[7] Blouin M.S., Parsons M., Lacaille V., Lotz S., Use of microsatellite loci to
classify individuals by relatedness, Mol. Ecol. 5 (1996) 393–401.
[8] Bray M.S., Boerwinkle E., Doris P.A., High-throughput multiplex SNP geno-
typing with MALDI-TOF mass spectrometry: Practice, problems and promise,
Hum. Mutat. 17 (2001) 296–304.
[9] Brownstein M.J., Carpten J.D., Smith J.R., Modulation of non-templated nuc-
leotide addition by Taq DNA polymerase: primer modifications that facilitate
genotyping, Biotechniques 20 (1996) 1004–1006, 1008–1010.
[10] Chikhi L., Bruford M.W., Beaumont M.A., Estimation of admixture proportions:
a likelihood-based approach using Markov chain Monte Carlo, Genetics 158
(2001) 1347–1362.