Báo cáo khoa hoc:" Genetic parameters of beef traits of Limousin and Charolais progeny-tested AI sires" pdf
Bạn đang xem bản rút gọn của tài liệu. Xem và tải ngay bản đầy đủ của tài liệu tại đây (1.44 MB, 25 trang )
Original
article
Genetic
parameters
of
beef
traits
of
Limousin
and
Charolais
progeny-tested
AI
sires
Marie-Noëlle
Fouilloux
a
Gilles
Renand
a
Jacques
Gaillard
b
François
Ménissier
a
Station
de
génétique
quantitative
et
appliquée,
Institut
national
de
la
recherche
agronomique,
78352
Jouy-en-Josas,
France
Institut
de
l’élevage,
Station
de
génétique
quantitative
et
appliquée,
78352
Jouy-en-Josas,
France
(Received
10
November
1998;
accepted
3
September
1999)
Abstract -
Sire
selection
efficiency
depends
on
the
knowledge
of
accurate
genetic
parameters.
In
France,
artificial
insemination
(AI)
sires
are
selected
according
to
their
own
performances
and
those
of
their
progeny,
which
are
both
recorded
in
test
stations.
Genetic
parameters
among
progeny
traits
were
estimated
using
multi-trait
REML
(restricted
estimation
of
maximum
likelihood)
analyses
in
Charolais
and
Limousin
breeds.
The
expected
decrease
in
genetic
variability
algebraically
calculated
among
progeny
traits
due
to
the
selection
of
sires
was
not
observed.
This
selection
was
not
a
strict
truncation.
Heritabilities
of
traits
measured
on
progeny
are
moderate
for
growth
traits,
morphology
and
live
fatness
scores
(from
0.14
to
0.38)
and
slightly
higher
for
dressing
percentage
and
carcass
fatness
score
(0.50
and
0.44,
respectively).
Genetic
correlations
among
progeny
traits
depended
on
traits,
selection
programme
and
breed.
Carcass
weight
and
morphology
were
highly
genetically
linked
to
corresponding
live
traits
(live
weight
and
conformation,
respectively).
They
can,
therefore,
be
easily
improved
through
indirect
selection
in
contrast
to
carcass
fatness
which
has
only
a
small
genetic
correlation
with
live
traits.
©
Inra/Elsevier,
Paris
genetic
parameters
/
live
and
carcass
traits
/
Charolais
and
Limousin
breeds
/
selection
Résumé -
Paramètres
génétiques
des
aptitudes
bouchères
des
taureaux
d’insémi-
nation
artificielle
Limousins
et
Charolais
contrôlés
sur
descendance.
L’efficacité
de
la
sélection
des
reproducteurs
dépend
de
l’exactitude
des
paramètres
génétiques
utilisés.
En
France,
les
taureaux
d’insémination
artificielle
sont
sélectionnés
à
partir
de
leurs
performances
propres
et
celles
de
leurs
descendants
mesurées
en
station
de
*
Correspondence
and
reprints
E-mail:
contrôle.
Les
paramètres
génétiques
des
performances
des
descendants
ont
été
estimés
en
race
Charolaise
et
Limousine
à
l’aide
d’un
REML
(Estimation
du
Maximum
de
Vraisemblance
Restreint) -
multicaractère.
La
réduction
calculée
algébriquement
de
la
variabilité
génétique
des
performances
des
descendants
due
à
la
sélection
des
pères,
n’a
pas
été
observée.
Cette
sélection
n’a
pas
été
faite
par
troncature
stricte.
L’héritabilité
des
caractères
de
croissance,
de
morphologie
et
d’état
d’engraissement
est
modérée
(comprise
entre
0,14
et
0,38).
Celle
du
rendement
de
carcasse
et
de
la
note
de
gras
interne
est
plus
élevée
(0,50
et
0,44,
respectivement).
Les
corrélations
génétiques
dépendent,
notamment,
des
caractères
analysés,
du
programme
de
sélection
et
de
la
race.
Le
poids
et
la
conformation
des
carcasses
sont
fortement
corrélés
génétiquement
à
des
caractères
mesurables
sur
l’animal
vivant.
Ils
sont
donc
aisément
améliorables
par
sélection
indirecte
contrairement
à
l’état
d’engraissement
des
carcasses
qui
n’apparaît
que
peu
lié
génétiquement
aux
caractères
contrôlés
en
vif.
@
Inra/Elsevier,
Paris
paramètres
génétiques
/
caractères
en
vif
et
d’abattage
/
races
Charolaise
et
Limousine
/
sélection
1.
INTRODUCTION
In
France,
beef
traits
of
artificial
insemination
(AI)
bulls
are
improved
by
a
three-step
sequential
selection.
The
first
step
is
based
on
pedigree
and
per-
formances
at
weaning.
The
second
step
is
based
on
post-weaning
performances
of
bulls
recorded
in
central
test
stations.
The
last
step
is
based
on
the
per-
formances
of
a
sample
of
the
male
progeny
of
these
bulls
fattened
in
progeny
test
stations.
Breeding
values
of
these
sires
for
beef
production
are
currently
estimated
using
the
latter
two
data
sets
[1].
Since
the
beginning
of
the
1980s,
heritabilities
of
beef
traits
currently
used
in
genetic
evaluation
programmes
in
France
have
been
based
on
the
estimates
given
by
Renand
and
Gaillard
[29],
Renand
[25,
26]
and
Renand
et
al.
[30]
in
different
beef
breeds,
using
the
Henderson
method
3
without
a
relationship
matrix
among
sires.
Since
the
accuracy
of
genetic
evaluations
and
consequently
the
efficiency
of
selection
partly
depend
on
the
use
of
correct
sound
parameters
(heritabilities
and
genetic
correlations),
these
estimates
need
to
be
reconsidered
for
two
reasons:
1)
more
recent
information
is
available
in
these
selection
programmes;
2)
variance
component
estimations
can
be
obtained
with
more
suitable
methods,
such
as
restricted
estimation
of
maximum
likelihood
(REML),
known
to
be
the
method
of
choice
for
most
situations
in
animal
breeding.
Sire
selection
based
on
their own
performance
prior
to
their
progeny
testing
was
expected
to
modify
the
subsequent
genetic
variability
[4,
8!.
Then,
an
unbiased
estimation
of
genetic
parameters
requires
that
the
data
used
for
selection
decisions
(performance
and
pedigree
up
to
the
base
population)
be
included
in
the
analysis
(35!.
Journaux
[13]
estimated
genetic
parameters
of
a
trait
observed
for
progeny
and
a
trait
observed
for
the
sires
using
a
bivariate
REML
approach.
Nowadays,
such
multivariate
REML
estimates
could
allow,
to
a
certain
extent,
the
estimation
of
variance
components
taking
into
account
the
information
used
for
selection.
The
objective
of
this
paper
was
to
estimate
the
genetic
parameters
to
be
used
for
progeny
testing
after
checking
whether
the
previous
selection
of
sires
based
on
their
own
performance
should
be
taken
into
account.
2.
MATERIAL
AND
METHODS
2.1.
Design
of
testing
procedures
in
the
French
AI
programmes
In
each
of
the
specialised
beef
breeds
in
France,
two
types
of
programmes
exist
for
selecting
AI
bulls
depending
on
whether
they
are
predominantly
used
for
terminal
crossbreeding
or
for
pure-breeding.
Each
year,
new
potential
AI
bulls
were
bought
by
AI
co-operatives
at
weaning
in
nucleus
herds
and
gathered
in
central
test
stations
(50-70
per
year
on
average).
The
actual
information
used
by
AI
co-operatives
for
selecting
these
calves
was
not
known.
Two
or
three
groups
of
contemporary
calves
(born
within
a
6-week
period)
were
then
tested
for
a
fixed
period
length
up
to
approximately
16
months
of
age.
At
the
end
of
the
test,
the
best
bulls
to
be
progeny
tested
were
selected
according
to
an
index
combining
three
or
four
traits
recorded
in
these
central
stations.
These
performances
were
final
weight,
feed
efficiency
and
muscling
score
for
selecting
terminal
crossbreeding
AI
bulls.
Skeletal
frame
score
was
added
when
AI
bulls
were
used
for
pure-breeding
[1].
Semen
quality
of
selected
bulls
was
assessed
before
progeny
testing.
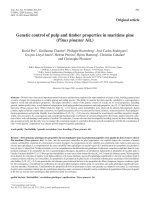
This
selection
step
was
not
a
strict
truncation
(figure
1)
because
some
sires
with
high
indexes
were
eliminated
either
for
bad
semen
quality
or
other
defects.
Bulls
selected
(on
average
8-13
per
year)
were
randomly
mated
to
about
100
adult
cows
in
commercial
herds.
Three
reference
bulls
were
simultaneously
used.
Approximately
20-30
male
calves
per
tested
bull
and
per
reference
sires
at
15-20
days
(crossbred)
or
6-7
months
(pure-bred)
of
age
were
bought
and
set
in
the
test
stations.
Crossbred
calves
were
raised
in
a
nursery
until
the
beginning
of
the
performance
test
(5-6
months).
The
performance
test
of
the
pure-bred
calves
started
after
1
month
of
adaptation.
At
the
beginning
of
the
performance
tests,
young
bulls
were
gathered
in
age-contemporary
groups
(variation
of
1
month
maximum).
During
the
test
period,
male
calves
were
intensively
fattened
with
corn
silage
distributed
ad
libitum
and
supplemented
with
protein
feed.
They
were
slaughtered
under
uniform
conditions
at
a
fixed
age
or
fixed
weight
depending
on
the
selection
programme.
Carcass
traits
were
recorded.
In
each
progeny
test
station,
batches
for
different
years
were
genetically
connected
through
three
national
reference
sires
!1!.
2.2.
Animals
considered
The
genetic
parameters
of
live
and
slaughter
traits
were
estimated
using
two
sets
of
performances
recorded
in
Charolais
and
Limousin
progeny
test
stations.
In
both
breeds,
pure-bred
and
crossbred
progeny
tests
exist.
In
this
analysis,
Limousin
bulls
were
progeny
tested
on
pure-bred
young
bulls
slaughtered
at
the
fixed
age
of
16
months
and
Charolais
bulls
were
progeny
tested
on
crossbred
young
bulls
(Normand
and
Friesian
dams)
slaughtered
at
a
fixed
weight
of
600-650
kg
depending
on
the
year.
A
total
of
131
Limousin
and
145
Charolais
sires
was
progeny
tested
on
4 532
and
3 519
young
bulls,
over
11-12
consecutive
years,
respectively.
Most
of
these
sires
were
previously
tested
in
central
test
stations.
2.3.
Performances
recorded
in
progeny
test
station
Owing
to
the
strict
procedures
and
the
restricted
number
of
animals
in
the
station,
many
performances
concerning
growth
and
conformation
could
be
accurately
recorded
before
or
after
slaughter.
The
beef
traits
analysed
in
this
study
were:
-
growth
traits:
average
daily
gain
during
the
fattening
period
(ADG),
initial
weight
(IW)
and
live
weight
(LW)
adjusted
by
interpolation
from
the
two
nearest
weights
to
300
and
480
days,
respectively,
in
the
Limousin
progeny
and
to
163
and
450
days
in
the Charolais
crossbred
progeny;
-
slaughter
yield:
dressing
percentage
(DP)
defined
as
the
ratio
of
hot
carcass
weight
to
final
live
weight;
-
morphology
scores:
live
muscling
(LM),
carcass
muscling
(CM)
and
live
skeletal
frame
(LS)
scores;
-
fatness
scores:
live
fatness
(LF)
and
carcass
fatness
(CF)
scores.
As
carcasses
were
systematically
trimmed
at
slaughter,
CF
was
scored
for
the
amount
of
pelvic,
kidney
and
internal
fats.
Scores
were
given
by
a
very
limited
number
of
experienced
technicians
in
each
station
at
the
very
end
of
the
test
period
(LM,
LS,
LF)
and
at
slaughter
(CM,
CF).
2.4.
Effect
of
selection
of
sires
on
the
genetic
variability
of
progeny
traits
2.4.1.
Effect
of
step
2
selection
In
order
to
study
the
impact
of
the
selection
of
sires
(step
2)
on
the
genetic
variability
of
progeny
traits
three
different
estimates
of
genetic
parameters
were
compared.
This
selection
was
based
on
the
sire
own
performances
measured
in
the
central
test
station.
In
the
Charolais
programme,
a
set
of four
traits
measured
on
progeny
was
studied:
two
live
traits
(live
weight
(LW)
and
live
muscling
score
(LM))
and
two
slaughter
performances
(dressing
percentage
(DP)
and
carcass
fatness
score
(CF)).
- The
first
estimates
(h
2
and
r9)
were
obtained
on
these
four
progeny
traits
analysed
simultaneously
with
the
three
performance
traits
of
sires
used
for
selecting
bulls
on
their
own
performances
in
the
test
station
(final
weight,
feed
efficiency
and
live
muscling
score).
The
progeny
trait
(co)variances
were
described
with
a
sire
model
while
the
sire
performance
(co)variances
were
described
with
an
animal
model.
Since
all
the
data
presumably
used
for
selecting
the
sires
were
included
in
the
analysis,
these
estimates
were
considered
to
be
free
from
the
influence
of
selection
in
step
2.
- The
second
estimates
(ha
and
r
a9
)
were
obtained
on
the
four
progeny
traits
only,
described
with
a
sire
model.
These
apparent
genetic
parameters
might
have
been
biased
by
selection.
-
The
third
estimates
(hfl
and
rgg)
were
algebraically
derived
from
the
first
ones
taking
into
account
the
reduction
in
variance
of
traits
among
selected
sires.
Selection
at
the
end
of
the
performance
tests
in
the
central
test
station
(step
2)
was
assumed
to
be
only
made
on
a
selection
index
combining
final
weight
(PFW),
live
muscling
score
(PLM
)
and
feed
efficiency
(PFE).
A
posterior
index
(1)
[20]
was
obtained
from
the
observed
selection
differentials
of
each
trait
(Pi
s
-
Pi),
where
Pi
and
Pi,
were
the
means
of
sires
for
the
ith
trait
before
and
after
selection:
Using
this
index
with
a
threshold
selection
would
have
led
to
the
observed
selection
differential
for
each
trait.
In
the
Charolais
programme,
118
out
of
the
145
progeny-tested
sires
were
selected
among
519
bulls
tested
in
the
central
station.
The
observed
selection
differential
was
about
7.00
on
that
posterior
index
(I).
Because
the
observed
variance
before
selection
(
QI
)
was
57.3,
selection
intensity
was
equal
to
0.93.
The
variance
observed
among
selected
bulls
(o, 2!,
was
24.3
(43
%
of
a))
and
the
relative
reduction
of
variance,
(3
=
(o, 2s -ol 2)/0,2
was
-0.58.
Such
an
investigation
was
carried
out
in
the
Limousin
programme,
where
112
sires
were
progeny
tested
out
of
470
bulls
tested
in
the
central
station.
Similarly
to
the
Charolais
analysis,
three
sets
of
genetic
parameters
among
progeny
live
weight,
live
muscling
score,
dressing
percentage
and
carcass
fatness
score
were
estimated
according
to
different
models
considering
or
not
the
selection of
bulls
in
the
performance
test
station.
Limousin
bulls
were
selected
according
to
their
final
weight
(FW),
feed
efficiency
(FE),
live
muscling
score
(LM)
and
skeletal
frame
score
(LS).
A
posterior
index
was
calculated
combining
the
FW,
FE,
LM
and
LS.
The
observed
selection
differential
was
about
6.34
for
that
posterior
index
(1)
with
a
selection
intensity
of
0.96.
The
observed
variances
of
the
posterior
index
(I)
before
and
after
selection
were
equal
to
a)
=
43.2
and
U2
&dquo;
=
25.5,
respectively
(0,2,/Ol
=
59
%).
The
relative
reduction
of
the
index
variance
((3)
was
equal
to
-0.41.
Knowing
the
weights
(b
i)
of
traits
(i)
in
the
selection
index
(I
=
L b
iPi
),
i
the
relative
reduction
of
index
variance
(!3)
and
the
correct
genetic
parameters
(h
2
and
rg),
the
genetic
parameters
in
this
sample
of
selected
sires
that
were
expected
to
be
observed
(h e
j
2
Iek h2
and
re9!!)
for
progeny
traits
(j
and
k)
can
be
calculated
algebraically.
The
formulae
initially
given
by
Robertson
[32]
for
single
trait
selection
were
extended
to
a
selection
on
a
selection
index
[23]
(see
Appendix):
where
Q9!
was
the
genetic
standard
deviation
of
trait
i
in
the
sire
selection
index.
2.4.2.
Effect
of
step
1
selection
As
bulls
were
previously
selected
according
to
some
information
at
weaning
before
being
performance
tested
in
the
station,
the
genetic
variability
of
traits
measured
on
progeny
might
eventually
have
been
affected
by
that
step
1
selection.
In
order
to
estimate
the
impact
of
selection
at
weaning
on
the
progeny
genetic
parameters,
weaning
performances
of
all
contemporary
males
raised
in
the
same
herds
should
be
considered.
Performances
at
weaning
of
male
calves
from
the
selected
bull’s
contemporary-herd
group
were
extracted
from
a
data
set
used
in
a
French
beef
bull
evaluation
programme
on
performances
recorded
in
farms
[1].
In
the Charolais
breed,
weaning
performances
of
15143
young
bulls
were
available
(419
tested
in
the
central
station).
In
the
Limousin
breed,
weaning
performances
of
14 909
young
bulls
were
available
(407
tested
in
the
central
station).
Such
an
amount
of
information
prevents
one
from
integrating
weaning
traits
together
with
progeny
traits
in
a
multiple
trait
analysis
for
estimating
genetic
parameters
free
of
that
selection
effect.
It
was
only
possible
to
use
the
algebraic
formulae
(1
and
2)
for
predicting
what
should
have
been
the
impact
of
that
selection.
The
use
of
these
formulae
required,
however,
that
true
j3
and
genetic
parameters
be
known.
As
the
actual
criteria
used
to
choose
tested
bulls
were
unknown,
an
intensity
of
selection
at
weaning
was
calculated
postulating
that
AI
co-operatives
did
select
the
male
calves
according
to
weight
(WW),
muscularity
(WM)
and,
in
the
Limousin
programme,
skeletal
frame
(WS)
at
weaning.
’Superiority’
of
each
selected
male
was
calculated
as
the
standardised
dif-
ference
between
its
performances
(WW,
WM
or
WS)
and
the
average
of
male
calves
from
its
contemporary-herd
group:
where
Sh!i
was
the
’superiority’
for
trait
i
(i
=
WW,
WM
or
WS)
of
selected
calf j
raised
in
the
contemporary-herd
group
h;
Ph!i
was
the
performance
of
this
calf j
for
trait
i;
P
hi
was
the
mean
of
the
male
contemporary-herd
group
h;
and
Qhi
was
the
standard
deviation
in
this
group.
A
posterior
selection
index
(I)
was
calculated,
combining
these
’superiorities’
for
WW,
WM
and,
in
the
Limousin
programme,
WS.
In
the
Charolais
programme,
the
observed
selection
differential
was
about
35.5
for
that
posterior
index
(1)
and
the
observed
variance
(
QI
)
before
selection
was
400.0.
Hence,
the
observed
selection
intensity
was
equal
to
1.78.
The
variance
of
the
posterior
index
(I)
after
selection
was
a 2!,
=
186.0
(a
Js
/a
J
=
47
%).
The
relative
reduction
of
the
index
variance
(0)
was
therefore
equal
to
- 0.54.
In
the
Limousin
programme,
the
observed
selection
differential
was
about
30.3
for
that
posterior
index
(I)
and
the
observed
variance
(!1)
before
selection
was
400.0.
Hence,
the
observed
selection
intensity
was
equal
to
1.52.
The
variance
of
the
posterior
index
(I)
after
selection
was
ay
s
=
179.3
(0,2,/
a2 1
=
45
%).
The
relative
reduction
of
the
index
variance
(0)
was
equal
to
-0.55.
Since
the
true
genetic
correlations
(ri! )
between
weaning
traits
on
farms
and
traits
recorded
in
the
progeny
test
were
not
known,
those
estimated
between
post-weaning
traits
of
sires
(LW
for
WW,
LM
for
WM
and
LS
for
WS)
and
traits
recorded
in
the
progeny
test
measured
in
the
stations
(tables
II
and
III)
have
been
considered
as
the
soundest
correlations.
Heritabilities
(h! )
of
progeny
performances
estimated
jointly
to
the
sire’s
own
performance
(see
section
2.4.1)
were
considered
as
the
most
reliable.
2.5.
Models
of
analysis
and
methods
2.5.1.
Models
In
both
breeds,
the
models
of
analysis
of
progeny
traits
included
fixed
envi-
ronmental
effects
and
random
sire
effect(s).
There
were
no
genetic
relationships
among
dams
and
between
dams
and
sires.
Genetic
relationships
among
sires
took
into
account
up
to
two
generations
of
ancestors.
The
following
models
were
used,
subsequently
to
an
analysis
of
variance
that
tested
the
significance
of
the
fixed
effects
(General
Linear
Model,
SAS).
In
both
breeds,
the
main
fixed
effects
were
calving
parity
of
the
dams
(calv:
2,
3, 4,
5
and
over),
region
of
origin
(orig)
and
age-contemporary
group
(cont)
of
the
young
bulls.
Age-contemporary
groups
corresponded
to
age-test
groups
in
the
station.
Other
fixed
effects
included:
in
the
Limousin
model,
a
management
system
up
to
weaning
(manag:
indoor
or
outdoor
weaned
calves);
in
the
Charolais
model:
the
breed
of
the
dam
(breed:
Holstein-Friesian
or
Normand)
and
health
status
in
the
nursery
(pulm
and
diges:
occurrence
or
absence
of
pulmonary
or
digestive
troubles).
In
both
breeds,
average
daily
gain
was
regressed
on
initial
age
(¡3Cov).
Muscling
(LM,
CM),
skeletal
(LS)
and
fatness
(LF,
CF)
scores
were
regressed
on
final
age
in
the
Limousin
breed
and
on
final
weight
in
the Charolais
breed
(¡3Cov).
Ch.:
yi
j
=
cont
ij
+
calv
ij
+
orig
ij
+
breedij
+
pulm
ij
+
diges2!
+
¡3C
OVij
+
si
Lim.:
y2!
=
cont
ij
+
calv
ij
+
orig
ij
+
manage
!-
¡3C
OVij
!-
sz
y2!
was
the
performance
of
the
jth
male
progeny
of
the
ith
sire.
In
the
study
of
the
sire
step
2
selection
effect,
sire
performances
were
analysed
in
an
animal
model
(a)
with
an
age-contemporary
group
(cont).
In
the
Charolais
breed,
pre-test
environment
(pre-test)
fixed
effects
were
added.
A
regression
on
final
age
(¡3Age)
was
performed
for
both
breeds:
Ch.: y
2
=
cont
i+
pre-test
i
+ ,!Agei
+
ai
Lim.: y
i
=
cont
i
+
(3Age
i
+
ai
Yi
was
the
performance
of
the
ith
sire.
2.5.2.
Methods
The
statistical
analyses
were
conducted
separately
in
both
breeds.
General
statistics
were
calculated
using
SAS
procedures.
Genetic
and
phenotypic
variance
and
covariance
components
of
the
progeny
performances
were
estimated
applying
the
restricted
estimation
of
maximum
likelihood
(REML)
method
in
a
multi-trait
(nine
traits)
analysis
for
each
breed
(VCE3.2
Package,
Groeneveld
!11!).
These
components
allowed
the
elaboration
of
phenotypic
correlations
(r
P)
and
genetic
parameters,
heritabilities
and
genetic
correlations
(ha
and
r
a9).
In
the
study
of
the
sire
selection
effect,
the
variance
and
covariance
compo-
nents
among
and
between
sire
performances
and
progeny
traits
were
estimated
in
a
multi-trait
analysis
(four
progeny
traits
(LW,
LM,
DP,
CF)
with
or
with-
out
three
or
four
sire
traits
(FW,
LM,
FE
and,
in
the
Limousin
analysis,
LS)
by
the
REML
method
using
VCE4.2
of
Groeneveld
!11!.
3.
RESULTS
AND
DISCUSSION
3.1.
Means
and
phenotypic
variability
(table
I)
In
the
Limousin
breed,
the
variability
of
initial
weight
was
especially
high
(SD
=
54
kg
and
CV
=
15
%).
The
variability
of
the
corresponding
trait
among
the
Charolais
crossbred
calves
was
moderate
(SD
=
24
kg
and
CV
=
11
%).
Another
analysis
using
Charolais
pure-bred
young
bulls
brought
into
the
progeny
test
station
at
weaning,
gave
high
initial
weight
variability
(SD
=
61
kg
and
CV
=
15
%).
Raising
animals
in
a
common
environment
might
contribute
to
reducing
the
differences
between
animals
due
to
pre-test
conditions.
In
both
progeny
test
stations
the
variability
of
live
weight
around
15
months
(LW:
CV
=
7
and
9
%
in
the Charolais
and
Limousin
programmes,
respectively)
was
lower
than
the
initial
weight
variability
(IW:
CV
= 11
and
15
%,
respectively).
Fattening
progeny
in
a
common
environment
reduced
phenotypic
variability
among
young
bulls.
Variability
of
dressing
percentage
was
low,
similar
to
most
of
the
results
in
the
literature.
Variability
of
morphology
and
fatness
scores
was
relatively
high
with
coeffi-
cients
of
variation
between
9
and
18
%.
The
slaughter
point
criteria
was
expected
to
be
fixed
in
both
programmes:
age
in
the
Limousin
and
weight
in
the
Charolais
programme.
This
was
only
partially
obtained,
especially
in
the
Charolais
breed.
There
were
only
4
days
for
within-year
standard
deviation
(CV
<
1
%)
of
slaughter
age
in
the
Limousin
programme
versus
17
kg
(CV
=
3
%)
for
slaughter
weight
in
the
Charolais
programme.
A
fixed
age
end
point
is
clearly
easier
to
organise
than
a
fixed
weight.
3.2.
Effect
of
selection
of
sires
on
the
genetic
variability
of
progeny
traits
(tables
II
and
III)
3.2.1.
Effect
of
step
2
selection
In
both
programmes,
the
apparent
genetic
parameters
(ha
and
ra
g)
esti-
mated
without
considering
the
effect
of
the
previous
selection
of
sires
were
close
to
the
sound
ones
(h
2
and
r9)
estimated
jointly
with
sire
performance
data
(Charolais:
table
II;
Limousine:
table
III).
Apparent
heritabilities
were
only
slightly
lower
(by
0.02-0.03)
than
correct
ones,
and
genetic
correlations
were
within
0.03
of
sound
ones.
These
differences
depend
on
the
relative
change
of
variance
of
the
traits
under
selection
(0),
the
true
heritability
of
these
traits
and
the
magnitude
and
the
sign
of
the
true
genetic
correlations
between
these
traits
and
progeny
traits.
In
the
present
study,
the
relative
reductions
of
the
selection
criteria
variance,
(3
(o, 28 _ol 2)/0,2,
used
for
computing
the
expected
genetic
parameters
were
negative
(Charolais: -
0.58;
Limousine: -
0.41)
since
unilateral selection
reduced
the
index
variance.
Fimland
[8]
showed
that
the
expected
effect
of
selection
for
performance
is
generally
minor
for
heritabilities.
For
example,
with
close
to -
0.55,
and
heritability
close
to
0.30
and
0.40,
he
predicted
that
the
remaining
genetic
variance
still
represents
about
95
%
of
the
initial
genetic
variance.
On
the
contrary,
a
substantial
modification
of
the
genetic
correlation
(r9!k)
between
two
progeny
traits
may
be
expected
if
at
least
one
of
these
traits
has
a
close
genetic
correlation
with
the
selection
criteria.
Usually,
with
a
negative
,(3
the
change
in
r9!k
is
negative
when
rglj
and
rglk
have
the
same
sign
and
the
change
is
positive
when
rgj
j
and
r
9lk
have
different
signs.
According
to
the
reduced
effect
of
selection
on
genetic
variability
among
progeny,
only
the
genetic
parameters
estimated
without
considering
the
prior
sire
performance
are
presented
in
table
IV,
since
the
nine
progeny
traits
could
be
analysed
simultaneously.
When
the
apparent
genetic
parameters
were
compared
to
the
expected
ones
after
algebraic
correction,
no
difference
was
found
for
live
muscling
scores,
dressing
percentages
and
carcass
fatness
scores
in
either
programme.
Differences
for
heritabilities
were
smaller
than
0.02
and
differences
for
genetic
correlations
were
smaller
than
0.05.
However,
the
differences
for
live
weight
(LW)
were
larger.
For
example,
the
corrected
heritability
of
LW
was
0.07
lower
than
the
apparent
one
in
both
programmes.
Therefore,
the
formulae
used
for
predicting
the
effect
of
selection
were
not
adapted
to
the
real
selection
procedure
for
different
possible
reasons.
The
genetic
correlations
between
sire
and
progeny
traits
used
in
the
algebraic
formulae
might
not
have
been
exactly
the
true
ones
as
they
were
estimated
with
low
accuracy
(average
standard
errors
equal
to
0.10).
The
step
1
selection
could
not
have
been
taken
into
account
since
adding
the
corresponding
amount
of
information
(the
whole
contemporary
group
in
the
herd
of
origin)
made
a
joint
analysis
unfeasible
as
it
would
have
exceeded
the
capacity
of
our
data
processing.
This
step
1
selection
might
have
influenced
the
estimated
genetic
parameters
among
progeny
traits
and
between
sire
and
progeny
traits.
The
selection
procedure
(step
2)
was
certainly
not
a
threshold
selection
on
a
selection
index
combining
only
three
sire
performances
(LW,
LM,
FE)
because
some
sires
with
high
indexes
were
eliminated
either
for
some
defects
(semen
quality,
foot
and
leg
soundness,
etc.)
or
for
breed
standard
criteria.
Consequently,
some
bulls
with
low
indexes
were
kept
(figure
1).
Contrarily
to
the
estimation
of
apparent
genetic
parameters
that
used
information
available
on
progeny
of
145
sires,
the
expected
genetic
parameters
were
calculated
using
the
progeny
of
only
118
sires
that
were
previously
tested
in
the
same
central
station.
The
remaining
27
sires
(! 19
%)
had
various
origins.
In
the
Limousin
programme,
only
112
sires
among
the
131
that
were
progeny
tested
were
previously
selected
in
a
performance
testing
station.
Such
a
loss
of
information
might
have
influenced
the
expected
genetic
correlations
among
progeny
traits.
Effect
of
step
1
selection
In
both
programmes,
the
impact
of
step
1
of
sire
selection
was
lower
than
that
of
step
2.
In
the
Charolais
programme,
the
higher
differences
between
the
expected
and
the
apparent
genetic
parameters
concerned
genetic
correlations
between
live
muscling
score
(LM)
and
live
weight
(LW)
or
dressing
percentage
(DP).
In
the
Limousin
breed,
expected
heritability
of
live
weight
(LW)
and
genetic
correlations
between
LW
and
live
muscling
score
(LM)
or
carcass
fatness
score
(CF)
were
slightly
different
from
the
apparent
ones.
Nevertheless,
in
both
breeds
these
differences
were
not
significant
considering
standard
errors
of
0.04
and
0.07
for
heritabilities
and
genetic
correlations,
respectively,
as
shown
in
table
IV.
Moreover,
genetic
correlations
between
progeny
and
sire
weaning
traits
were,
however,
certainly
lower,
in
absolute
value,
than
those
between
progeny
traits
and
16-month-old
sire
traits
measured
in
the
central
station
that
we
used
for
predicting
the
impact
of
step
1
selection.
As
a
conclusion,
sire
selection
at
weaning
should
only
have
minor
effects
on
genetic
parameters
among
progeny
performance
traits
measured
at
central
and
progeny
test
stations.
3.3.
Heritability
coefficients
(h
2)
Estimates
of
heritabilities
and
their
standard
errors
are
given
in
the
diagonal
of table
IV
(bold
type).
In
both
breeds,
heritabilities
for
the
same
traits
were
close
to
each
other,
in
spite
of
a
shorter
pre-test
adaptation
period
in
the
Limousin
than
in
the
Charolais
programme,
except
for
the
muscling
scores
(LM,
CM).
They
were
accurately
estimated,
with
low
standard
errors.
3.3.1.
Growth
traits
Heritabilities
of
weight
at
the
beginning
of
the
progeny
testing
(IW)
were
lower
(h
2
=
0.14)
than
those
of
the
other
post-weaning
growth
traits
(h 2 !!
0.30).
This
increase
in
heritability
was
due
to
a
marked
reduction
in
envi-
ronmental
variability,
relative
to
the
mean,
while
genetic
variability
remained
roughly
constant
with
a
coefficient
of
genetic
variation
of
5-7
%.
The
high
environmental
variability
of
initial
weight
of
Charolais
dairy
crossbred
calves
might
have
been
due
to
health
problems
in
the
nursery
prior
to
the
test
as
a
consequence
of
concentrating
numerous
calves
from
many
herds.
The
high
en-
vironmental
variability
of
initial
weight
of
Limousin
calves
was
certainly
due
to
large
differences
between
pre-test
environments,
late
entrance
and
short
adap-
tation
periods.
In
the
Blond
d’Aquitaine
breed,
Renand
et
al.
[30]
also
found
a
heritability
lower
for
initial
weight
(h
2
=
0.10)
than
for
the
weight
(h
2
=
0.24)
of
500-day
pure-bred
suckling
calves.
A
lower
heritability
of
weaning
weight
of
suckling
calves
compared
to
post-weaning
growth
traits
was,
also,
generally
ob-
served
in
the
literature
[2,
15, 33].
This
may
partly
explain
the
low
heritability
of
initial
weight
that
was
recorded
only
1
month
after
weaning
in
the
Limousin
testing
programme.
The
heritability
coefficients
of
post-weaning
growth
traits -
average
daily
gain
(ADG)
and
final
live
weight
(LW) -
were
slightly
higher
in
the
Charolais
breed
(h2 !
0.32)
than
in
the
Limousin
breed
(h2 !
0.26).
Limousin
coefficients
were
similar
to
the
coefficients
found
in
Blond
d’Aquitaine
by
Renand
et
al.
!30!:
h2 !
0.26.
Mohuiddin
[21]
also
reviewed
higher
heritabilities
for
growth
traits
in
the
Charolais
than
in
the
Limousin
breed.
The
heritabilities
in
the
Charolais
breed
were
close
to
those
of
18-month-old
Charolais
heifers
in
the
testing
station
(h2 !
0.33
final
weight)
presented
by
Menissier
[18]
and
by
Renand
et
al.
[31]
for
progeny-tested
Charolais
bulls
in
a
divergent
selection
experiment
(h
2
=
0.27
average
daily
gain).
Many
genetic
parameters
for
growth
traits
have
already
been
estimated
[15,
21].
Most
of
these
analyses
present
moderate
to
high
heritabilities
for
growth
traits.
3.3.2.
Morphology
scores
Morphology
scores
recorded
during
the
month
before
slaughter
also
exhibited
medium
heritabilities.
In
both
breeds,
heritability
of
carcass
muscling
score
(CM)
was
slightly
lower
than
those
of
the
live
muscling
score
(LM)
(0.20
and
0.25
versus
0.31
and
0.38
for
CM
and
LM
in
the
Limousin
and
the
Charolais
breed,
respectively).
Renand
et
al.
[30]
obtained
similar
heritabilities
for
both
scores
(h2
M
=
0.38
versus
h2 M
=
0.36)
in
the
Blond
d’Aquitaine
breed.
On
the
contrary,
Dijkstra
et
al.
[7]
found
a
higher
heritability
for
the
carcass
muscling
score.
In
the
literature,
muscularity
of
live
animals
is
assessed
either
by
visual
scores,
body
measurements
or
scanning
measurements
of
the
rib
eye
depth
or
area.
Visual
scores,
body
and
scanning
measurements
are
usually
moderately
heritable
(h2 !
0.28
[2,
21]).
The
heritabilities
of
carcass
measurements
are
slightly
higher
(h2 !
0.41
!15!;
h2
=
0.73
!6!).
Heritabilities
of
live
skeletal
frame
scores
(LS)
in
both
breeds
were
moderate
(h2 !
0.29).
These
coefficients
were
close
to
the
heritability
estimated
for
LS
by
Renand
et
al.
[30]
in
Blond
d’Aquitaine.
Skeletal
frame
scores
are
less
frequently
studied
than
muscular
development.
Heritability
coefficients
of
both
morphology
scores
of
Limousin
and
Charolais
females
were
estimated
by
Sapa
et
al.
[33]
for
18-month-old
heifers
recorded
in
progeny
testing
stations.
They
found
higher
heritabilities
as
compared
to
the
present
study:
h2
=
0.52
and
0.43,
respectively,
for
muscling
scores
in
the
Limousin
and
Charolais
breeds
and
h2
=
0.48
and
0.37
for
skeletal
frame
scores.
Chavaz
[5]
also
observed
that
heritabilities
of
height
at
wither
and
length
score
of
dual
purpose
breed
heifers
are
higher
than
muscling
and
width
scores.
3.3.3.
Fatness
traits
In
both
breeds,
heritabilities
of
live
fat
scores
were
lower
(h2 !
0.17)
than
those
of
carcass
fat
scores
(h
2
=
0.44).
These
scores
did
not
represent
the
same
trait.
Live
fatness
score
was
visual
and
evaluated
subcutaneous
fat
thickness.
Internal
carcass
fatness
was
a
visual
score
of
the
amount
of
channel
fat.
The
genetic
variability
of
live
fat
score
was
generally
lower
than
that
of
carcass
fat.
Renand
et
al.
[30]
estimated
similar
and
moderate
heritabilities for
live
fat
covering
and
internal
fatness
scores
(h2 !
0.30)
in
the
Blond
d’Aquitaine
breed.
In
the
literature,
it
appears
that
heritability
of
live
visual
or
handling
appraisal
of
the
subcutaneous
fat
thickness
is
lower
(0.05
!22!,
0.27
!7!)
than
its
ultrasound
or
carcass
measurements
((21!:
from
0.21
to
0.57).
Genetic
variability
of
carcass
fatness
is
therefore
better
estimated
when
scoring
carcasses
than
scoring
live
animals.
All
of
these
fatness
traits
should
be
genetically
improved
by
direct
selection
although
there
is
some
difficulty
in
measuring
them
accurately
on
a
large
scale.
3.3.4.
Dressing
percentage
(DP)
In
both
breeds,
heritability
of
dressing
percentage
was
higher
than
those
estimates
for
growth
and
conformation.
Genetic
variability
of
carcass
yield
was
slightly
higher
in
the
Limousin
than
in
the
Charolais
breed
(h
2
=
0.50
and
h2
=
0.43,
respectively).
Fixed
weight
at
slaughter
in
the
Charolais
breed
might
have
contributed
to
a
decreased
DP
variability.
However,
in
a
literature
review,
Koots
et
al.
[15]
obtained
similar
average
heritabilities
for
DP
at
fixed
weight
or
fixed
age
end
points.
Renand
et
al.
[30]
estimated
a
moderate
heritability
for
DP
(0.24 !
0.12)
among
Blond
d’Aquitaine
young
bulls
slaughtered
at
a
fixed
age
of
529
days.
In
the
literature,
heritabilities
for
carcass
yield
are
moderate
(0.18:
[38])
to
very
high
(0.72:
!3!).
All
of
the
analysed
growth,
morphology
and
carcass
composition
perfor-
mances
had
moderate
heritabilities.
They
can,
therefore,
be
improved
through
genetic
selection.
Nevertheless,
the
efficiency
of
selection
may
be
influenced
by
the
genetic
correlations
between
the
selected
traits
and
the
other
ones.
3.4.
Phenotypic
and
genetic
correlation
coefficients
The
estimates
of
phenotypic
and
genetic
correlation
(!
standard
errors)
coefficients
are
reported
in
table
IV.
Most
of
the
correlation
standard
errors
estimated
with
VCE
were
close
to
0.08.
However,
approximate
standard
errors
of
correlations
[34]
assuming
a
balanced
scheme
were
about
twice
those
given
by
VCE.
3.4.1.
Correlations
among
growth
traits
The
genetic
correlations
among
growth
traits
estimated
in
this
study,
were
close
to
those
reported
by
Koots
et
al.
[16].
Most
of
them
were
highly
positive
and
favourable.
The
genetic
correlations
were
more
pronounced
than
the
phenotypic
ones,
whereas,
in
the
literature,
the
genetic
and
phenotypic
correlations
among
post-weaning
growth
traits
are,
usually,
similar
!16!.
In
our
study
and
in
both
breeds,
average
daily
gain
in
the
station
was
phenotypically
independent
of
initial
weight
while
both
growth
traits
were
genetically
linked
(r
9
.^s
0.33).
These
results
show
that
the
correlation
between
pre-test
and
test
environment
effects
was
probably
slightly
negative.
There
was
certainly
some
compensatory
growth
during
the
test
period.
In
the Charolais
progeny,
final
live
weight
(LW)
was
more
closely
related
to
daily
gain
(rp
=
0.84
and
rg
=
0.91)
than
to
initial
weight
(rp
=
0.52
and
rg
=
0.62).
Both
traits
were
equivalently
genetically
related
to
final
weight
in
the
Limousin
progeny
(rg
=
0.83
and
0.84).
The
same
has
been
observed
by
Renand
et
al.
[30]
in
the
Blond
d’Aquitaine
breed
where
progeny
suckling
calves
entered
the
station
after
weaning.
The
longer
the
length
of
the
test
period
compared
to
the
initial
age,
the
more
final
weight
was
influenced
by
daily
gain
measured
during
the
test.
3.4.2.
Correlations
between
growth
traits
and
dressing
percentage
(DP)
In
the
Limousin
breed,
growth
traits
and
DP
were
phenotypically
indepen-
dent.
In
the
Charolais
breed,
initial
weight
(IW)
and
DP
were
phenotypically
independent.
On
the
contrary,
the
phenotypic
correlations
between
final
live
weight
(LW)
or
average
daily
gain
(ADG)
and
DP
were
slightly
negative.
Such
very
low
phenotypic
relations
between
DP
and
growth
traits
have
already
been
observed
[16,
30].
Genetic
correlations
between
DP
and
growth
traits
were
all
negative
(-0.02
to
-0.21),
then
unfavourable,
especially
in
the
Limousin
breed.
Nevertheless,
as
previously
observed
by
Koots
et
al.
(16!,
the
genetic
correlations
estimated
between
age-adjusted
carcass
weight
and
live
growth
traits
were
positive.
In
the
Limousin
and
Charolais
breeds
genetic
correlations
between
age-adjusted
carcass
weight
and
final
live
weight
were:
r9
=
0.93
and
r9
=
0.85,
respectively.
Carcass
weight
was
improved
in
spite
of
the
decrease
in
the
DP
genetic
level
when
selecting
final
live
weight.
3.4.3.
Correlations
among
conformation
traits
As
for
growth
traits,
most
of
the
genetic
correlations
among
conformation
traits
were
stronger
than
phenotypic
correlations.
In
both
breeds,
the
correlations
estimated
between
live
and
carcass
muscling
scores
were
very
high
(rp m
0.70
and
rg x5
0.85)
and
close
to
those
observed
by
Renand
et
al.
[30]
in
the
Blond
d’Aquitaine
breed
(rg
=
0.76).
Carcass
muscling
score
(CM)
may
be
easily
improved
through
selection
for
live
muscling
score
(LM).
In
both
breeds,
muscling
(CM,
LM)
and
skeletal
(LS)
development
were
phenotypically
independent.
Corresponding
genetic
correlations
were
null
and
moderately
negative
in
the
Charolais
and
Limousin
breeds,
respectively.
In
the
literature,
studies
on
the
relation
between
muscularity
and
frame
development
are
scarce
as
scoring
LS
is
not
usual.
In
the
Canadian
Limousin
breed,
Miglior
et
al.
[19]
estimated
a
positive
genetic
correlation
between
LS
and
LM
(rg
=
0.55).
In
the
Blond
d’Aquitaine
breed,
at
a
constant
slaughter
age,
Renand
et
al.
[30]
estimated
a
positive
genetic
correlation
between
LS
and
CM
(rg
=
0.50)
while
LS
and
LM
were
genetically
independent
(rg
=
-0.02).
3.4.4.
Correlations
among
fatness
traits
As
observed
by
Renand
et
al.
[30]
in
the
Blond
d’Aquitaine
breed,
phenotypic
and
genetic
correlations
between
live
fatness
covering
score
(LF)
and
carcass
fatness
score
(CF)
were
moderate
even
if
positive
in
the
Charolais
and
Limousin
breeds.
As
already
suggested,
LF
and
CF
did
not
represent
the
same
traits.
Subcutaneous
fat
deposition
may
not
use
the
same
physiological
mechanisms
as
channel
fat
deposition
or
marbling
settlement
!2, 12,
36!.
These
low
correlations
might
certainly
also
be
due
to
errors
when
scoring
fatness
on
live
animals
or
carcasses.
In
the
literature,
higher
genetic
correlations
can
be
found
among
different
fatness
carcass
measurements
(subcutaneous
fat
thickness,
internal
fatness
score,
marbling
score,
etc.)
[14,
17,
30!.
3.4.5.
Correlations
between
growth
traits
and
morphology
scores
In
the
Limousin
breed,
phenotypic
and
genetic
correlations
between
growth
traits
(ADG,
IW,
LW)
and
live
or
carcass
morphology
scores
(LM,
CM,
LS)
were
all
positive.
They
were
higher
with
the
skeletal
development
score
(LS)
than
with
muscling
scores
(CM
and
LM).
Hence,
in
this
breed,
live
growth
was
mainly
linked
to
skeletal
development.
According
to
the
genetic
independence
between
LS
and
dressing
percentage
(DP),
the
moderate
and
positive
correlations
between
DP
and
muscling
scores
(LM,
CM)
and
the
moderate
but
negative
correlations
between
DP
and
the
growth
traits
(IW,
LW,
ADG),
carcass
weight
(CW)
was
more
related
to
skeletal
frame
rather
than
muscling.
Further
analyses
confirmed
this
assessment
(rg
=
0.60
between
CW
and
LS
and, r9 !
0.41
between
CW
and
LM
or
CM).
In
the
Charolais
breed,
genetic
and
phenotypic
correlations
between
growth
performance
and
morphology
traits
were
lower
than
in
the
Limousin
breed.
The
highest
genetic
correlations
were
observed
between
ADG
or
LW
and
live
muscling
score
(LM)
(0.23
and
0.25,
respectively).
Growth
traits
and
carcass
muscling
score
(CM)
were
independent.
Due
to
the
higher
genetic
correlations
between
DP
and
muscling
scores
(LM,
CM:
0.60)
than
between
DP
and
LS
(0.27),
carcass
weight
(CW)
was
more
related
to
muscling
development
rather
than
skeletal
development.
This
was
also
confirmed
by
further
analyses
(rg
=
0.20
between
CW
and
LS
and,
r9 !
0.58
between
CW
and
LM).
The
genetic
relation
between
growth
and
morphology
might
also
depend
on
the
objective
of
the
selection
programme.
In
the
Limousin
breed,
most
of
the
production
consisted
of
pure-bred
young
calves.
Therefore,
large
frame
sires
were
preferentially
selected.
On
the
contrary,
in
the
Charolais
programme,
compact
sires
(high
muscling)
were
selected
to
procreate
crossbred
young
bulls.
Breed
and
fixed
final
point
could
also
influence
the
relation
between
morphology
and
growth
rate
[27].
In
the
literature
[16,
19,
21,
36,
37!,
genetic
correlations
between
muscle
development
and
growth
(especially
carcass
growth)
vary:
from
-0.66
[21]
to
0.90
[19].
Estimation
of
the
correlations
between
skeletal
development
and
growth
are
scarce
(0.23
with
ADG
and
0.34
with
weight
!19!).
3.4.6.
Correlations
between
fatness
traits
and
growth
traits,
morphology
scores
and
dressing
percentage
The
two
breeds
presented
the
same
genetic
relation
between
fatness
traits
(LF,
CF)
and
dressing
percentage
(DP).
Genetic
correlations
were
negative,
then,
favourable.
They
were
closer
with
LF
(rg x
5
-0.48)
than
with
CF
(rg x5
-0.32).
In
both
breeds,
phenotypic
correlations
between
fatness
and
growth
traits
or
morphology
scores
were
low.
In
the
Limousin
breed,
at
a
constant
age,
those
with
live
or
carcass
fatness
scores
were
all
lowly
positive:
rp m
0.15
on
average.
In
the Charolais
breed,
at
a
constant
weight,
fatness
scores
were
almost
independent
of
growth
traits:
rp x5
0.05
and
lowly
opposed
with
morphology
scores:
rp x
5
-0.15.
Genetic
correlations
of
live
fatness
scores
with
other
traits
differed
from
genetic
correlations
of
carcass
fatness
with
these
other
traits.
On
average,
fatness
had
a
positive
genetic
correlation
with
growth
traits
in
the
Limousin
breed:
r9 !
0.36,
from
0.31
to
0.38,
then
unfavourable.
Heavier
Limousin
young
bulls
at
the
end
of
the
test
tended
to
have
higher
backfat
thickness
and
larger
amounts
of
channel
fat.
In
the Charolais
breed,
these
genetic
correlations
were
around
zero:
rg !
0.01,
from
-0.16
to
0.17.
In
contrast,
the
genetic
correlations
of
fatness
scores
with
morphology
scores
were
around
zero
in
the
Limousin
breed:
rg m
0.00,
from
-0.27
to
0.20,
while
they
were
all
negative,
favourable,
in
the
Charolais
breed:
r9 !
-0.36,
from
- 0.61
to
-0.17.
Muscled
or
large
frame
Charolais
young
bulls
tended
to
have
lower
fatness
scores.
In
the
Blond
d’Aquitaine
breed,
Renand
et
al.
[30]
estimated
different
relations
between
fatness
traits
and
growth
or
morphology
traits.
The
genetic
correlations
between
carcass
fatness
and
growth
traits
were
slightly
positive
(rg
=
0.05
and
0.21
with
AGD
and
LW,
respectively).
Carcass
fatness
(CF)
was
almost
independent
of
morphology
traits
(rg
=
0.12,
-0.05
and
0.16
with
LM,
CM
and
LS,
respectively).
Genetic
type
might
be
the
main
factor
of
discrimination
of
fatness
status
between
breeds.
These
differences
could
also
be
due
to
a
final
fixed
point
that
might
influence
the
degree
of
maturity
at
slaughter
and,
therefore,
fat
deposition
intensity.
Renand
[27]
in
a
literature
review
found
lower
genetic
correlations
between
fat
thickness
and
growth
rate
(GR)
or
rib
eye
area
(REA)
at
a
fixed
weight
final
point
(-0.36:
GR;
-0.38:
REA)
than
at
a
fixed
age
final
point
(0.31:
GR;
-0.11
REA).
These
tendencies
were
similar
to
those
we
observed
(Charolais:
fixed
weight;
Limousin
and
Blond
d’Aquitaine:
fixed
age).
In
the
literature,
genetic
correlations
between
fatness
and
muscling
are
usually
negative:
from
-0.04
[17]
to
-0.47
!36!.
In
contrast,
genetic
correlations
estimated
between
fatness
and
growth
traits
are
usually
positive
(21!.
4.
CONCLUSION
The
prior
selection
of
sires
did
not
have
an
important
effect
on
the
estimation
of
genetic
parameters,
in
spite
of
the
expected
impact
calculated
on
some
parameters
(tabLes
II
and
III).
The
estimated
heritability
coefficients
for
growth
traits,
morphology
and
carcass
fatness
scores
showed
the
same
tendencies
in
the
Charolais
and
the
Limousin
breeds.
Most
of
them
were
moderate
(from
0.20
to
0.40).
Dressing
percentage
and
internal
fat
score
showed
higher
heritabilities
(! 0.40).
Breeds
did
not
show
the
same
genetic
relationships
between
traits,
probably
due
to
the
genetic
background
and
the
breed
objective.
Nevertheless,
in
both
breeds,
due
to
high
genetic
correlations,
carcass
weight
and
muscularity
can
be
easily
improved
via
genetic
selection
combining
live
growth
rate
and
live
muscle
development
score
of
the
progeny.
In
contrast,
carcass
composition,
such
as
carcass
fatness
score,
was
poorly
or
moderately
correlated
with
live
performances.
In
France,
sire
indices
are
published
with
a
corresponding
coefficient
of
determination
(CD)
and
only
sires
with
a
CD
higher
than
0.50
are
allowed
to
be
used
for
artificial
insemination
[1].
The
CD
of
a
progeny-
tested
sire
depends
on
the
heritabilities
and
the
amount
of
information
available
for
each
tested
sire
and
for
each
reference
sire
and
on
the
number
of
sires
simultaneously
progeny
tested
[9].
When
heritability
is
0.40
and
ten
sires
are
simultaneously
progeny
tested
with
three
reference
sires,
18
progeny
per
tested
sire
and
22
per
reference
sire
have
to
be
tested
to
reach
a
CD
equal
to
0.50
!1!.
Only
progeny
testing
station
allows
one
to
reach
such
an
accuracy
with
such
a
number
of
progeny.
Since
the
environment
and
the
slaughter
conditions
are
under
control,
heritabilities
may
be
higher
and
performances
can
be
measured
more
precisely
as
compared
to
farm
or
slaughterhouse
performance
recordings.
Selection
intensity
of
AI
bulls
based
on
performance
of
their
progeny
controlled
in
the
station
is
limited
by
the
restricted
number
of
sires
that
can,
however,
be
progeny
tested
per
year.
In
these
selection
programmes,
the
objective
of
progeny
testing
is
principally
to
obtain
accurate
breeding
value
estimates
of
slaughter
performances
while
the
objective
of
performance
testing
is
principally
to
obtain
genetic
superiority
of
live
traits.
The
genetic
superiority
of
these
sires
is
expected
to
be
predominantly
acquired
during
the
previous
steps
of
sire
selection
especially
at
the
end
of
their
own
post-weaning
performance
recording
in
central
test
stations
(step
2).
Whether
or
not
these
previous
steps
are
efficient
to
improve
the
beef
traits
of
their
progeny
have
to
be
analysed,
estimating
the
genetic
correlations
between
the
sire
and
their
progeny
traits.
REFERENCES
[1]
Anonym,
Repertoire
Francais
des
méthodes
et
des
procedures
de
contrôle
et
d’evaluation
génétique
des
reproducteurs
ovins
et
bovins
de
races
allaitantes,
Institut
de
1’elevage,
compte
rendu
no.
2316,
Paris,
France,
1995.
[2]
Arnold
J.W., Bertrand
J.K., Benyshek
L.L., Ludwig
C.,
Estimates
of
genetic
parameters
for
live
animal
ultrasound,
actual
carcass
data
and
growth
traits
in
beef
cattle,
J.
Anim.
Sci.
69
(1991)
985-992.
[3]
Averdunk
G.,
Woodward
B.,
Sauerer
G.,
Schild
H.J.,
Reinhardt
F.,
Perfor-
mance
test
results
in
relation
with
progeny
tests
under
station
and
field
conditions
for
Fleckvieh,
in:
Korver
S.,
Averdunk
G.,
Andersen
B.B.
(Eds.),
Performance
Testing
of
AI
Bulls
for
Efficiency
and
Beef
Production
in
Dairy
and
Dual-purpose
Breeds,
EAAP
Publication,
34,
Pudoc,
Wageningen,
The
Netherlands,
1987,
pp.
36-44.
[4]
Bulmer
M.G.,
The
effect
of
selection
on
genetic
variability,
Am.
Nat.
105
(1971)
201-211.
[5]
Chavaz
J.,
Relationship
between
performance
test
and
various
progeny
traits
in
the
Swiss
dual
purpose
breeds,
in:
Korver
S.,
Averdunk
G.,
Andersen
B.B.
(Eds.),
Performance
Testing
of
AI
Bulls
for
Efficiency
and
Beef Production
in
Dairy
and
Dual-purpose
Breeds,
EAAP
Publication,
34,
Pudoc,
Wageningen
The
Netherlands,
1987, pp.
52-58.
[6]
Cundiff
L.V.,
Chambrers
D.,
Stephens
D.F.,
Willham
R.L.,
Genetic
analysis
of
some
growth
and
carcass
traits
in
beef
cattle,
J.
Anim.
Sci.
23
(1964)
1133-1138.
[7]
Dijkstra
J.,
Oldenbroek
J.K.,
Korver
S.,
Van
Der
Werf
J.H.J.,
Breeding
for
veal
and
beef
production
in
Dutch
red
and
white
Cattle,
Livest.
Prod.
Sci.
25
(1990)
183-198.
[8]
Fimland
E.A.,
The
effect
of
selection
on
additive
genetic
parameters,
Z.
Tierziichtg.
Ziichtgsbiol.
96
(1979)
120-134.
[9]
Foulley
J.L.,
Clerget-Darpoux
F.,
Progeny
group
size
for
evaluating
natural
service
bulls
using
AI
reference
sires.
Ann.
Genet.
Sel.
Anim.
10
(1978)
541-556.
[10]
Groeneveld
E.,
REML
VCE,
Version
3.2,
User’s
Guide,
Federal
Research
Center
of
Agriculture,
Mariensee,
Germany,
1996.
[11]
Groeneveld
E.,
REML
VCE,
Version
4.2,
User’s
Guide,
Federal
Research
Center
of
Agriculture,
Mariensee,
Germany,
1998.
[12]
Hirooka
H., Groen
A.F., Matsumoto
M.,
Genetic
parameters
for
growth
and
carcass
traits
in
Japanese
Brown
cattle
estimated
from
field
records,
J.
Anim.
Sci.
74
(1996)
2112-2116.
[13]
Journaux
L.,
Estimation
conjointe
des
composantes
de
la
variance
en
contrôle
individuel
et
en
contrôle
de
descendance
par
la
m6thode
du
Maximum
de
Vraisem-
blance
Restreinte,
Report,
1991,
45
p.
[14]
Koch
R.M.,
Selection
in
beef
cattle.
III -
Correlated
response
of
carcass
traits
to
selection
for
weaning,
yearling
weight
and
muscling
score
in
cattle,
J.
Anim.
Sci.
47
(1978)
142-150.
[15]
Koots
K.R.,
Gibson
J.P.,
Smith
C.,
Wilton
J.W.,
Analyses
of
published
genetic
parameter
estimates
for
beef
production
traits.
I -
Heritability,
Anim.
Breed.
Abstr.
62
(1995)
309.
[16]
Koots
K.R.,
Gibson
J.P.,
Smith
C.,
Wilton
J.W.,
Analyses
of
published
genetic
parameter
estimates
for
beef
production
traits.
II -
Phenotypic
and
genetic
correlations,
Anim.
Breed.
Abstr.
62
(1995)
825.
[17]
Lamb
M.A.,
Robison
O.W.,
Tess
M.W.,
Genetic
parameters
for
carcass
traits
in
Hereford
bulls,
J.
Anim.
Sci.
68
(1990)
64-69.
[18]
Menissier
F.,
Comments
on
optimization
of
cattle
breeding
schemes:
beef
breeds
for
suckling
herds:
a
review,
Ann.
Genet.
Sel.
Anim.
8
(1976)
71-87.
[19]
Miglior
F.,
Kemp
R.A.,
Burnside
E.B.,
Genetic
parameter
estimates
of
con-
formation
and
performance
traits
in
station-tested
Limousin
bulls,
Can.
J.
Anim.
Sci.
74
(1994)
379-381.
[20]
Minvielle
F.,
Principes
d’amélioration
génétique
des
animaux,
Les
Presses
de
l’Universit6
Laval,
INRA,
1990,
232
p.
[21]
Mohiuddin
G.,
Estimates
of
genetic
and
phenotypic
parameters
of
some
performance
traits
in
beef
cattle,
Anim.
Breed.
Abstr.
61
(1993)
495-522.
[22]
Oldenbroek
J.K., Laurijsen
H.A.J., ten
Napel
J.,
Relationship
between
per-
formance
test
and
progeny
test
for
veal
and
beef
production
in
Black
and
White
dairy
cattle,
in:
Korver
S.,
Averdunk
G.,
Andersen
B.B.
(Eds.),
Performance
Testing
of AI
Bulls
for
Efficiency
and
Beef
Production
in
Dairy
and
Dual-purpose
Breeds,
EAAP
Publication,
34,
Pudoc,
Wageningen
The
Netherlands,
1987,
pp.
45-51.
[23]
Ollivier
L.,
Derrien
A.,
Une
m6thode
g6n6rale
d’estimation
des
parametres
génétiques
dans
un
echantillon
selectionne,
avec
une
application
a
une
selection
sur
un
indice
a
trois
caractères,
Ann.
Genet.
Sel.
Anim.
13
(1981)
231-292.
[24]
Pearson
K.,
On
the
influence
of
natural
selection
on
the
variability
and
correlation
of
organs,
R.
Soc.
London.
Phil.
Trans.
A
200
(1903)
1-66.
[25]
Renand
G.,
Genetic
parameters
of
French
beef
Breeds
used
in
crossbreeding
for
young
bull
production.
I -
Live
performance,
Genet.
Sel.
Evol.
(1985)
17
(1985)
153-170.
[26]
Renand
G.,
Genetic
parameters
of
French
beef
breeds
used
in
crossbreeding
for
young
bull
production.
II -
Slaughter
performance,
Genet.
Sel.
Evol.
17
(1985)
265-282.
[27]
Renand
G.,
Genetic
determinism
of
carcass
and
meat
quality
in
cattle,
3rd
World
Congress
on
Sheep
and
Beef
Cattle
Breeding
1,
INRA
publ., Paris,
1998,
pp.
381-395.
[28]
Renand
G.,
Mise
en
place
du
Vachotron
II,
Séminaire
Planification
Expéri-
mentale
en
Génétique
Animale
à
St
Martin
de
Re,
INRA,
Paris,
1996,
pp.
123-134.
[29]
Renand
G.,
Gaillard
J.,
Variability
of
direct
genetic
effects
on
growth
and
slaughter
performance
in
the
Charolais
breed
for
production
of
young
beef
bulls,
Proc.
2nd
World
Congr.
Genet.
Applied.
Livest.
Prod.,
Madrid,
1982,
pp.
356-362.
[30]
Renand
G.,
Gaillard
J.,
Menissier
F.,
Genetic
parameters
for
growth
and
slaughter
traits
of
purebred
Blond
d’Aquitaine
young
bulls,
37th
Annual
Meeting
of
the
EAAP,
Budapest,
Hungary,
1986.
[31]
Renand
G.,
Fouilloux
M.N.,
Menissier
F.,
Genetic
improvement
of
beef
pro-
duction
traits
by
performance
testing
beef
bulls
in
France,
Proc.
6th
World
Congr.
Genet.
Applied.
Livest.
Prod.,
Armidale
23
(1998)
77-80.
[32]
Robertson
A.,
The
effect
of
selection
on
the
estimation
of
genetic
parameters,
Z.
Tierz.
Zuechtungsbiol.
94
(1977)
131-135.
[33]
Sapa
J.,
Menissier
F.,
Renand
G., Liboriussen
T., Courteix
S., Duclaud
P.J.,
Variabilite
génétique
la
croissance
et
de
la
fertilite
de
génisses
de
races
à viande
Fran
C
aises
spécialisées,
41st
Annual
Meeting
of
the
European
Association
for
Animal
Production,
Toulouse,
France,
1990.
[34]
Tallis
G.M.,
Sampling
errors
of
genetic
correlation
coefficients
calculated
from
analyses
of
variance
and
covariance,
Aust.
J.
Stat.
1
(1959)
35-43.
[35]
Van
der
Werf
J.H.J,
de
Boer
I.J.M,
Estimation
of additive
genetic
variance
when
base
population
are
selected,
J.
Anim.
Sci.
68
(1990)
3124-3132.
[36]
Wilson
L.L.,
Mc
Curley
J.R.,
Ziegler
J.H.,
Watkins
J.L.,
Genetic
parame-
ters
of
live
and
carcass
characters
from
progeny
of
Polled
Hereford
and
Angus-Holstein
cows,
J.
Anim.
Sci.
43
(1976)
569-576.
[37]
Wilson
D.E.,
Willham
R.L.,
Northcutt
S.L.,
Rouse
G.H.,
Genetic
parame-
ters
for
carcass
traits
estimated
from
Angus
field
records,
J.
Anim.
Sci.
71
(1993)
2365-2370.
[38]
Woodward
B.W.,
Pollak
E.J.,
Quaas
R.L.,
Parameter
estimation
for
carcass
traits
including
growth
information
of
Simmental
beef
cattle
using
Restricted
Maxi-
mum
Likelihood
with
a
multiple-trait
model,
J.
Anim.
Sci.
70
(1992)
1098-1109.
APPENDIX:
Effect
of
the
previous
selection
of
sires
on
the
genetic
variability
of
progeny
traits
a) If
no
sire
selection
occurred,
progeny
performance
trait
(P)
and
its
variance
u2
p
could
be
broken
down
into
their
identified
environmental
(F),
genetic
(g)
and
residual
(e)
components
as
follow:
where
P
is
the
progeny
performance,
F
is
the
fixed
effect, g
is
the
direct
genetic
additive
value,
s
is
the
’paternal’
component
of
the
genetic
additive
value
g,
m
is
the
’maternal’
component
of
the
genetic
additive
value
g,
gs
is
the
direct
genetic
additive
value
of
the
sire
(2gs
=
8
),
gm
is
the
direct
genetic
additive
value
of
the
dam
( 2 g
M
=
m), 0
is
Mendelian
sampling
E
=
m
+
0,
e
is
the
residual.
All
the
covariances
between
s
(or
m), 0
and
e
were
considered
null.
As
sires
and
dams
were
random
mated,
the
covariance
between
s
and
m
was
null.
Moreover,
if
no
selection
occurred
then
Q9 =
a2!,
consequently ,
Then,
the
heritability
was ,
<
and
the
genetic
correlation
between
two
progeny
traits, j
and
k,
was
a)
If
sire
selection
occurred,
equations
(1)
and
(2)
were
transformed
as
follow:
parameters
modified
by
the
selection
were
quoted
with
a ’s’
subscript.
As
sire
selection
occurred,
(
T2
was
not
changed:
QE
=
-cr!; 3
unlike
o,2
=
Io
r2
and
consequently,
the
apparent
heritability
was:
and
the
apparent
genetic
correlation
between
two
progeny
traits, j
and
k,
was:
According
to
Renand
[27]
and
Ollivier
et
al.
(22!,
the
matrix
of
variances -
covariances
in
the
non-selected
population
was:
QI
is
variance
of
the
selection
criterion
(a
phenotypic
index:
i
V!!
is
the
variance
of
progeny
trait
j;
V
jj
is
the
covariance
between
I
and
j.
In
the
selected
population,
the
corresponding
matrix
was:
The
relative
reduction
of
the
index
variance
due
to
the
selection
of
sires
was:
Consequently,
the
observed
index
variance
in
the
selected
population
(of
sires)
was
a7
=
(o
+
1)a
7
I
Then,
the
expected
variance
of
a
progeny
trait j
was:
i
The
expected
sire
component
of
a
progeny
trait
variance
(s!)
was:
Similarly,
the
expected
covariance
among
progeny
traits j
and
k
was:
as
cov(g
j
,g
k)
=
r9!,!a9!!9,!
and
the
expected
covariance
between
the
sire
index
(I)
and
a
progeny
trait
(j)
was:
Consequently,
the
expected
heritability
of
a
progeny
trait
(j)
was:
and
the
expected
correlation
between
progeny
traits j
and
k
was: