Báo cáo khoa hoc:"A further look at quantitative trait loci affecting growth and fatness in a cross between Meishan and Large White pig populations" potx
Bạn đang xem bản rút gọn của tài liệu. Xem và tải ngay bản đầy đủ của tài liệu tại đây (173.45 KB, 18 trang )
Genet. Sel. Evol. 34 (2002) 193–210
© INRA, EDP Sciences, 2002
DOI: 10.1051/gse:2002003
193
Original article
A further look at quantitative trait loci
affecting growth and fatness in a cross
between Meishan and Large White pig
populations
Raquel QUINTANILLAa∗∗ , Denis MILANb ,
Jean-Pierre BIDANELa∗
a
Station de génétique quantitative et appliquée,
Institut national de la recherche agronomique, 78352 Jouy-en-Josas Cedex, France
b
Laboratoire de génétique cellulaire, Institut national de la recherche agronomique,
31326 Castanet Tolosan Cedex, France
(Received 23 April 2001; accepted 15 October 2001)
Abstract – A detailed quantitative trait locus (QTL) analysis of growth and fatness data from a
three generation experimental cross between Large White (LW) and Meishan (MS) pig breeds
was carried out to search for sex × QTL interactions, imprinting effects and multiple linked
QTLs. A total of 530 F2 males and 573 F2 females issued from 6 F1 boars and 23 F1 sows were
typed for a total of 137 markers covering the entire porcine genome. Nine growth traits and
three backfat thickness measurements were analysed. All analyses were performed using line
cross regression procedures. A QTL with sex-specific expression was revealed in the proximal
region of chromosome 8, although some confusion between herd and sex effects could not be
discarded. This previously undetected QTL affected male growth during the fattening period,
with a favourable additive effect of the LW allele. The analyses also revealed the presence of
two linked QTLs segregating on chromosome 1, affecting growth traits during the post-weaning
period. The first QTL, previously detected using a single QTL model, was located at the end of
the q arm of chromosome 1 and had a favourable MS allele. The second QTL had a favourable
LW allele and was located in the proximal extremity of the q arm of chromosome 1. Suggestive
genomic imprinting was found in the distal region of chromosome 9 affecting growth during the
fattening period.
pig / growth / sex-QTL interaction / imprinting / linked QTLs
∗
Correspondence and reprints
E-mail:
∗∗ On leave from Departamento de Producción Agraria, Universidad Pública de Navarra,
Pamplona, Spain
194
R. Quintanilla et al.
1. INTRODUCTION
Beyond the numerous published genetic maps of the porcine genome, e.g. [4,
12,27,28], systematic searches of quantitative trait loci (QTL) in pigs have
been performed during the last years [3,10,17,18,20,23–25,29–34,36]. These
experiments have revealed a number of genome regions affecting quantitative
traits of economic importance but, with some exceptions [11,17,18,22], little
effort has been invested in searching multiple QTLs in the same linkage group
or studying non-Mendelian forms of expression. About this last point, the
phenomenon of parent-of-origin specific expression, or genomic imprinting,
has been thoroughly studied in humans and mice, and almost 40 imprinted genes
have already been described [21]. In livestock, the Callypige locus in sheep has
been shown to be imprinted [14], and evidence of genomic imprinting in pigs
has been found by several authors [11,17,22]. Evidence of sex-specific QTL
expression has been reported for some traits and chromosomal regions [18].
Yet, neither imprinting effects nor the sex × QTL interaction have been usually
studied in QTL analyses.
A considerable experiment has been conducted at INRA to map loci affecting
a number of economically important traits in a three generation experimental
cross between Large White (LW) and Meishan (MS) pig breeds. Recently,
a number of QTLs underlying the genetic differences between these breeds
concerning growth and fatness have been mapped from a whole-genome scan
[5]. The objective of this paper is to provide a more exhaustive analysis about
the form of expression of genome regions contributing to genetic variation of
growth and fatness in this LW × MS crossbred population. For this purpose,
sex × QTL interactions as well as the presence of imprinting effects have been
explored, and the presence of more than one QTL per chromosome has been
tested.
2. MATERIALS AND METHODS
2.1. Experimental population and traits analysed
The experimental population described in Bidanel et al. [5] was used for
this study. It consisted in 1 083 F2 animals, derived from a cross between MS
and LW outbred populations, distributed in 23 full sib families. To obtain the
F2 population, six F1 litters were produced by mating six unrelated LW boars
to six lowly related MS sows. One boar and three or four sows from each litter
were kept for breeding, and three to five F1 sows were mated to each F1 boar in
order to produce the F2 population. All F2 piglets were individually weighed
at birth and at three weeks of age. The piglets were weaned at 28 days of
age and placed in collective pens until the beginning of the fattening period, at
10 weeks of age. Males and females were fattened in different herds, from 70
Growth and fatness QTL expression in pigs
195
to 150 (females) or 160 (males) days of age. All animals were weighed and
measured for backfat thickness at several ages during the testing period.
The traits analysed in this study were live weights (kg) at birth (BW) and at 3,
10, 13, 17 and 22 weeks of age (W3, W10, W13, W17 and W22, respectively);
average backfat thickness (mm) at 13, 17 and 22 weeks of age (ABT13, ABT17
and ABT22, respectively); average daily gain (g · d−1 ) from birth to 3 weeks
of age (ADG1), from 3 to 10 weeks of age (ADG2) and during the fattening
period (ADG3).
More information about the sibship structure, management and data recording of the F2 experimental population, along with overall means and standard
deviations of the traits analysed, can be found in [5].
2.2. Genotyping and map construction
The almost 1 100 F2 animals, their 29 parents and 12 grandparents were
genotyped for 136 microsatellite markers and for the major histocompatibility complex (SLA). The panel of markers covered all 18 autosomes and the
X chromosome. The number of markers per Sus Scrofa chromosome (SSC)
varied between 3 (SSC 18) and 12 (SSC 7). Multipoint linkage analyses were
carried out for males, females and both sexes with version 2.4 of the CriMap
software [15]. Recombination units were then transformed to map distances
using the Haldane mapping function. The final sex-average map covered by
the marker panel spanned 2 477 cM for the 18 autosomes. More details about
the panel of markers and the genotyping methodology are given in [5].
2.3. Statistical methods
All analyses were performed using the regression approach developed by
Haley et al. [16] for the analysis of three generation pedigrees derived from
a cross between outbred lines. This approach assumes that the founder
populations are fixed for alternative QTL alleles, i.e. only two alleles are
segregating in the F2 population. These two alleles will be denoted Q for the
MS allele and q for the LW allele. Under this assumption, the probability of
an F2 individual being one of four possible QTL genotypes [p(QQ), p(Qq),
p(qQ) or p(qq)], conditional on the marker genotypes, were computed as
described by Haley et al. [16] at any putative location in the genome. These
probabilities were then used in a least squares framework to investigate the
genetic model underlying the trait of interest. Most of the analyses were
performed by means of the software developed by Seaton et al., available at
Sex average distances were
used in all analyses, since Knott et al. [18] showed that using sex-specific
maps had limited effects on the results. The different hypotheses (sex × QTL
interaction, linked QTLs, genomic imprinting and family × QTL interaction)
196
R. Quintanilla et al.
were tested by computing, at every cM of the whole genome, the reduction
in sum of squares (F-ratio test) caused by adding the new component/s to a
no-QTL and to a single QTL models, as described below.
2.3.1. Models of analysis
Single QTL model
A single QTL regression model, required to contrast the different hypotheses
analysed, was first used, i.e.:
yijk = µ + sj + gk + β covi +cai a + cdi d + eijk
{model 1}
where:
is the phenotype of the ith F2 offspring;
is the overall mean;
is a fixed sex effect;
is a fixed contemporary group effect; two different grouping strategies
were used for all analyses: (1) animals from the same fattening batch
were considered as contemporary; (2) each litter was considered as a
different contemporary group. Results regarding the hypotheses tested
did not differ substantially, so that only results from the analyses with
fattening batch as a fixed effect are presented;
covi is a covariate that varied according to the trait analysed: age at measurement for weights and ABT during the fattening period, and litter
size for pre-weaning traits. Fatness traits adjusted for live weight were
not analysed as previous analyses [5] had shown that adjusting ABT
measurements for either age or weight gives similar results;
β is the regression coefficient on the covariate;
a, d are, respectively, the additive and dominance effects of a putative QTL as
described by Falconer and Mackay [13], i.e. a is the effect of the genotype
QQ on the trait (the effect of genotype qq will be −a) and d is the effect
of genotypes Qq and qQ on the trait;
cai is the coefficient of the ith individual for the additive component at any
putative location in the genome, which is equal to p(QQ) − p(qq);
cdi is the coefficient of the ith individual for the dominance component at any
putative location in the genome, which is equal to p(Qq) + p(qQ);
eijk is the residual error.
yijk
µ
sj
gk
197
Growth and fatness QTL expression in pigs
Sex × QTL interaction
In order to test whether QTL effects (a and d) differed in males and females,
sex × QTL interactions were added to model 1 as follows:
yijk = µ + sj + gk + β covi +cai (asj ) + cdi (dsj ) + eijk
{model 2}
where yijk , µ, sj , gk , β, covi , cai , cdi and eijk have the same meaning as in
model 1, asj and dsj are, respectively, additive and dominance effects for the
sex j. Two different F-statistics where computed to test this interaction. The
first one was obtained by comparing model 2 with a model without QTL (F4df ,
an F-value with 4 degrees of freedom in the numerator). When F4df reached
significance, a second test was performed comparing model 2 with the best
single QTL model (F2df , with 2 degrees of freedom in the numerator). The
interaction was considered as significant only if both statistics reached at least
a suggestive level of significance.
Two QTL analyses
The presence of two QTLs in the same linkage group was tested by adding
additive and dominance effects for a second QTL in the model, i.e.:
yijk = µ + sj + gk + β covi +cai1 a1 + cdi1 d1 + cai2 a2 + cdi2 d2 + eijk
{model 3}
where yijk , µ, sj , gk , β, covi and eijk have the same meaning as in model 1, a1 ,
a2 , d1 , d2 are, respectively, additive and dominance effects for QTL 1 and 2,
and cai1 , cai2 , cdi1 , cdi2 are the corresponding coefficients. A two-dimensional
search was carried out by fitting model 3 to all possible combinations of two
positions on the chromosome. Two F-statistics were computed. The first
F-value was obtained by contrasting model 3 with a no QTL model (F4df ).
When F4df reached the suggestive threshold, a second F-value was calculated
by contrasting model 3 with the best single QTL model (F2df ). The presence
of two QTLs on the linkage group was concluded only when both F-statistics
reached a suggestive level of significance.
Imprinting
The presence of imprinting effects (i) was tested by considering the paternal
or maternal origin of grandparental (MS or LW) alleles, including the difference
between the two classes of heterozygotes in the model as suggested by Knott
et al. [18], i.e. :
yijk = µ + sj + gk + β covi +cai a + cdi d + cii i + eijk
{model 4}
198
R. Quintanilla et al.
where yijk , µ, sj , gk , β, covi , a, d, cai , cdi and eijk have the same meaning
as in model 1, i is the imprinting effect, and cii = p(Qq) − p(qQ) is the
corresponding coefficient. Model 3 was first contrasted with a no QTL model
(F3df , with 3 degrees of freedom in the numerator). When significant, model 3
was compared with the best single QTL model to test the significance of the
imprinting effects (F1df , with 1 degree of freedom in the numerator).
Family × QTL interaction
A model with a full-sib family fixed effect and a family × QTL interaction
was also run to test the differences in QTL effects between full-sib families,
which would suggest different alleles segregating in founder populations. This
interaction between full-sib family and QTL effects never reached significance
for any trait at any position on the whole genome.
2.3.2. Significance thresholds
Significance thresholds were determined empirically by data permutation
as described by Churchill and Doerge [8]. For each permutation, a wholegenome analysis was performed in order to locate the highest F-value. A total
of 10 000 permutations was carried out to obtain the F distribution under the
null hypothesis (no linked QTL) for three traits, ABT17, W17 and ADG3. The
5% chromosome-wide significance levels obtained (respectively, 5.9, 5.3 and
5.7) did not differ much between traits and were rather similar to threshold
values reported by other authors [18,25]. Finally, it was decided to use the
most conservative value (i.e. 5.9 for p < 0.05) as suggestive F2df threshold for
all traits.
Genome-wide significance thresholds were obtained from Bonferroni correction as described by Knott et al. [18]. Considering that 19 independent
chromosomes were analysed, the chromosome-wide significance level corresponding to a 0.05 genome-wide significance level was equal to 0.0027. A
conservative F2df genome-wide threshold of 9.0 was considered for all traits.
Models with sex-QTL interaction (model 2), with two QTLs (model 3)
and with imprinting (model 4) were tested using approximate significance
thresholds obtained as described by Knott et al. [18]: the threshold F ratio
obtained from the null hypothesis simulations was converted into a probability
of the F ratio under a standard F distribution with two degrees of freedom in the
numerator. Subsequently, the F ratio that would give this probability under an F
with one, three or four degrees of freedom in the numerator were also obtained
from the standard F distribution. The genome-wide suggestive and significant
thresholds obtained using this approximate method were, respectively, 8.0, 4.7,
4.1 and 13.5, 6.1 and 5.5 for F1df , F3df and F4df .
Growth and fatness QTL expression in pigs
199
3. RESULTS
3.1. Sex × QTL interactions
As shown in Table I, six trait × chromosome combinations located on three
chromosomes (SSC 8, 9 and 10) reached the suggestive threshold for sex ×
QTL interaction. Nevertheless, the only genome-wide significant results were
obtained for growth traits during the fattening period (W13, W17, W22 and
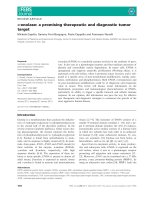
ADG3) on SSC 8. Figure 1 shows the profile of the F-ratio throughout SSC 8
with models 1 (no sex × QTL interaction) and 2 (sex × QTL interaction)
for these growth traits. F-ratios reached genome-wide significance for all
traits with model 2, whereas only suggestive or non-significant thresholds were
obtained with model 1. The improvement of fit due to the interaction term
was significant at the chromosome-wide level (Tab. I). The interaction term
had a very limited effect on the most probable position of the QTL, which
was located between SW905 and SWR1101, but QTL effects widely differed
between sexes. Additive and dominance effects were both non-significant in
females. Conversely, the QTL had a highly significant additive effect in males,
with a favourable effect of the LW allele. It explained 6.1, 5.1, 12.5 and
7.7% of the phenotypic variance of W13, W17, W22 and ADG3, respectively.
Dominance effects tended to be favourable, but were only significant for W22.
The SSC 9 and SSC 10 regions showing suggestive QTL interacting with sex
were not detected using model 1. The sex × QTL interaction on SSC 10
was also due to differences in additive effects on ABT17, with no effect in
males and a favourable effect of the LW allele in females. Conversely, the
interaction affecting W10 on SSC 9 was mainly due to a large difference in
dominance effects between males and females, with no dominance in males
and overdominance in females (Tab. I).
3.2. Two QTL analyses
Significant results from the two QTLs genome scans are shown in Table II.
Three chromosomal regions reached genome-wide significance for the test
of two vs. no QTL (F4df – Tab. II). As shown by F2df values (Tab. II), the
improvement of fit obtained by adding a second QTL was in all cases significant
considering the suggestive levels obtained by the permutation test. These
significant results all concerned growth traits, as no evidence of linked QTLs
was obtained for backfat thickness.
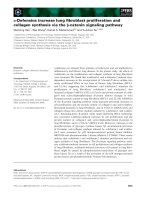
The strongest evidence of linked QTLs was obtained for SSC 1, with four
growth traits reaching suggestive significance as compared to the best single
QTL model. As shown in Figure 2, the profile of the F-ratio for W10, W13,
W17 and ADG2 when a single QTL is fitted already suggested the existence
of two equally probable locations. Moreover, these positions were almost the
200
Table I. Results from fitting a sex × QTL interaction.
F4df (b)
F2df (c)
Location
afemale (d) (s.e.)
amale (d) (s.e.)
dfemale (d) (s.e.)
dmale (d) (s.e.)
8
6.12 ∗
7.15 +
27
−0.05 (0.38)
−1.72 (0.38)
−0.85 (0.59)
0.97 (0.60)
W17 (kg)
8
6.17
∗
+
27
−0.21 (0.57)
−2.45 (0.58)
−1.77 (0.89)
1.60 (0.91)
W22 (kg)
8
9.15 ∗∗∗
W13 (kg)
−1
ADG3 (g · d )
8
7.36
∗∗
+
W10 (kg)
9
5.26
ABT17 (mm)
10
5.69 +
(a)
7.07
9.38 ++
27
−0.24 (0.82)
−4.71 (0.83)
−1.30 (1.28)
2.66 (1.31)
7.59
+
28
−1 (8)
−43 (8)
−7 (13)
24 (13)
6.27
+
87
0.27 (0.32)
−0.41 (0.32)
1.92 (0.54)
−0.40 (0.57)
6.72 +
27
0.95 (0.21)
−0.16 (0.20)
−0.03 (0.30)
−0.20 (0.31)
See text for the definition of the traits.
Model 2 vs. Model without QTL; ∗ p < 0.05, ∗∗ p < 0.01, ∗∗∗ p < 0.001 at genome-wide level; + suggestive level.
(c)
Model 2 vs. Model 1 with best QTL; + p < 0.05, ++ p < 0.01 at chromosome-wide level.
(d)
Estimates of additive (a) and dominance (d) effects in females and males; s.e. standard error.
(b)
R. Quintanilla et al.
SSC
Trait (a)
Table II. Results from fitting two QTLs.
Trait (a)
ADG2 (g · d−1 )
W10 (kg)
SSC
F4df (b)
F2df (c)
LQTL1
1
7.79 ∗∗
7.65 +
1
∗∗
8.14
∗∗∗
Estimates (e)
LQTL2 aQTL1 (s.e.)
−12 (3)
aQTL2 (s.e.)
dQTL1 (s.e.)
dQTL2 (s.e.)
12 (3)
4 (5)
−5 (4)
81
175
9.01
++
85
167 −0.97 (0.22)
0.93 (0.22)
0.16 (0.35)
−0.25 (0.35)
8.85
++
109
173 −1.04 (0.24)
1.36 (0.25)
−0.13 (0.34)
−0.62 (0.36)
W13 (kg)
1
11.10
W17 (kg)
1
7.30 ∗
7.05 +
110
175 −1.36 (0.36)
1.54 (0.36)
0.07 (0.50)
−0.66 (0.51)
WB (kg)
3
6.28
∗
+
23
29 −0.08 (0.09)
0.05 (0.08)
−0.39 (0.10)
0.36 (0.08)
ADG2 (g · d−1 )
7
10.39 ∗∗∗
6.97 +
70
−9 (3)
12 (4)
13 (5)
(a)
7.77
113
17 (3)
See text for the definition of the traits.
Model 3 vs. Model without QTL; ∗ p < 0.05, ∗∗ p < 0.01, ∗∗∗ p < 0.001 at genome-wide level.
(c)
Model 3 vs. Model {1} with best single QTL; + p < 0.05, ++ p < 0.01 at chromosome-wide level.
(d)
Most likely position of QTL1 and QTL2, respectively.
(e)
Estimates of additive (a) and dominance (d) effects of QTL1 and QTL2; s.e. standard error.
(b)
Growth and fatness QTL expression in pigs
Location (d)
201
202
S02178
SW1551
SW61
S0225
S0376
SWR1101
SW905
SW2410
R. Quintanilla et al.
F-ratio (2 d.f.)
QTL without interactionvs. no QTL
QTL without interaction vs no QTL
10
Significant
threshold
8
Suggestive
threshold
6
4
2
0
F-ratio (4 d.f.)
QTL interacting sex vs. vs QTL
QTL interacting withwith sexno no QTL
10
8
6
Significant
threshold
4
Suggestive
threshold
2
0
0
25
50
75
100
125
SSC8 location (cM)
W13
W17
W22
ADG3
Figure 1. Profile of F-ratios throughout the SSC 8 for growth traits with significant
sex-QTL interaction, by fitting two models: a single QTL model (without interaction)
and a model including the sex-QTL interaction. W13, W17 and W22, live weights
(kg) at 13, 17 and 22 weeks of age, respectively; ADG3, average daily gain (g · d−1 )
during the fattening period.
same as the most likely obtained positions for the two linked QTLs with a
two-loci model (Tab. II): one QTL at the end of the q arm and the second
one near S0396 for pre-fattening traits (W10 and ADG2), and near S0155 for
203
SW1301
SW1828
S0374
S0155
S0113
S0396
S0008
SW552
Growth and fatness QTL expression in pigs
14
12
F-ratio
10
Significant
threshold
8
Suggestive
threshold
6
4
2
0
0
25
50
75
100
125
150
175
SSC 1 location (cM)
ADG2
W10
W13
W17
W22
Figure 2. Profile of F-ratios throughout SSC 1 for post-weaning growth traits when a
single QTL is fitted (model with QTL vs. no QTL model). ADG2, average daily gain
(g · d−1 ) from 3 to 10 weeks of age; W10, W13, W17 and W22, live weights (kg) at
10, 13, 17 and 22 weeks of age, respectively.
later weights (W13 and W17). Additive effects of the two QTLs were of the
same magnitude, but with opposite signs. The QTL located at the end of
the q arm showed a positive effect of the MS allele, whereas the LW allele
had a favourable effect at the second QTL. Dominance effects were always
non-significant.
A better fit was also obtained with a two-QTLs model as compared to
a single QTL model for ADG2 on SSC 7. The first QTL had the same
most likely position as that previously detected (SLA–S0102 interval), but
a larger favourable additive effect of the MS allele. The second QTL was
located between SW352 and SW632 markers and had a favourable LW allele.
Significantly positive dominance effects were obtained for both QTLs, i.e. MS
allele dominance for the first QTL and LW allele dominance for the second one.
The average performance of heterozygotes exceeded homozygote average by
3.2–3.4%. The third significant result was for birth weight on chromosome 3.
However, the most likely positions of the two QTLs were very close (23 and
29 cM). Moreover, only dominance effects were significant, with opposite signs
at each location.
204
R. Quintanilla et al.
Table III. Results from fitting a model with imprinting.
Trait (a)
SSC Location F3df (b)
W22 (kg)
9
122
4.73 +
ADG3 (kg) 9
121
4.65 +
W17(kg)
9
122
4.71 +
F1df (c) i (d) (s.e.)
a (d) (s.e.)
d (d) (s.e.)
+
9.46 1.99 (0.65) −0.52 (0.60) 1.99 (1.01)
8.29 +
19 (6)
−5 (6)
21 (10)
6.91 ns 1.56 (0.45) −0.25 (0.41) 0.84 (0.70)
(a)
See text for the definition of the traits.
Model 4 vs. Model without QTL; + suggestive level.
(c)
Model 4 vs. Model 1 with best single QTL; + p < 0.05 at chromosome-wide
level.
(c)
i, a, d, estimates of imprinting, additive and dominance effects, respectively;
s.e., standard error.
(b)
3.3. Imprinting
The results from the whole-genome scan with imprinting effects are shown
in Table III. No genome-wide significant imprinted QTL was evidenced, but
suggestive results were obtained for W22 and ADG3 on the distal region of
SSC 9, between S0384 and SW174 markers. Estimated imprinting effects
indicated that heterozygous individuals that had received the MS allele (Q)
from the male parent had a higher weight (+1.98 ± 0.65 kg) and a larger
growth rate (+19 ± 7 g · d−1 ) than heterozygous individuals who had received
it from the female parent. Both additive and dominance effects were nonsignificant, which is consistent with the fact that no QTL had previously been
detected on SSC 9 [5]. A similar tendency was observed for W17, but the
test of the model with imprinting vs. the best model without imprinting (F1df
– Tab. III) did not reach significance. No other evidence of imprinting effects
across the Sus Scrofa genome was found in these analyses.
4. DISCUSSION
4.1. Methodology
As pointed out by Knott et al. [18] and de Koning et al. [11], the line-cross
regression procedure described by Haley et al. [16] can be easily extended to
search for non-Mendelian forms of expression and for the presence of multiple
linked QTLs. This line-cross model is based on the assumption that different
QTL alleles are fixed in founder populations. It is a very powerful model when
this corresponds to the true state of nature, and it is rather robust to limited
departures from this ideal situation [1]. The absence of significant family
× QTL interaction in the F2 population analysed tends to indicate that there
are no significant differences in the estimated effects for LW and MS alleles
passed through different F1 individuals. This result is consistent with those
Growth and fatness QTL expression in pigs
205
of Bidanel et al. [5], who obtained similar results using this line-cross and a
half-full sib model, which did not make any assumption about the number and
the frequency of QTL alleles in founder populations. It suggests that QTL
alleles are likely to be fixed in parental populations, and supports the adequacy
of this regression approach for the analysis of such line-cross data. However,
it should be kept in mind that the experiment might somewhat lack power to
test such an interaction, so the presence of several alleles segregating in the
parental populations cannot be totally discarded.
4.2. Sex × QTL interactions
The results obtained in these analyses showed the existence of a QTL in the
proximal region of SSC 8 associated with live weight and growth rate during
the fattening period, but with a sex-specific expression. It exclusively affected
growth traits in males, with a purely additive favourable effect of the LW allele.
However, it should be kept in mind that males and females were fattened in
different fattening units. As a consequence, the observed interaction cannot
be unambiguously considered as a sex × QTL interaction, since it may also
reflect the existence of a herd × QTL interaction. Sex × QTL interactions have
seldom been tested in the analysis of QTL experiments. Yet, Knott et al. [18]
also reported a significant sex × QTL interaction on SSC 8 for the length of the
small intestine in a Large White × Wild Boar cross, with a much larger effect
in males than in females. It has to be noted that the model with no interaction
only gave suggestive evidence of a QTL [18]. Similarly, no significant (W13
and W17) or suggestive (W22) QTLs were obtained by Bidanel et al. [5] in
a first analysis of current data using a model without interaction. It may thus
be reasonably hypothesised that some undetected or suggestive QTLs would
have been significant if sex × QTL interaction had been fitted in the model.
This is for instance the case for suggestive growth QTLs found on SSC 8 by
Casas-Carrillo et al. [7] and Paszek et al. [24] using a no interaction model.
4.3. Two QTL analyses
Two-QTLs analyses suggested the existence of linked growth QTLs on
SSC 1. The QTL located at the end of the q arm of SSC 1 (QTL2) had already
been detected using a single QTL model by Bidanel et al. [5]. The most likely
position and estimates of dominance effects were similar in both cases, whereas
estimates of additive effects were somewhat lower with the single QTL model.
This difference may be due to the additive effects at the second QTL (QTL1),
which are in the opposite direction and tend to bias downward the estimates
from single QTL models. As emphasised by Knott et al. [18], this may in some
instances be due to the fact that separating two closely linked QTLs that are
highly confounded is difficult and may give unreliable estimates. This latter
206
R. Quintanilla et al.
explanation is rather unlikely for SSC 1, since QTL1 is located at more than
60 cM from QTL2, whose results are very consistent with single QTL analyses.
Moreover, a suggestive QTL with the same characteristics as QTL1 (similar
position, purely additive favourable LW allele) was also detected in single QTL
analyses by Bidanel et al. [5].
Similarly, the two-QTLs model gave rather consistent results for ADG2 on
SSC 7. The QTL located in the SLA–S0102 interval had already been revealed
at the same position using a single QTL model [5], with a lower estimate of
additive effects (10 ± 2 g · d−1 vs. 16 ± 3 g · d−1 ) and a slightly larger estimate of
dominance effects (16 ± 4 g · d−1 vs. 12 ± 4 g · d−1 ) than in the current analysis.
Conversely, the two-QTLs result on SSC 3 is more questionable given the very
close location of the two QTLs.
Reports of linked QTLs are very scarce in pigs. To our knowledge, the only
available results are those of Knott et al. [18], who reported suggestive evidence
of linked QTLs affecting growth rate, abdominal fat and small intestine length
in Wild Boar × Large White crosses. Linked growth QTLs were located on a
different chromosome, i.e. SSC 5, than those detected in the current study.
4.4. Imprinting
A single chromosomal region on SSC 9 showed suggestive evidence for
parent-of-origin specific expression for ADG3 and W22 when running a genome scan using a model with a so-called “imprinting”effect. No imprinted QTL
had been previously reported in this chromosomal region in pigs. Yet, several
imprinted genes related with early growth and development [6,26,35,37] have
been reported in the orthologous region of the human genome (7q11-q22; see
comparative mapping at This
unique evidence of imprinting contrasts with the numerous reports of imprinting
effects in pigs recently published. Knott et al. [18] reported an improvement of
fit for abdominal fat on SSC 4 when including an imprinting effect in the model.
Jeon et al. [17] and Nezer et al. [22] showed evidence of an imprinted QTL
linked to IGF2 locus (at the distal tip of SSC 2p) in, respectively, Large White
× Wild Boar and Large White × Pietrain crosses. More recently, de Koning
et al. [11] detected four imprinted QTLs in Meishan × White crosses. These
QTLs were located on SSC 2 (affecting backfat thickness) on SSC 6 (2 QTLs
affecting intramuscular fat content) and on SSC 7 (affecting muscle depth). The
lack of parent-of-origin specific expression in the present study as compared to
the study of de Koning et al. [11] may look surprising, since Meishan animals
used in both experiments were derived from the same base population. Yet,
it may result from allele differences in the “White” population used: only
French Large White were used in the French experiment, whereas both Large
White and Landrace genes were involved in the Dutch White population. Other
hypotheses, such as a sex difference in marker informativity or the existence
Growth and fatness QTL expression in pigs
207
of two or several alleles segregating in parental populations, combined with
extreme QTL allele frequency differences between males and females, might
also lead to false positive results for imprinting in [11]. However, the lack
of significant family × QTL interaction in the current study tends to indicate
that the QTLs are fixed for different alleles in parental populations and that this
latter hypothesis is rather unlikely. Finally, the diverging conclusions regarding
imprinting may also result from differences in experimental power and particularly statistical methods used. In the study of de Koning et al. [11] paternal and
maternal imprinting effects were tested separately against a no-QTL model, and
imprinting was considered as present when a single test reached significance.
With such as procedure imprinting is not tested as a deviation from a Mendelian
inheritance model [19], which may lead to false imprinting results.
5. CONCLUSIONS
The objective of this study was to analyse in more detail the genetic architecture of growth and fatness traits in pigs. The presence of sex × QTL
interactions, of linked QTLs, along with suggestive evidence of genomic
imprinting, have been revealed. These results tend to indicate that using a
single QTL model may not be adequate in all situations, and that departures
from the single QTL model usually assumed may be worth being investigated.
Yet, further studies are necessary to confirm the existence of non-Mendelian
forms of expression and linked QTL affecting multifactorial traits in livestock.
Sex × QTL interactions can be easily analysed with adequate experimental
designs. Regarding genomic imprinting, several experimental crosses, such as
F2 between outbred lines herein or backcrosses from F1 individuals with both
paternal and maternal founders, allow detecting potentially imprinted genome
regions. Another possibility would be to perform functional studies and look at
mRNA expression. The presence of linked QTLs can be confirmed by means
of new experiments that allow breaking the linkage between QTLs, for instance
by developing advanced intercross lines or interval-specific congenic strains as
described by Darvasi [9]. Other strategies, such as the development of metaanalyses of several experiments [33], would also allow gaining some power to
study the location and mode of expression of genome regions contributing to
genetic variation of multifactorial traits.
ACKNOWLEDGEMENTS
This experimental program was funded by the European Union (Bridge and
Biotech+ programs), INRA (Department of Animal Genetics and AIP “structure
des génomes animaux”) and the “groupement de recherches et d’études sur les
génomes”. R.Q. acknowledges the Universidad Pública de Navarra for funding
her post-doctoral stage at INRA.
208
R. Quintanilla et al.
REFERENCES
[1] Alfonso L., Haley C.S., Power of different F2 schemes for QTL detection in
livestock, Anim. Sci. 66 (1998) 1–8.
[2] Andersson-Eklund L., Marklund L., Lundstrom K., Haley C.S., Andersson K.,
Hansson I., Moller M., Andersson L. Mapping quantitative trait loci for carcass
and meat quality traits in a wild boar × Large White intercross, Anim. Sci. 76
(1998) 694–700.
[3] Andersson L., Haley C.S., Ellegren H., Knott S.A., Johansson M., Andersson K.,
Andersson-Eklund L., Edfors-Lilja I., Fredholm M., Hansson I., Hakansson J.,
Lundström K., Genetic mapping of quantitative trait loci for growth and fatness
in pigs, Science 263 (1994) 1771–1774.
[4] Archibald A.L., Brown J.F., Couperwhite S., Mc Queen H.A., Nicholson D.,
Haley C.S., Coppieters W., Van de Weghe A., Stratil A., Winterˇ A.K., Fredholm
s
M., Larsen N.J., Nielsen V.H., Milan D., Woloszyn N., Robic A., Dalens M.,
Riquet J., Gellin J., Caritez J.C., Hue D., Burgaud G., Ollivier L., Bidanel J.P.,
Vaiman M., Renard C., Geldermann H., Davoli R., Ruyter D., Versteger E.J.M.,
Groenen M.A.M., Davies W., Hˇyheim B., Keiserud A., Andersson L., Ellegren
s
H., Johansson M., Marklund L., Miller J.R., Anderson Dear D.V., Signer E.,
Jeffreys A.J., Moran C., Le Tissier P., Rothschild M.F., Tuggle C.K., Vaske D.,
Helm J., Liu H.C., Rahman A., Yu T.P., Larson R.G., Schmitz C.B., The PiGMaP
consortium linkage map of the pig (Sus scrofa), Mamm. Genome 6 (1995) 157–
175.
[5] Bidanel J.P., Milan D., Iannuccelli N., Amigues Y., Boscher M.Y., Bourgeois
F., Caritez J.C., Gruand J., Le Roy P., Lagant H., Quintanilla R., Renard C.,
Gellin J., Ollivier L., Chevalet C., Detection of quantitative trait loci for growth
and fatness in pigs, Genet. Sel. Evol. 33 (2001) 289–309.
[6] Blagitko N., Mergenthaler S., Schulz U., Wollmann H.A., Craigen W., Eggermann T., Ropers H.H., Kalscheuer V.M., Human GRB10 is imprinted and
expressed from the paternal and maternal allele in a highly tissue- and isoformspecific fashion, Hum. Mol. Genet. 9 (2000) 1587–1595.
[7] Casas-Carrillo E., Prill-Adams A., Price S.G., Clutter A.C., Kirkpatrick B.W.,
Mapping genomic regions associated with growth rate in pigs, J. Anim. Sci. 75
(1997) 2047–2053.
[8] Churchill G.A., Doerge R.W., Empirical threshold values for quantitative trait
mapping, Genetics 138 (1994) 963–971.
[9] Darvasi A., Experimental strategies for the genetic dissection of complex traits
in animal models, Nature Genet. 18 (1998) 19–24.
[10] de Koning D.J., Janss L.L.G., Rattink A.P., van Oers P.A.M., de Vries B.J.,
Groenen M.A.M., van der Poel J.J., de Groot P.N., Brascamp E.W., van Arendonk
J.A.M., Detection of quantitative trait loci for backfat thickness and intramuscular
fat content in pigs (Sus scrofa), Genetics 152 (1999) 1679–1690.
[11] de Koning D.J., Rattink A.P., Harlizius B., van Arendonk J.A.M., Brascamp
E.W., Groenen M.A.M., Genome-wide scan for body composition in pigs reveals
important role of imprinting, Proc. Natl. Acad. Sci. USA 97 (2000) 7947–7950.
Growth and fatness QTL expression in pigs
209
[12] Ellegren H., Chowdhary B., Johansson M., Andersson L., A primary linkage
map of the porcine genome reveals a low rate of recombination, Genetics 137
(1994) 1089–1100.
[13] Falconer D.S., Mackay T.F.C., Introduction to Quantitative Genetics, Longman,
United Kingdom, 1996.
[14] Georges M., Cockett N., The ovine callipyge locus: a paradigm illustrating the
importance of non-Mendelian genetics in livestock, Reprod. Nutr. Dev. 36 (1996)
651–657.
[15] Green P., Falls K., Crooks S., Documentation for CRIMAP version 2.4, Washington University School of Medicine, St. Louis (1990).
[16] Haley C.S., Knott S.A., Elsen J.M., Mapping quantitative trait loci in crosses
between outbred lines using least squares, Genetics 136 (1994) 1195–1207.
[17] Jeon J.T., Carlborg O., Törnsten A., Giuffra E., Amarger V., Chardon P.,
Andersson-Eklund L., Andersson K., Hansson I., Lundström K., Andersson L.,
A paternally expressed QTL affecting skeletal and cardiac muscle mass in pigs
maps to the IGF2 locus, Nature Genet. 21 (1999) 157–158.
[18] Knott S.A., Marklund L., Haley C.S., Andersson K., Davies W., Ellegren H.,
Fredholm M., Hansson I., Hoyhem B., Lundström K., Moller M., Andersson L.,
Multiple marker mapping of quantitative trait loci in a cross between outbred
Wild Boar and Large White pigs, Genet. 149 (1998) 1069–1080.
[19] Lee K., Dekkers J.C.M., Fernando R.L., Rothschild M.F., Evaluation of statistical
models and permutation test for detecting gametic imprinting in QTL scans,
in: Abstracts of the ASAS/ADSA Joint Annual Meeting, 24–28 July 2001,
Indianapolis, USA, pp. 190.
[20] Marklund L., Nyström P.E., Stern S., Andersson-Eklund L., Andersson L.,
Confirmed quantitative trait loci for fatness and growth on pig chromosome 4,
Heredity 82 (1999) 134–141.
[21] Morison I.M., Paton C.J., Cleverley S.D., The imprinted gene and parent-oforigin effect database, Nucleic Acids Res. 29 (2001) 275–276.
[22] Nezer C., Moreau L., Brouwers B., Coppieters W., Detilleux J., Hanset R.,
Karim L., Kvasz A., Leroy P., Georges M., An imprinted QTL with major effect
on muscle mass and fat deposition maps to the IGF2 locus in pigs, Nature Genet.
21 (1999) 155–156.
[23] Ovilo C., Pérez-Enciso M., Barragan C., Clop A., Rodriguez C., Oliver M.A.,
Toro M.A., Noguera J.L., A QTL for intramuscular fat and backfat thickness is
located on porcine chromosome 6, Mamm. Genome 11 (2000) 344–346.
[24] Paszek A.A., Wilkie P.J., Flickinger G.H., Rohrer G.A., Alexander L.J., Beattie
C.W., Shook L.B., Interval mapping of growth in divergent swine cross, Mamm.
Genome 10 (1999) 117–122.
[25] Pérez-Enciso M., Clop A., Noguera J.L., Ovilo C., Coll C., Folch J.M., Babot
D., Estany J., Oliver M.A., Diaz I., Sanchez A., A QTL on pig chromosome 4
affects fatty acid metabolism: evidence from an Iberian by Landrace intercross,
J. Anim. Sci. 78 (2000) 2525–2531.
[26] Perez Jurado L.A., Peoples R., Kaplan P., Hamel B.C., Francke U., Molecular
definition of the chromosome 7 deletion in Williams syndrome and parent-oforigin effects on growth, Am. J. Hum. Genet. 59 (1996) 781–792.
210
R. Quintanilla et al.
[27] Rohrer G.A., Alexander L.J., Keele J.W., Smith T.P.L., Beattie C.W., A
microsatellite linkage map of the porcine genome, Genetics 136 (1994) 231–245.
[28] Rohrer G.A., Alexander L.J., Hu Z., Smith T.P.L., Keele J.W., Beattie C.W., A
comprehensive map of the porcine genome, Genome Res. 6 (1996) 371–391.
[29] Rohrer G.A., Keele J.W., Identification of quantitative trait loci affecting carcass
composition in swine: I. fat deposition traits, J. Anim. Sci. 76 (1998) 2247–2254.
[30] Rohrer G.A., Keele J.W., Identification of quantitative trait loci affecting carcass
composition in swine: II. Muscling and wholesale product yield traits, J. Anim.
Sci. 76 (1998) 2255–2262.
[31] Rothschild M.F., Liu H.C., Tuggle C.K., Yu T.P., Wang L., Analysis of pig
chromosome 7 genetic markers for growth and carcass performance traits, J.
Anim. Breed. Genet. 112 (1995) 341–348.
[32] Walling G.A., Archibald A.L., Visscher P.M., Haley C.S., Mapping of quantitative trait loci on chromosome 4 in a Meishan × Large White Meishan pig F2
population, in: Proceedings of the 6th World Congress on Genetics Applied to
Livestock Production, 11–16 January 1998, Vol. 23, University of New England,
Armidale NSW 2351, pp. 519–522.
[33] Walling G.A., Visscher P.M., Andersson L., Rothschild M.F., Wang L., Moser
G., Groenen M.A.M., Bidanel J.P., Cepica S., Archibald A., Geldermann H.,
de Koning D.J., Milan D., Haley C.S., Combined analyses of data from QTL
mapping studies: chromosome 4 effects on porcine growth and fatness, Genetics
155 (2000) 1369–1378.
[34] Wang L., Yu T.P., Tuggle C.K., Liu H.G., Rothschild M.F., A directed search for
quantitative trait loci on chromosomes 4 and 7 in the pig, J. Anim. Sci. 76 (1998)
2560–2567.
[35] Yoshihashi H., Maeyama K., Kosaki R., Ogata T., Tsukahara M., Goto Y., Hata
J., Matsuo N., Smith R.J., Kosaki K., Imprinting of human GRB10 and its
mutations in two patients with Russell-Silver syndrome, Am. J. Hum. Genet. 67
(2000) 476–482.
[36] Yu T.P., Wang L., Tuggle C.K., Rothschild M.F., Mapping genes for fatness and
growth on pig chromosome 13: A search in the region close to the pig PIT1 gene,
J. Anim. Breed. Genet. 116 (1999) 281–288.
[37] Zimprich A., Grabowski M., Asmus F., Naumann M., Berg D., Bertram M.,
Scheidtmann K., Kern P., Winkelmann J., Muller-Myhsok B., Riedel L., Bauer
M., Muller T., Castro M., Meitinger T., Strom T.M., Gasser T., Mutations in the
gene encoding epsilon-sarcoglycan cause myoclonus-dystonia syndrome, Nat.
Genet. 29 (2001) 66–69.
To access this journal online:
www.edpsciences.org