Business planning and financial modeling for microfinance insti phần 10 potx
Bạn đang xem bản rút gọn của tài liệu. Xem và tải ngay bản đầy đủ của tài liệu tại đây (1.11 MB, 25 trang )
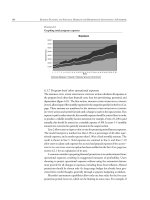
204 FINANCING FLOWS PAGE
Initial 123456789101112
# Balance Jan-98 Feb-98
Mar-98
Apr-98 May-98 Jun-98 Jul-98 Aug-98 Sep-98 Oct-98 Nov-98 Dec-98
1 Ending rest. resources, operations 0 0 0 25,000 9,332 00000000
2 Ending rest. resources, portfolio 50,000 36,862 29,064 26,726 26,689 32,638 125,024 67,591 210,248 163,866 98,269 41,349 0
3 Ending rest. resources, other assets 0 0 0 25,000 25,000 25,000 25,000 25,000 19,911 19,911 17,346 17,346 17,346
4 Ending unrestricted resources avail. 12,400 110,611 111,343
112,165
129,115 139,672 140,761 145,221 144,942 145,840 148,047 151,356 149,361
5 Excess/shortfall incl. liquidity requirement 0 121,418 114,130
162,389
162,588 169,501 262,842 190,594 325,551 277,859 204,034 149,729 105,822
Financing Flows
Explanation:
Enter projected new funding information, monitoring for positive balances in the blue band above
1
Automated default sources
Use default sources to maintain positive cash balance
NOTE: Default sources require additional recalculation time. You should disable this option when developing scenarios.
Control variables for default funding
2 Percentage from unrestricted grants
3 Percentage from unrestricted loans 100% Note: The percentages from Lines 2 and 3 will add up to 100% after workbook is recalculated.
4 Annual interest rate for unidentified loan Note: If default loan is indexed to an external value, input the sum of the nominal interest rate plus the indexing rate.
Financing by Source
Enter new receipts in the gray areas below. For loans, enter receipts as positive numbers and repayments as negative numbers.
1 Earned income 15,346 16,369 16,474 16,950 16,908 16,635 20,022 20,931 23,247 25,246 26,368 27,197
2 Change in available savings 000000000000
NOTE: Default sources are not enabled
3 Automated Default Sources - -
-
- - - - - - - - -
4 Unrestricted grants - -
-
- - - - - - - - -
5 Unrestricted loans - -
-
- - - - - - - - -
6 Unrestricted grants
Greenland Dev. Agency
3
[Unres2 not used]
-
[Unres3 not used]
-
7 Unrestricted loans
[UnresLn1 not used]
-
[UnresLn2 not used]
-
[UnresLn3 not used]
1
100,000
8 Equity Investments (Unrestricted) .
[Equity1 not used]
-
[Equity2 not used]
-
[Equity3 not used]
-
[Equity4 not used]
-
Payment of Dividends
-
9 Restricted grants for OPERATIONS
Head Start Foundation
2
25,000
[Op2 not used]
-
[Op3 not used]
-
10 Restricted loans for PORTFOLIO
IDC
7
FNB
1
192,000
FUNDALL
3
[PortLn4 not used]
-
[PortLn5 not used]
-
[PortLn6 not used]
-
11 Restricted grants for PORTFOLIO
Global Reach Foundation
1
80,000
Freedom Fund
2
[PortGr3 not used]
-
12 Restricted grants for OTHER ASSETS
Head Start Foundation
2
25,000
[OA2 not used]
-
[OA3 not used]
-
13 Restricted loans for OTHER ASSETS
[AssLn1 not used]
-
[AssLn2 not used]
-
14 Equity Multiplier 2.06 2.44 2.45 2.23 2.23 2.23 1.98 1.98 2.48 2.49 2.51 2.52 2.52
Investment Strategy
NOTE: This section allows the modeling of the investment of excess cash in instruments earning different rates of interest.
1 Cash and Investments Balances 62,400 147,473 140,407
188,890
190,136 197,309 290,785 237,812 375,102 329,617 263,663 210,051 166,707
2 Operational 0 0 0 25,000 9,332 00000000
3 Portfolio 50,000 36,862 29,064 26,726 26,689 32,638 125,024 67,591 210,248 163,866 98,269 41,349 0
4 Other Asset Financing 0 0 0 25,000 25,000 25,000 25,000 25,000 19,911 19,911 17,346 17,346 17,346
5 Unrestricted 12,400 110,611 111,343
112,165
129,115 139,672 140,761 145,221 144,942 145,840 148,047 151,356 149,361
6 Minimum liquidity level 26,055 26,277 26,502 27,547 27,808 27,943 47,219 49,550 51,758 59,629 60,322 60,885
7 Balance in excess of minimum liquidity 121,418 114,130
162,389
162,588 169,501 262,842 190,594 325,551 277,859 204,034 149,729 105,822
Short-term Investments NOTE: Any balance in excess of minimum liquidity is assumed to be invested short-term.
8 Proposed Balance 121,418 114,130
162,389
162,588 169,501 262,842 190,594 325,551 277,859 204,034 149,729 105,822
9 Manual override
-
10 Balance used 11,000 121,418 114,130
162,389
162,588 169,501 262,842 190,594 325,551 277,859 204,034 149,729 105,822
Data okay
Long-term Investments NOTE: Any long-term investments must be manually input. Watch for negative cash balances!!!
11 Balance, user input
-
12 Balance used 0000000000000
13 Amount of cash deposits 51,400 26,055 26,277 26,502 27,547 27,808 27,943 47,219 49,550 51,758 59,629 60,322 60,885
FINANCING FLOWS PAGE 205
Initial 1 2 3 456789101112
# Balance Jan-98 Feb-98
Mar-98
Apr-98 May-98 Jun-98 Jul-98 Aug-98 Sep-98 Oct-98 Nov-98 Dec-98
Income on
This section allows input of interest rates and calculates income on investments.
1
Cash Deposits
51,400 26,055 26,277
26,502
27,547 27,808 27,943 47,219 49,550 51,758 59,629 60,322 60,885
Interest rate earned - input
-
0.0%
Interest rate earned 0.0% 0.0% 0.0% 0.0% 0.0% 0.0% 0.0% 0.0% 0.0% 0.0% 0.0% 0.0% 0.0%
Income from liquidity deposits 000000000000
2
Short-term Investments
11,000 121,418 114,130
162,389
162,588 169,501 262,842 190,594 325,551 277,859 204,034 149,729 105,822
Interest rate earned - input
-
8.0%
Interest rate earned 8.0% 8.0% 8.0% 8.0% 8.0% 8.0% 8.0% 8.0% 8.0% 8.0% 8.0% 8.0% 8.0%
Income from short-term investments 73 809 761 1,083 1,084 1,130 1,752 1,271 2,170 1,852 1,360 998
NOTE: Savings reserves are derived from the total savings and the "% to hold in reserve" parameter on the product definition page
3
Savings reserves
0000000000000
Interest rate earned - input
-
8.0%
Interest rate earned 8.0% 8.0% 8.0% 8.0% 8.0% 8.0% 8.0% 8.0% 8.0% 8.0% 8.0% 8.0% 8.0%
Income from investments of reserves 000000000000
4
Long-term Investments
0000000000000
Interest rate earned - input
-
12.0%
Interest rate earned 12.0% 12.0% 12.0% 12.0% 12.0% 12.0% 12.0% 12.0% 12.0% 12.0% 12.0% 12.0% 12.0%
Income from long-term investments 000000000000
5
Total income on investments 73 809 761 1,083 1,084 1,130 1,752 1,271 2,170 1,852 1,360 998
Operational Financing
This section shows the financing of cash operational expenses.
1
Beginning restricted resources
- - - 25,000 9,332 - - - - - - -
2
Less Operational Expenses
Note that loan loss provisions are excluded as they are not a cash expense
Financial Costs 2,375 2,375 2,375 2,375 2,375 2,375 2,375 3,495 4,615 4,615 4,615 4,615
Program Operating Costs 9,556 9,562 9,568 9,574 9,581 9,434 9,440 14,029 14,039 14,758 14,769 14,780
Administrative Operating Costs 4,058 4,067 4,076 4,086 4,095 4,105 4,114 4,124 4,134 4,144 4,153 4,163
Amount of taxes paid - - - - - - - - - - - -
3
Plus non-cash operating expenses
Depreciation and Amortization 367 367 367 367 367 367 367 438 438 479 479 479
+/- change in accrued expenses - - - - - - - - - - - -
NOTE: The following two lines are for manual adjustments of these two lines from the Balance Sheet
4 Less net incr. in other current assets
5 Plus net incr. in other current liabilities
6
Balance before use of unrestricted (15,622) (15,637)
(15,653)
9,332 (6,352) (15,546) (15,562) (21,210) (22,350) (23,038) (23,059) (23,080)
7 Month's income used for operations 15,346 15,637
15,653
- 6,352 15,546 15,562 20,931 22,350 23,038 23,059 23,080
8 Unrestricted funds used for operations 277 - - - - - - 279 - - - -
9
Balance after use of unrestricted
- - - 9,332 - - - - - - - -
10
New restricted grants for operations
- -
25,000
- - - - - - - - -
Head Start Foundation: Received
- -
25,000
- - - - - - - - -
Head Start Foundation: Bal. (ref) - - -
25,000
25,000 25,000 25,000 25,000 25,000 25,000 25,000 25,000 25,000
[Op2 not used]: Received
- - - - - - - - - - - -
[Op2 not used]: Bal. (ref) - - - - - - - - - - - - -
[Op3 not used]: Received
- - - - - - - - - - - -
[Op3 not used]: Bal. (ref) - - - - - - - - - - - - -
11
Ending rest. resources, operations 0 0 0
25,000
9,332 00000000
Portfolio Financing
This section shows the financing of the loan portfolio.
1
Beginning restricted resources
50,000 36,862
29,064
26,726 26,689 32,638 125,024 67,591 210,248 163,866 98,269 41,349
2
Change in portfolio
Plus loan repayments 70,462 76,671
83,007
89,471 96,480 103,640 110,901 120,862 131,147 142,510 153,928 165,615
Minus loan disbursements (83,600) (84,468)
(85,345)
(89,508) (90,531) (91,253) (168,334) (170,205) (177,529) (208,107) (210,849) (213,076)
3
Bal. before changes in rest. funding 36,862 29,064
26,726
26,689 32,638 45,024 67,591 18,248 163,866 98,269 41,349 (6,112)
Debt Financing of Portfolio
4
Change in available savings
000000000000
Available Compulsory savings
- - - - - - - - - - - - -
Available Voluntary savings
- - - - - - - - - - - - -
Product 1: Passbook Savings - - - - - - - - - - - - -
Product 2: Term Deposits - - - - - - - - - - - - -
Product 3: [savprod 3 not in use] - - - - - - - - - - - - -
Product 4: [savprod 4 not in use] - - - - - - - - - - - - -
5
Change in Portfolio Loans
0000000192,000 0000
IDC: Rec./Repay
- - - - - - - - - - - -
IDC: Bal. (ref) 110,000 110,000 110,000
110,000
110,000 110,000 110,000 110,000 110,000 110,000 110,000 110,000 110,000
FNB: Rec./Repay
- - - - - - - 192,000 - - - -
FNB: Bal. (ref) 180,000 180,000 180,000
180,000
180,000 180,000 180,000 180,000 372,000 372,000 372,000 372,000 372,000
FUNDALL: Rec./Repay
- - - - - - - - - - - -
FUNDALL: Bal. (ref) - - - - - - - - - - - - -
[PortLn4 not used]: Rec./Repay
- - - - - - - - - - - -
[PortLn4 not used]: Bal. (ref) - - - - - - - - - - - - -
[PortLn5 not used]: Rec./Repay
- - - - - - - - - - - -
[PortLn5 not used]: Bal. (ref) - - - - - - - - - - - - -
[PortLn6 not used]: Rec./Repay
- - - - - - - - - - - -
[PortLn6 not used]: Bal. (ref) - - - - - - - - - - - - -
6
TOTAL CHANGE IN DEBT FINANCING 0000000192,000 0000
Equity Financing of Portfolio
7
New restricted grants for portfolio
0000080,000 000000
Global Reach Foundation: Received
- - - - - 80,000 - - - - - -
Global Reach Foundation: Bal. (ref) 120,000 120,000 120,000
120,000
120,000 120,000 200,000 200,000 200,000 200,000 200,000 200,000 200,000
Freedom Fund: Received
- - - - - - - - - - - -
Freedom Fund: Bal. (ref) - - - - - - - - - - - - -
[PortGr3 not used]: Received
- - - - - - - - - - - -
[PortGr3 not used]: Bal. (ref) - - - - - - - - - - - - -
8
TOTAL CHANGE IN EQUITY FINANCING 0000080,000 000000
9
Balance before use of unrestricted
50,000 36,862 29,064
26,726
26,689 32,638 125,024 67,591 210,248 163,866 98,269 41,349 (6,112)
10 Unrestricted funds used for portfolio - - - - - - - - - - - 6,112
11
Ending rest. resources, portfolio 50,000 36,862 29,064
26,726
26,689 32,638 125,024 67,591 210,248 163,866 98,269 41,349 0
206 FINANCING FLOWS PAGE
Initial 1 2 3
4
56789101112
# Balance Jan-98 Feb-98
Mar-98
Apr-98 May-98 Jun-98 Jul-98 Aug-98 Sep-98 Oct-98 Nov-98 Dec-98
Financing of Other
Assets
This section shows the financing of other assets.
1
Beginning restricted resources
0 0 0 25,000 25,000 25,000 25,000 25,000 19,911 19,911 17,346 17,346
2
Change in other assets
1,512 0000005,089 0 2,565 0 0
Program furniture and equipment - - - - - - - 5,089 - 2,565 - -
Administrative furniture and equipment 1,512 - - - - - - - - - - -
Building purchases - - - - - - - - - - - -
Land purchases - - - - - - - - - - - -
Other major assets purchases - - - - - - - - - - - -
3
Bal. before changes in rest. funding
(1,512) 0 0 25,000 25,000 25,000 25,000 19,911 19,911 17,346 17,346 17,346
New Financing for Other Assets
4
Change in Loans for other assets
- - - - - - - - - - - -
[AssLn1 not used]: Rec./Repay
- - - - - - - - - - - -
[AssLn1 not used]: Bal. (ref) - - - - - - - - - - - - -
[AssLn2 not used]: Rec./Repay
- - - - - - - - - - - -
[AssLn2 not used]: Bal. (ref) - - - - - - - - - - - - -
5
New restricted grants for other assets
- - 25,000 - - - - - - - - -
Head Start Foundation: Received
- - 25,000 - - - - - - - - -
Head Start Foundation: Bal. (ref) - - - 25,000 25,000 25,000 25,000 25,000 25,000 25,000 25,000 25,000 25,000
[OA2 not used]: Received
- - - - - - - - - - - -
[OA2 not used]: Bal. (ref) - - - - - - - - - - - - -
[OA3 not used]: Received
- - - - - - - - - - - -
[OA3 not used]: Bal. (ref) - - - - - - - - - - - - -
NOTE: The following line is for manual changes to the following line appearing on the Balance Sheet
6 Change in other long-term liabilities
-
7 Balance of other long-term liabilities - - - - - - - - - - - - -
8
Balance before use of unrestricted
0 (1,512) - 25,000 25,000 25,000 25,000 25,000 19,911 19,911 17,346 17,346 17,346
9 Unrest. funds used for other assets 1,512 - - - - - - - - - - -
10
Ending rest. resources, other assets 0 0 0 25,000 25,000 25,000 25,000 25,000 19,911 19,911 17,346 17,346 17,346
Summary of financing
before unrestricted
This section presents the balances of each restricted pool of funds before unrestricted is applied.
The unrestricted financing section to follow will attempt to cover any indicated shortfalls.
1 Operational Financing 0 (15,622) (15,637) (15,653)
9,332
(6,352) (15,546) (15,562) (21,210) (22,350) (23,038) (23,059) (23,080)
2 Portfolio Financing 50,000 36,862 29,064 26,726 26,689 32,638 125,024 67,591 210,248 163,866 98,269 41,349 (6,112)
3 Other Asset Financing 0 (1,512) 0 25,000 25,000 25,000 25,000 25,000 19,911 19,911 17,346 17,346 17,346
Unrestricted Financing
This section summarizes the sources and uses of unrestricted finances.
1
Beginning balance of unrestricted funds
12,400 110,611
111,343
112,165 129,115 139,672 140,761 145,221 144,942 145,840 148,047 151,356
2
Earned income
15,346 16,369 16,474 16,950 16,908 16,635 20,022 20,931 23,247 25,246 26,368 27,197
3
New Unrestricted Loans
100,000 - - - - - - - - - - -
[UnresLn1 not used]: Received
- - - - - - - - - - - -
[UnresLn1 not used]: Bal. (ref) - - - - - - - - - - - - -
[UnresLn2 not used]: Received
- - - - - - - - - - - -
[UnresLn2 not used]: Bal. (ref) - - - - - - - - - - - - -
[UnresLn3 not used]: Received
100,000 - - - - - - - - - - -
[UnresLn3 not used]: Bal. (ref) - 100,000 100,000
100,000
100,000 100,000 100,000 100,000 100,000 100,000 100,000 100,000 100,000
Unidentified default loan: Received
- - - - - - - - - - - -
Unidentified default loan: Bal. (ref) - - - - - - - - - - - -
4
New Unrestricted Grants
- - - - - - - - - - - -
Greenland Dev. Agency: Received
- - - - - - - - - - - -
Greenland Dev. Agency: Bal. (ref) - - - - - - - - - - - - -
[Unres2 not used]: Received
- - - - - - - - - - - -
[Unres2 not used]: Bal. (ref) - - - - - - - - - - - - -
[Unres3 not used]: Received
- - - - - - - - - - - -
[Unres3 not used]: Bal. (ref) - - - - - - - - - - - - -
Unidentified default grant: Received
- - - - - - - - - - - -
Unidentified default grant: Bal. (ref) - - - - - - - - - - - -
5
Change in available savings
- - - - - - - - - - - -
Available Compulsory savings
- - - - - - - - - - - - -
Available Voluntary savings
- - - - - - - - - - - - -
Product 1: Passbook Savings - - - - - - - - - - - - -
Product 2: Term Deposits - - - - - - - - - - - - -
Product 3: [savprod 3 not in use] - - - - - - - - - - - - -
Product 4: [savprod 4 not in use] - - - - - - - - - - - - -
6
New equity investments
- - - - - - - - - - - -
[Equity1 not used]: Sales/(Repurch)
- - - - - - - - - - - -
[Equity1 not used]: Bal. (ref) - - - - - - - - - - - - -
[Equity2 not used]: Sales/(Repurch)
- - - - - - - - - - - -
[Equity2 not used]: Bal. (ref) - - - - - - - - - - - - -
[Equity3 not used]: Sales/(Repurch)
- - - - - - - - - - - -
[Equity3 not used]: Bal. (ref) - - - - - - - - - - - - -
[Equity4 not used]: Sales/(Repurch)
- - - - - - - - - - - -
[Equity4 not used]: Bal. (ref) - - - - - - - - - - - - -
New Dividend Payments
- - - - - - - - - - - -
Balance of dividend payments (Ref) - - - - - - - - - - - - -
7
Total available unrestricted resources
127,746 126,981
127,817
129,115 146,023 156,307 160,783 166,152 168,189 171,086 174,415 178,553
Uses of unrestricted resources
NOTE: This section applies available unrestricted resources to the shortfalls identified above.
8 Operational Financing 15,622 15,637 15,653 0 6,352 15,546 15,562 21,210 22,350 23,038 23,059 23,080
9 Portfolio Financing 000000000006,112
10 Other Asset Financing 1,512 00000000000
11
Ending unrestricted resources avail.
12,400 110,611 111,343
112,165
129,115 139,672 140,761 145,221 144,942 145,840 148,047 151,356 149,361
Liquidity Analysis
In addition to the needs identified above, it is also important to have excess funds to cover liquidity.
This section estimates desired liquidity levels and then determines if there are adequate restricted and unrestricted resources to cover them.
Calculation of liquidity shortfalls
1 Portfolio liquidity shortfall - - - - - - - - - - 11,363 53,269
2 Operational liquidity shortfall 5,155 5,160 - - 5,176 5,130 5,135 6,999 7,375 7,603 7,610 7,616
3
Liquidity shortfalls needing coverage
5,155 5,160 0 0 5,176 5,130 5,135 6,999 7,375 7,603 18,973 60,885
4
Ending unrestricted resources avail.
110,611 111,343
112,165
129,115 139,672 140,761 145,221 144,942 145,840 148,047 151,356 149,361
5
Liquidity shortfall - - - - - - - - - - - -
207
This section contains printouts of several pages:
• The Summary Output Report, providing a brief overview of all activity,
with data reported by fiscal year rather than by month
• The Income Statement, which includes analysis of adjustments for conces-
sionary loans, inflation, and in-kind subsidies
• The Balance Sheet
• The Cash Flow projections
• The Ratio Analysis page, with financial ratios on portfolio quality, prof-
itability, solvency, efficiency and productivity, and growth and outreach.
This section also contains two additional worksheets that are not integrated into
the model but serve as analytical tools:
• The Client Cost page, a worksheet for calculating the cost of a loan to the
client, taking into consideration all financial aspects of the loan as well as com-
pulsory savings, transaction costs, and peer lending risk (see annex 5)
• A detailed Repayment Schedule for the situation modeled in the Client
Cost worksheet.
Financial statements and analysis
208 SUMMARY OUTPUT REPORT
Year 1 Year 2 Year 3 Year 4 Year 5
FY96 FY97 FY98 FY99 FY00 FY01 FY02
Summary Output Report
Balance Sheet
ASSETS
Cash in Bank and Near Cash 56,380
51,400
60,885 93,151 169,953 155,058 165,346
Net Portfolio Outstanding 404,000 484,000 776,899 1,344,046 2,110,008 3,085,239 3,910,023
Short-term Inv. & other curr assets 61,400
11,400
106,222 182,668 159,155 269,544 516,291
Net Fixed Assets 20,000
16,000
20,284 59,717 59,364 57,559 45,175
Long-term Invest. & other LT assets 0 0 0 40,000 30,000 20,000 10,000
TOTAL ASSETS 541,780 562,800 964,291 1,719,582 2,528,479 3,587,400 4,646,835
LIABILITIES
Savings deposits 00000750,824 1,469,826
Concessional Loans 310,000 110,000 210,000 710,000 680,000 650,000 620,000
Commercial Loans 180,000 372,000 372,000 372,000 372,000 372,000
Other liabilities 0000000
TOTAL LIABILITIES 310,000 290,000 582,000 1,082,000 1,052,000 1,772,824 2,461,826
EQUITY
Accum. Donated equity, prev. period 291,700
42,600
130,000 250,000 700,000 100,000 0
Donated equity, current period 5,700 297,400 340,000 470,000 720,000 1,420,000 1,520,000
Shareholder equity (less div pmt) 0000000
Accumulated net surplus (65,620) (67,200) (87,709) (82,418) 56,479 294,576 665,010
TOTAL EQUITY 231,780 272,800 382,291 637,582 1,476,479 1,814,576 2,185,010
TOTAL LIABILITIES AND EQUITY 541,780 562,800 964,291 1,719,582 2,528,479 3,587,400 4,646,835
Balance sheet verification 0000000
Income Statement
Total Financial Income 0 169,320 241,694 453,386 733,216 1,047,984 1,401,461
Total Financial Costs 0
22,200
38,580 73,713 95,043 129,600 210,988
Gross Financial Margin 0 147,120 203,114 379,673 638,173 918,384 1,190,473
Provision for loan losses 0
20,000
35,212 67,214 98,577 138,968 165,577
Net Financial Margin 0 127,120 167,902 312,459 539,597 779,416 1,024,896
Program Operating Exp 0
80,100
139,091 228,067 312,270 440,424 545,139
Administrative Operating Exp 0
48,600
49,319 79,101 88,428 100,896 109,323
Amount of taxes paid 00000
Net income from operations (after taxes) 0
(1,580)
(20,509) 5,291 138,898 238,097 370,434
Grant Income 0
42,600
130,000 250,000 700,000 100,000 0
Excess of Income over Expenses 0
41,020
109,491 255,291 838,898 338,097 370,434
Adjustments to Operating Margin 57,667 90,620 166,243 210,953 239,049
Cashflow Projections
Cash flow from Operations (a) 19,585 91,549 259,726 400,743 560,967
Total Other Sources (b) 1,935,958 3,544,961 4,971,150 7,214,808 9,164,869
Total Other Uses (c) 2,076,057 3,854,244 5,854,075 7,730,446 9,715,547
Net change in equity (d) 00000
Plus grant income (e) 130,000 250,000 700,000 100,000 0
Ending Balance 60,885 93,151 169,953 155,058 165,346
SUMMARY OUTPUT REPORT 209
Year 1 Year 2 Year 3 Year 4 Year 5
FY96 FY97 FY98 FY99 FY00 FY01 FY02
Financing Sources
New Unrestricted Grants 0 200,000 200,000 100,000 0
New restricted grants for operations
25,000 25,000 0 0 0
New restricted grants for portfolio
80,000 0 500,000 0 0
New restricted grants for other assets
25,000 25,000 0 0 0
New Unrestricted Loans 100,000 0000
Change in Portfolio Loans 192,000 500,000 (30,000) (30,000) (30,000)
Change in Loans for other assets 00000
New equity investments 00000
Ratio Analysis
Portfolio Quality
Loan Loss Reserve Ratio 3.9% 3.9% 3.9% 3.9% 3.9%
Loan Write-off Ratio 3.9% 3.9% 3.7% 3.7% 3.6%
Profitability
Adjusted Return on Total Assets -9.7% -6.0% -1.2% 0.9% 3.2%
Solvency
Equity Multiplier 2.52 2.70 1.71 1.98 2.13
Efficiency & Productivity
Operating Cost Ratio 32.9% 28.1% 22.0% 19.2% 17.5%
Borrowers per Loan Officer 228 268 291 283 292
Overhead percentage 26.2% 25.8% 22.1% 18.6% 16.7%
Loan Officers as % of total staff" 65.7% 67.0% 68.7% 60.6% 62.7%
Growth and Outreach
Total Loan Portfolio 420,000 504,000 808,799 1,399,232 2,195,848 3,210,753 4,069,092
Overall growth in portfolio 20% 60% 73% 57% 46% 27%
Number of active loans 0 3,600 4,784 6,977 8,721 10,466 11,961
Overall growth in borrowers #N/A 33% 46% 25% 20% 14%
Client dropout rate 13% 13% 15% 15% 16%
Total Voluntary Savings Deposits 0
0
0 0 0 750,824 1,469,826
Number of voluntary depositors 0 0 0 9,812 12,906
Financial Statements
in External Currency
To be completed
210 INCOME STATEMENT
Initial 123456789101112
Balance Jan-98 Feb-98 Mar-98 Apr-98 May-98 Jun-98 Jul-98 Aug-98 Sep-98 Oct-98 Nov-98 Dec-98
Income Statement
Income Statement
Financial Income
Interest on loans 12,764 13,026 13,153 13,182 13,108 12,768 13,220 14,554 15,751 17,151 18,682 19,807
Commissions and fees incl. penalties 2,508 2,534 2,560 2,685 2,716 2,738 5,050 5,106 5,326 6,243 6,325 6,392
Indexing income on loans 000000000000
Income on Investments 73 809 761 1,083 1,084 1,130 1,752 1,271 2,170 1,852 1,360 998
Total Financial Income 15,346 16,369 16,474 16,950 16,908 16,635 20,022 20,931 23,247 25,246 26,368 27,197
Financial Costs
Interest and fees on borrowed funds 2,375 2,375 2,375 2,375 2,375 2,375 2,375 3,495 4,615 4,615 4,615 4,615
Interest paid on savings deposits 000000000000
Indexing expense of deposits and loans 000000000000
Total Financial Costs 2,375 2,375 2,375 2,375 2,375 2,375 2,375 3,495 4,615 4,615 4,615 4,615
Gross Financial Margin 12,971 13,994 14,099 14,575 14,533 14,260 17,647 17,436 18,632 20,631 21,753 22,582
Provision for loan losses 1,547 1,856 1,642 1,540 1,221 824 3,506 3,826 3,973 5,212 5,132 4,932
Net Financial Margin 11,423 12,138 12,457 13,035 13,313 13,437 14,140 13,610 14,659 15,419 16,620 17,650
Operating Costs
Program 9,556 9,562 9,568 9,574 9,581 9,434 9,440 14,029 14,039 14,758 14,769 14,780
Salaries and benefits 6,645 6,645 6,645 6,645 6,645 6,645 6,645 9,240 9,240 9,600 9,600 9,600
Other operational expenses 2,797 2,803 2,809 2,815 2,821 2,674 2,680 4,604 4,614 4,933 4,944 4,955
Depreciation 114 114 114 114 114 114 114 185 185 226 226 226
Administration 4,058 4,067 4,076 4,086 4,095 4,105 4,114 4,124 4,134 4,144 4,153 4,163
Salaries and benefits 1,740 1,740 1,740 1,740 1,740 1,740 1,740 1,740 1,740 1,740 1,740 1,740
Other operational expenses 2,065 2,074 2,083 2,093 2,102 2,112 2,121 2,131 2,141 2,151 2,160 2,170
Depreciation and amortization 253 253 253 253 253 253 253 253 253 253 253 253
Total Operating Costs 13,614 13,630 13,645 13,660 13,676 13,538 13,554 18,153 18,173 18,902 18,923 18,944
Net Income from Operations (before taxes)
(2,191) (1,491)
(1,188)
(625) (363) (102) 587 (4,543) (3,514) (3,483) (2,302) (1,294)
Amount of taxes paid
000000000000
Net income from operations (after taxes) (2,191) (1,491)
(1,188)
(625) (363) (102) 587 (4,543) (3,514) (3,483) (2,302) (1,294)
Income from grants for Loan Fund Capital 0000080,000 000000
Income from grants for Fixed Assets 0 0 25,000 000000000
Income from grants for Operations 0 0 25,000 000000000
Income from unrestricted grants 000000000000
Excess of Income over Expenses (2,191) (1,491) 48,812 (625) (363) 79,898 587 (4,543) (3,514) (3,483) (2,302) (1,294)
Adjustments to
Income Statement
Note: Adjustments and financial ratios EXCLUDE any taxes paid by the institution
Net Income from Operations (before taxes)
(2,191) (1,491)
(1,188)
(625) (363) (102) 587 (4,543) (3,514) (3,483) (2,302) (1,294)
Adjustments to Operating Margin
3,343 4,423 4,615 4,810 4,809 5,129 5,453 4,300 5,239 5,205 5,175 5,165
Subsidized cost of funds adjustment 809 1,907 1,907 1,907 1,907 1,907 1,907 787 1,775 1,775 1,775 1,775
Inflation adjustment of equity 2,034 2,017 2,208 2,403 2,402 2,722 3,046 3,013 2,964 2,930 2,900 2,890
In-kind subsidies 500 500 500 500 500 500 500 500 500 500 500 500
Adjusted Return from Operations
(5,535) (5,915)
(5,803)
(5,435) (5,172) (5,231) (4,866) (8,843) (8,753) (8,688) (7,477) (6,458)
Income Statement
Analysis
NOTE: The choice of denominator is made on the MODEL SETUP page in the financial ratios section
Choice of denominator for ratios
Calculate ratios based on TOTAL ASSETS
Note: If cash balances are negative, they are excluded from the calculation
Total Assets 562,800 660,609 659,118 707,930 707,305 706,941 786,840 787,426 974,884 971,370 967,887 965,585 964,291
Average Total Assets 611,704 659,863 683,524 707,617 707,123 746,891 787,133 881,155 973,127 969,629 966,736 964,938
NOTE: The following ratios are stated on an annualized equivalent
Return on Total Assets 30.1% 29.8% 28.9% 28.7% 28.7% 26.7% 30.5% 28.5% 28.7% 31.2% 32.7% 33.8%
- Financing Costs * 4.7% 4.3%
4.2%
4.0% 4.0% 3.8% 3.6% 4.8% 5.7% 5.7% 5.7% 5.7%
= Gross Financial Margin 25.4% 25.4% 24.8% 24.7% 24.7% 22.9% 26.9% 23.7% 23.0% 25.5% 27.0% 28.1%
- Loan Loss Provisions * 3.0% 3.4%
2.9%
2.6% 2.1% 1.3% 5.3% 5.2% 4.9% 6.5% 6.4% 6.1%
= Net Financial Margin 22.4% 22.1% 21.9% 22.1% 22.6% 21.6% 21.6% 18.5% 18.1% 19.1% 20.6% 21.9%
- Operating Costs 26.7% 24.8% 24.0% 23.2% 23.2% 21.8% 20.7% 24.7% 22.4% 23.4% 23.5% 23.6%
= Operating Margin (ROA) -4.3% -2.7%
-2.1%
-1.1% -0.6% -0.2% 0.9% -6.2% -4.3% -4.3% -2.9% -1.6%
- Adjustments to Operations 6.6% 8.0%
8.1%
8.2% 8.2% 8.2% 8.3% 5.9% 6.5% 6.4% 6.4% 6.4%
= Net Margin (Adjusted ROA) -10.9% -10.8%
-10.2%
-9.2% -8.8% -8.4% -7.4% -12.0% -10.8% -10.8% -9.3% -8.0%
NOTE: The symbol #NA indicates that the number is too large to calculate.
Operational Sustainability 88% 92% 93% 96% 98% 99% 103% 82% 87% 88% 92% 95%
Financial Sustainability 73% 73% 74% 76% 77% 76% 80% 70% 73% 74% 78% 81%
Adjusted Return on Equity -24% -26% -24% -21% -20% -18% -15% -27% -27% -27% -23% -20%
End of information on this page
BALANCE SHEET 211
212 CASH FLOW PROJECTIONS PAGE
Initial 1 2 3 4 5 6 7 8 9 10 11 12
Balance Jan-98 Feb-98 Mar-98 Apr-98 May-98 Jun-98 Jul-98 Aug-98 Sep-98 Oct-98 Nov-98 Dec-98
Cashflow Projections
Net income from operations (2,191) (1,491) (1,188) (625) (363) (102) 587 (4,543) (3,514) (3,483) (2,302) (1,294)
Non-cash operating items
+ Depreciation and amortization 367 367 367 367 367 367 367 438 438 479 479 479
+ Loan loss provisions 1,547 1,856
1,642
1,540 1,221 824 3,506 3,826 3,973 5,212 5,132 4,932
Cash flow from Operations (a)
(277) 732 821 1,282 1,225 1,089 4,460 (279) 897 2,208 3,309 4,117
Plus other sources
Loan repayments received 70,462 76,671
83,007
89,471 96,480 103,640 110,901 120,862 131,147 142,510 153,928 165,615
Net increase in borrowed funds 100,000 -
- - - - - 192,000 - - - -
Net increase in savings deposits - -
- - - - - - - - - -
Net decrease in other assets - -
- - - - - - - - - -
Net decrease in short-term invest. - 7,288 - - - - 72,248 - 47,692 73,825 54,304 43,907
Net decrease in long-term invest. - -
- - - - - - - - - -
Net increase in accrued expenses - -
- - - - - - - - - -
Net decrease in other current assets - -
- - - - - - - - - -
Net increase in other current liabilities - -
- - - - - - - - - -
Net increase in other long-term liabilities - -
- - - - - - - - - -
Total Other Sources (b)
170,462 83,958
83,007
89,471 96,480 103,640 183,149 312,862 178,839 216,336 208,233 209,523
Minus other uses
Loan disbursements 83,600 84,468
85,345
89,508 90,531 91,253 168,334 170,205 177,529 208,107 210,849 213,076
Net decrease in borrowed funds - -
- - - - - - - - - -
Net decrease in savings deposits - -
- - - - - - - - - -
Net increase in other assets 1,512 -
- - - - - 5,089 - 2,565 - -
Net increase in short-term investments 110,418 -
48,259
200 6,912 93,341 - 134,958 - - - -
Net increase in long-term investments - -
- - - - - - - - - -
Net decrease in accrued expenses - -
- - - - - - - - - -
Net increase in other current assets - -
- - - - - - - - - -
Net decrease in other current liabilities - -
- - - - - - - - - -
Net decrease in other long-term liabilities - -
- - - - - - - - - -
Total Other Uses (c)
195,530 84,468 133,604 89,707 97,443 184,594 168,334 310,251 177,529 210,672 210,849 213,076
Changes in equity position
Plus: Stock issued 0 0 0 0 0 0 0 0 0 0 0 0
Minus: Dividend payments 0 0 0 0 0 0 0 0 0 0 0 0
Net change in equity (d)
000000000000
Plus grant income (e)
- -
50,000
- - 80,000 - - - - - -
Net Cash Flow (a + b - c + d)
(25,345) 222 224 1,046 261 135 19,275 2,332 2,207 7,872 692 564
Beginning Cash Balance
51,400 26,055
26,277
26,502 27,547 27,808 27,943 47,219 49,550 51,758 59,629 60,322
Ending Balance
26,055 26,277
26,502
27,547 27,808 27,943 47,219 49,550 51,758 59,629 60,322 60,885
Comparison to Balance Sheet cash 0 0 0 0 0 0 0 (0) (0) 0 0 0
RATIO ANALYSIS PAGE 213
Initial 123456789101112
Balance Jan-98 Feb-98 Mar-98 Apr-98 May-98 Jun-98 Jul-98 Aug-98 Sep-98 Oct-98 Nov-98 Dec-98
Ratio Analysis
Portfolio Quality
Portfolio at Risk > 30 days 10.0% 10.3% 10.6% 10.9% 11.2% 11.5% 10.0% 10.3% 10.6% 10.9% 11.2% 11.5% 10.0%
Loan Loss Reserve Ratio 4.0% 4.2% 4.5% 4.8% 5.0% 5.3% 3.9% 4.2% 4.5% 4.7% 5.0% 5.3% 3.9%
Loan Write-off Ratio 0.0% 0.0% 0.0% 0.0% 0.0% 1.7% 0.0% 0.0% 0.0% 0.0% 0.0% 1.8%
Profitability
NOTE: These figures are annualized
Adjusted Return on Total Assets -10.9% -10.8%
-10.2%
-9.2% -8.8% -8.4% -7.4% -12.0% -10.8% -10.8% -9.3% -8.0%
Operational Sustainability 88% 92% 93% 96% 98% 99% 103% 82% 87% 88% 92% 95%
Financial Sustainability 73% 73% 74% 76% 77% 76% 80% 70% 73% 74% 78% 81%
Adjusted Return on Equity -24% -26% -24% -21% -20% -18% -15% -27% -27% -27% -23% -20%
Solvency
Equity Multiplier 2.06 2.44 2.45 2.23 2.23 2.23 1.98 1.98 2.48 2.49 2.51 2.52 2.52
Quick Ratio 0.0 0.0 0.0 0.0 0.0 0.0 0.0 0.0 0.0 0.0 0.0 0.0 0.0
Efficiency &
Productivity
Yield on Portfolio 30.0% 30.0% 30.0% 30.0% 30.0% 30.0% 30.0% 30.0% 30.0% 30.0% 30.0% 30.0%
Operating Cost Ratio 32.0% 31.4% 31.1% 31.1% 31.3% 31.8% 30.8% 37.4% 34.6% 33.1% 30.4% 28.7%
Borrowers per Loan Officer 277 282 288 294 300 306 338 345 222 229 214 221 228
Portfolio per Loan Officer 38,769 39,780 40,380
40,560
40,562 40,105 41,672 46,458 31,939 34,380 34,230 36,940 38,514
Average cost of debt 8.4% 7.3% 7.3% 7.3% 7.3% 7.3% 7.3% 8.6% 9.5% 9.5% 9.5% 9.5%
Overhead percentage 29.8% 29.8% 29.9% 29.9% 29.9% 30.3% 30.4% 22.7% 22.7% 21.9% 21.9% 22.0%
Loan Officers as % of total staff" 65% 65% 65% 65% 65% 65% 63% 63% 66% 66% 68% 68% 68%
Program Other Op Costs / Portfolio 6.5% 6.4% 6.4% 6.4% 6.5% 6.4% 5.8% 9.1% 8.5% 8.2% 7.6% 7.4%
Net FA per branch/program staff person 313 305 298 291 284 277 288 280 364 357 417 409
Admin-level Other Op Exp / Portfolio 4.8% 4.7% 4.7% 4.8% 4.8% 5.1% 4.6% 4.2% 3.9% 3.6% 3.3% 3.2%
#REF! 2,750 3,065 3,002 2,938 2,875 2,812 2,749 2,685 2,622 2,559 2,496 2,432 2,369
Growth and Outreach
Lending
Total Loan Portfolio 504,000 517,138 524,936 527,274 527,311 521,362 500,069 557,502 606,845 653,227 718,824 775,744 808,799
Overall growth in portfolio 3% 2% 0% 0% -1% -4% 11% 9% 8% 10% 8% 4%
Number of active loans 3,600 3,672 3,745 3,821 3,896 3,975 4,054 4,135 4,218 4,353 4,492 4,636 4,784
Overall growth in borrowers 2% 2% 2% 2% 2% 2% 2% 2% 3% 3% 3% 3%
Client dropout rate 18% 18% 18% 12% 12% 12% 11% 11% 11% 12% 12% 12%
First loans as % of active loans 33% 33% 33% 34% 33% 33% 33% 31% 28% 27% 26% 26% 26%
Voluntary Savings
Total Voluntary Savings Deposits 0000000000000
Percent change in savings deposits 0% 0% 0% 0% 0% 0% 0% 0% 0% 0% 0% 0%
Number of voluntary depositors 0000000000000
Percent change in depositors 0% 0% 0% 0% 0% 0% 0% 0% 0% 0% 0% 0%
Compulsory Savings
Compulsory savings as % of portfolio 14% 14% 14% 15% 15% 16% 17% 17% 16% 16% 15% 15% 15%
214 CLIENT COST WORKSHEET
Effective Interest Rate and Cost to Client Analysis
Loan amount 3,000
Quoted interest rate
30.0%
Repayment frequency weekly 30.0%
annual nominal equivalent
Number of installment periods 13 Weeks
Term Ok
Interest rate method
Grace period Weeks
Interest earned on savings (annual)
Installment schedule
Inflation rate (annual)
10.0%
Amortized loan?
Loan indexed to external rate
0.0%
Note: in the following section, numbers <1 are treated as percentages, and numbers >1 are absolute amounts
Upfront commission #1 0%
Effective Interest Rateincrement nadj. Tot.
real
Upfront commission #2 0% Loan only 30.0%
18.2%
Ongoing commission 0%
including savings
16.9% 46.9%
33.6%
Upfront compulsory savings 0.2 20%
incl. transaction costs
5.0% 52.0%
38.1%
Ongoing compulsory savings 0%
incl. peer risk
48.2% 100.2%
82.0%
A detailed repayment schedule can be found on the next worksheet page ("RepSched")
Page Down to see Transaction Cost section
Transaction Costs Analysis
Before loan Each period The amount in the "period" column will be
Number of trips to office/bank 3 1 repeated for the installment frequency.
Cost of roundtrip transportation going to offic x 0.50 x 0.50 This is currently established as:
Cost of transportation
=
2
=
1
Weeks
Number of roundtrips to office 3 1
Hours spent to go roundtrip to/from office x 1.0 x 1.0
Hours spent in transportation = 3.0 = 1.0
Hours spent with loan officer at business + 1.0 +
Hours in training sessions + 3.0 +
Hours spent in group sessions + 1.0 + 0.5
Hours spent at bank and office + 2.0 + 0.1
Total Hours
= 10.0 = 1.55
Opportunity cost of time (per hour) x 0.20 x 0.20
Total opportunity cost of time
=
2.00
=
0.31
Total Transaction Costs
3.50 0.81
(transportation + opportunity costs)
Financial risk of group default
Assumes each borrower has equal odds of default and that other members in group will share burden.
Thus, in a group of 5 people, there are 4 other possible defaulters, but any defaulting will be split four ways
(the borrower being analyzed plus the three remaining good members)
Average loan size 3,000
Percentage of clients that stop paying their part of group payment 5.0%
Probable amount the "good" client will need to cover (applied in final month)
150
REPAYMENT SCHEDULE 215
The following table shows the repayment schedule and cashflow for the loan given the conditions indicated on the Client Cost page.
Loan Cost and Cashflow
Compulsory Savings
Transaction Costs
Default Risk
Month
#
Balance Principal Interest Indexing
Commission
Cashflow
Savings Interest
Withdrawal
Savings
Balance
Cashflow
Transaction
Costs
Cashflow
Default
Risk
Cashflow
0 3,000 -
3,000
600 600
2,400
3.50
2,397 2,397
1 2,777 222.89 17.31 - -
(240)
- - - 600
(240)
0.81
(241)
-
(241)
2 2,553 224.17 16.02 - -
(240)
- - - 600
(240)
0.81
(241)
-
(241)
3 2,327 225.47 14.73 - -
(240)
- - - 600
(240)
0.81
(241)
-
(241)
4 2,101 226.77 13.43 - -
(240)
- - - 600
(240)
0.81
(241)
-
(241)
5 1,873 228.08 12.12 - -
(240)
- - - 600
(240)
0.81
(241)
-
(241)
6 1,643 229.39 10.80 - -
(240)
- - - 600
(240)
0.81
(241)
-
(241)
7 1,413 230.72 9.48 - -
(240)
- - - 600
(240)
0.81
(241)
-
(241)
8 1,180 232.05 8.15 - -
(240)
- - - 600
(240)
0.81
(241)
-
(241)
9 947 233.39 6.81 - -
(240)
- - - 600
(240)
0.81
(241)
-
(241)
10 712 234.73 5.46 - -
(240)
- - - 600
(240)
0.81
(241)
-
(241)
11 476 236.09 4.11 - -
(240)
- - - 600
(240)
0.81
(241)
-
(241)
12 239 237.45 2.75 - -
(240)
- - - 600
(240)
0.81
(241)
-
(241)
13 - 238.82 1.38 - -
(240)
- - 600 -
360
-
360
150
210
14 - - - - -
-
- - - -
-
-
-
-
-
15 - - - - -
-
- - - -
-
-
-
-
-
16 - - - - -
-
- - - -
-
-
-
-
-
17 - - - - -
-
- - - -
-
-
-
-
-
18 - - - - -
-
- - - -
-
-
-
-
-
19 - - - - -
-
- - - -
-
-
-
-
-
20 - - - - -
-
- - - -
-
-
-
-
-
21 - - - - -
-
- - - -
-
-
-
-
-
22 - - - - -
-
- - - -
-
-
-
-
-
23 - - - - -
-
- - - -
-
-
-
-
-
24 - - - - -
-
- - - -
-
-
-
-
-
25 - - - - -
-
- - - -
-
-
-
-
-
26 - - - - -
-
- - - -
-
-
-
-
-
27 - - - - -
-
- - - -
-
-
-
-
-
28 - - - - -
-
- - - -
-
-
-
-
-
29 - - - - -
-
- - - -
-
-
-
-
-
30 - - - - -
-
- - - -
-
-
-
-
-
31 - - - - -
-
- - - -
-
-
-
-
-
32 - - - - -
-
- - - -
-
-
-
-
-
33 - - - - -
-
- - - -
-
-
-
-
-
34 - - - - -
-
- - - -
-
-
-
-
-
35 - - - - -
-
- - - -
-
-
-
-
-
36 - - - - -
-
- - - -
-
-
-
-
-
37 - - - - -
-
- - - -
-
-
-
-
-
38 - - - - -
-
- - - -
-
-
-
-
-
39 - - - - -
-
- - - -
-
-
-
-
-
40 - - - - -
-
- - - -
-
-
-
-
-
41 - - - - -
-
- - - -
-
-
-
-
-
42 - - - - -
-
- - - -
-
-
-
-
-
43 - - - - -
-
- - - -
-
-
-
-
-
44 - - - - -
-
- - - -
-
-
-
-
-
45 - - - - -
-
- - - -
-
-
-
-
-
46 - - - - -
-
- - - -
-
-
-
-
-
47 - - - - -
-
- - - -
-
-
-
-
-
48 - - - - -
-
- - - -
-
-
-
-
-
49 - - - - -
-
- - - -
-
-
-
-
-
50 - - - - -
-
- - - -
-
-
-
-
-
51 - - - - -
-
- - - -
-
-
-
-
-
52 - - - - -
-
- - - -
-
-
-
-
-
3,000 123 0 0
30.0%
600 0 600
47%
13
52.0%
150
100.2%
0.0058
This annex lists all the data required to complete the model, grouped by the page
on which the information is input. (For clarification of any of the requirements
refer to the relevant sections of the handbook.) As the list indicates, Microfin
requires substantial data to generate reliable projections. Much of this informa-
tion describes current loans. If an institution does not track the kind of detailed
information needed to complete the model, staff can analyze a sample survey of
client records to estimate the data (box A3.1).
MODEL
SETUP page
1. Name of the institution
2. Name of the local currency
3. Starting month and year for projections
4. Inflation rate projections
5. Product indexing rate projections (only for institutions with indexed financial
products)
6. Balance sheet and income statement for current fiscal year (complete or esti-
mated for the end-period prior to the starting month and year for the pro-
jections)
7. Balance sheet and income statement for previous two fiscal years (optional)
8. Statistical portfolio data (optional; see the Model Setup page for data require-
ments)
PRODUCTS page
• Number of distinct loan and savings products to be offered in the coming five
years (maximum of four each)
• For each loan product:
1. Average loan amount by cycle and by month
2. Indication of whether loan amounts increase by inflation either monthly
or annually
3. Repayment frequency (daily, weekly, biweekly, monthly, end-of-term)
4. Average effective loan term by cycle and by month
5. Grace period
6. Any up-front or ongoing compulsory savings requirements
7. Interest rate method (declining balance or flat)
ANNEX
3
Data Requirements
for Completing Microfin
218 BUSINESS PLANNING AND FINANCIAL MODELING FOR MICROFINANCE INSTITUTIONS: A HANDBOOK
8. Annual interest rate charged, by month
9. Any up-front and ongoing commissions charged, by month
10. Indication of whether the loan is indexed to an external value
• For each savings product:
1. Annual interest rate paid, by month
2. Percentage of savings held in reserve, by month
3. Indication of whether savings accounts are indexed to an external value
4. For compulsory savings only, indication of whether the savings appear on
the institution’s balance sheet
INST.CAP. page
1. Loan write-off frequency (monthly, quarterly, semiannual, annual)
2. Loan loss provisioning rates by aging bracket
3. Overhead cost allocation methods (how financial costs and operational admin-
istrative or head office costs are allocated back to branch offices; required
only if modeling individual branches)
4. Title used in the institution for the position of loan officer
5. Staff titles for all program (or branch office) positions
6. Staff titles for all administrative (or head office) positions
7. Indication of whether salaries and benefits are revised annually for inflation
8. Program (or branch office) operational expense categories
9. Administrative (or head office) operational expense categories
10. Program (or branch office) fixed asset categories
11. Administrative (or head office) fixed asset categories
12. Any buildings owned or to be owned
13. Categories for other assets (such as MIS software)
PROGRAM/BRANCH page
• For each loan product:
1. Number of active loans for the product at the beginning of the projec-
tions
2. Estimated distribution of those active loans by loan cycle
3. Initial loan portfolio for the product
4. Projected number of active loans for each month (This is a critical num-
ber for generating the portfolio projections; it should be based on the mar-
ket study done during strategic planning.)
5. Estimated client retention rates for each cycle, by month
• For any compulsory savings, the initial balance of savings held
• For each voluntary savings product:
ANNEX 3DATA REQUIREMENTS FOR COMPLETING MICROFIN 219
1. Estimated percentage of borrowers of each loan product saving voluntar-
ily, by month
2. Projected number of savers, independent of borrower projections, by month
3. Any initial savings balance for the product
4. Estimated average balance per savings account, by month
• For the expense projections:
1. Projected portfolio at risk rates
2. Projected long-term loan default rate, as a percentage of the average annual
portfolio
3. Initial balance of the loan loss reserve for the branch
4. Loan officer productivity estimates (percentage of optimal caseload for
entry- and intermediate-level staff, number of months between promo-
tions)
5. Average longevity of loan officers (used to calculate staff turnover)
6. Minimum number of new loan officers to be hired as a group
7. Length of any loan officer training program or apprenticeship period
8. Optimal loan officer caseload for each product, by month
9. Number of staff for all program-level positions, current and projected
10. Monthly salary and benefits for each staff position, current and projected
11. Estimated monthly operational expenses for each category, current and
projected
12. Undepreciated book value of all currently held branch-level fixed assets,
by category
13. Estimated average remaining life of initial fixed assets
14. Planned fixed asset acquisition schedule, by category
ADMIN/HEAD OFFICE page
1. Number of administrative (or head office) staff, by position, current and pro-
jected
2. Monthly salary and benefits for each administrative (or head office) staff posi-
tion, current and projected
3. Estimated monthly operational expenses for each category, current and pro-
jected
4. Undepreciated book value of all currently held administrative (or head office)
fixed assets, by category
5. Estimated average remaining life of initial fixed assets
6. Planned fixed asset acquisition schedule, by category
7. Projected land acquisition, by month
8. Projected building acquisition, by month
9. Accumulated depreciation for buildings
10. Unamortized book value of all currently held other assets, by category
220 BUSINESS PLANNING AND FINANCIAL MODELING FOR MICROFINANCE INSTITUTIONS: A HANDBOOK
11. Estimated average remaining life of other assets
12. Planned acquisition schedule for other assets, by category
13. Formulas for the calculation of any taxes to be paid
14. Estimates of any in-kind contributions received (such as technical support or
free office space)
FIN.SOURCES
and FIN.FLOWS pages
1. For all current grant sources, balances already received, projected disburse-
ment schedules, estimated total funding available, and any applicable funding
restrictions
2. For all loan sources, initial balances, total approved amounts, disbursement sched-
ules, repayment schedules, interest rates, and any restrictions on use of the loan
3. For all equity sources, initial balances, projected investments, and projected
dividends
4. Determination of whether savings are to be restricted to portfolio financing
or treated as unrestricted funds
5. Restrictions on the use of any initial cash, bank, or investment balances
6. Estimated target liquidity levels for operations and for portfolio financing
7. Market rate cost of funds projections (cost for the institution to borrow funds
from commercial sources)
8. Average interest rates earned on cash deposits, short-term and long-term
investments, and savings reserve deposits
Box A3.1
Performing a sample survey of client loan data
Institutions that need to estimate the client loan data required by the model can do
so by analyzing two samples—a sample of new loans issued in the past 12 months and
a sample of clients.
First, a random sampling of new loans issued in the past 12 months should be
analyzed for each loan product. The data should be grouped by the client’s loan cycle;
for example, a record for the third loan received by a client should be grouped with
the records for other third-cycle loans. (See section 4.2.2 for an explanation of loan
cycles.) Then the average initial loan amount and contractual loan term should be
calculated for each loan cycle. In addition, for loans that have been repaid, the con-
tractual loan term should be compared with the actual time taken to pay back the loan
to calculate the effective loan term (see section 4.3.2). These data will all be used in
defining each loan product.
Second, a random sampling of clients should be selected, sorted by loan product,
to calculate the retention rates for each product. For each client it should be deter-
mined whether the client proceeded to receive another loan once one loan was fully
repaid. The results should be tabulated by loan cycle. Then, to calculate the reten-
tion rate for each cycle, the number of clients receiving a loan from the next cycle
should be divided by the number of clients fully paying off a loan in that (first) cycle
(see section 5.2.3).
221
The purpose of this exercise is to help users understand how calculations are per-
formed on the Program/Branch page. Follow these steps:
1. Use loan product 4 as the test product to avoid having to modify any work
done previously. Assign it the name test product at the top of the Products
page. (You may need to change the number of loan products in use, also at the
top of the Products page.)
2. In the product definition section for loan product 4 indicate a loan size of 100
for each cycle, no indexing to inflation, and monthly repayments. Indicate an
effective loan term of three months for each cycle and no grace period.
3. Assign compulsory savings of 10 percent up front on the requested loan amount.
4. Assign an interest rate of 12 percent on a declining balance and an up-front
commission of 1 percent.
5. Move to the Program/Branch page. Click on the loan input button and then
page down to the loan product 4 input section.
6. In step 1 leave initial balances as zero.
7. In step 2 input growth rates in line 12, bypassing the annual targets by
branch section. Input an increase of 100 active loans a month in the month
1 cell, the month 13 cell, and the beginning of years 3, 4, and 5.
8. In step 3 input 100 percent retention rates for all cycles.
9. Click on the graphs button. Find and analyze the three graphs relating to
product 4.
10. Don’t forget to hit F9 (the recalculation button) before viewing graphs after each
change.
11. Click on the return from graphs button to get back to the numbers. Then
click on the loan output button and page down to the loan product 4 section.
12. Study the information in the number of loans section until you understand
what is happening. Then study the information in the portfolio activity
section until you understand it.
13. Now click on the show/hide detail button to increase the level of detail.
Follow the flow of clients through the loan cycles in the number of loans
section until you understand it. What happens when loans mature within a
specific cycle?
14. Now study the information in the portfolio activity section. Follow the
flow of money until you understand what is happening.
15. Click on the loan input button to move back to the top of the page. In step
3 change all retention rates for product 4 from 100 percent to 50 percent.
ANNEX
4
Program or Branch
Modeling Exercise
222 BUSINESS PLANNING AND FINANCIAL MODELING FOR MICROFINANCE INSTITUTIONS: A HANDBOOK
16. Click on the graphs button to view the change in the loans by cycle graph.
What is happening? (Don’t forget to hit F9 to recalculate.)
17. Click on return from graphs and then click on loan output. Study the cycle-
by-cycle information in the number of loans section for product 4 and
determine what is happening. How is the number of disbursed first-cycle loans
determined?
18. Click on the graphs button and review the graphs relating to all loan prod-
uct activity (these follow the product 4 graphs). Try to interpret the informa-
tion each graph is showing you. Note the amounts in month 60 for loan
portfolio, disbursements and repayments (on the branch-level graphs page),
and average loan size.
19. Click on return from graphs and move to the Products page. Change the
average loan amounts in the succeeding cycles to 100, 200, 300, 400, 500, and
600. Change the loan terms to 3, 4, 5, 6, 7, and 8 months.
20. Move to the Program/Branch page and change the client retention rate to
80 percent for each cycle.
21. Click on the graphs button to review the results of these changes. (Remember
to hit F9.) Note the difference both in the shape of the graphs and in the
monetary amounts for portfolio, disbursements, repayments, and average loan
size.
22. If you have more time, continue to experiment!
23. Remember to “zero out” all this activity for product 4 before continuing to
work with the case study (or reset the number of loan products in use on the
Products page).
223
Microfin includes a tool for making precise calculations of effective interest rates
and considering other cost issues that may influence a client’s decision to take out
a loan. This worksheet, labeled Client Cost, is near the end of the Microfin
workbook (figure A5.1).
ANNEX
5
Analysis of Effective Interest
Rates and Costs to Clients
FIGURE A5.1
Calculating the cost of a loan to the client
224 BUSINESS PLANNING AND FINANCIAL MODELING FOR MICROFINANCE INSTITUTIONS: A HANDBOOK
In addition to allowing more detailed analysis of financial factors considered
previously, this worksheet enables users to quantify transaction costs that the client
may perceive as a result of the loan requirements (figure A5.2). It also helps users
estimate the financial risk to a client of guaranteeing the loans of other group
members in group lending methodologies.
Experimenting with this worksheet can help users understand the true finan-
cial costs for clients under different scenarios. For example, does a loan become
more or less expensive when the repayment frequency changes from monthly to
weekly?
FIGURE A5.2
Analyzing transaction costs for clients
225
Strategic planning
Primary readings
Aaker, David A. Developing Business Strategies (New York: John Wiley & Sons,
1995), chapter 2: Strategic Market Management.
CGAP. “Missing Links: Financial Systems That Work for the Majority” (CGAP
Focus Note 3, World Bank, Washington, D.C., 1995).
Gup, Benton E. The Bank Director’s Handbook (Chicago: Irwin Professional
Publishing, 1996), chapter 2: Strategic Management.
Koch, Timothy W. Bank Management (Fort Worth, Tex.: Dryden Press, 1995),
chapter 5: Strategic Planning.
SEEP Network. An Institutional Guide for Enterprise Development Organizations
(New York: PACT Publications, 1993), chapters 2 and 3.
Secondary readings
Austin, Douglas, and Paul Simoff. Strategic Planning for Banks (Rolling Meadows,
Ill.: Bankers Publishing Company, 1990), chapter 5: Strategic Planning.
Christen, Robert Peck. Banking Services for the Poor: Managing for Financial
Success (Washington, D.C.: ACCION International, 1997), section 6.1: A
Business Plan Format.
Waterfield, Charles, and Ann Duval. CARE Savings and Credit Sourcebook
(New York: PACT Publications, 1996), chapter 1: The Program Design
Framework.
Mission and goals
Primary readings
Bryson, John. Strategic Planning for Public and Nonprofit Organizations (San
Francisco: Jossey-Bass, 1995), chapter 4: Clarifying Organizational Mandates
and Mission.
CGAP. “Financial Sustainability, Targeting the Poor, and Income Impact: Are
There Tradeoffs for Micro-finance Institutions?” (CGAP Focus Note 5, World
Bank, Washington, D.C., 1996).
SEEP Network. An Institutional Guide for Enterprise Development Organizations
(New York: PACT Publications, 1993), chapter 4: Creating an Effective
Program.
ANNEX
6
Bibliography of Business
Planning Materials
226 BUSINESS PLANNING AND FINANCIAL MODELING FOR MICROFINANCE INSTITUTIONS: A HANDBOOK
Secondary reading
Waterfield, Charles, and Ann Duval. CARE Savings and Credit Sourcebook (New
York: PACT Publications, 1996), chapter 8: Impact.
Clients and markets
Primary readings
Aaker, David A. Developing Business Strategies (New York: John Wiley & Sons,
1995), chapter 5: Market Analysis.
Gup, Benton E. The Bank Director’s Handbook (Chicago: Irwin Professional
Publishing, 1996), chapter 3: Developing Bank Marketing Strategy.
Secondary readings
Austin, Douglas, and Paul Simoff. Strategic Planning for Banks (Rolling Meadows,
Ill.: Bankers Publishing Company, 1990), chapter 7: Market Analysis and Planning.
Waterfield, Charles, and Ann Duval. CARE Savings and Credit Sourcebook (New
York: PACT Publications, 1996), chapter 2: Target Group.
Environmental analysis
Waterfield, Charles, and Ann Duval. CARE Savings and Credit Sourcebook (New
York: PACT Publications, 1996), chapter 3: Environment.
Institutional assessment
Primary readings
CGAP. “Effective Governance for Micro-finance Institutions” (CGAP Focus Note
7, World Bank, Washington, D.C., 1997).
Waterfield, Charles, and Ann Duval. CARE Savings and Credit Sourcebook (New
York: PACT Publications, 1996), chapter 10: Institutional Capacity Framework.
Secondary reading
Austin, Douglas, and Paul Simoff. Strategic Planning for Banks (Rolling Meadows,
Ill.: Bankers Publishing Company, 1990), chapter 6: Situation Analysis.
Strategies and objectives
Primary readings
Allison, Michael, and Jude Kaye. Strategic Planning for Nonprofit Organizations: A
Practical Guide and Workbook (New York: John Wiley & Sons, 1997), chapter
4: Setting Your Course.
ANNEX 6BIBLIOGRAPHY OF BUSINESS PLANNING MATERIALS 227
Austin, Douglas, and Paul Simoff. Strategic Planning for Banks (Rolling Meadows,
Ill.: Bankers Publishing Company, 1990), chapter 12: Developing Goals and
Objectives: Management and Staff.
Secondary reading
Bryson, John. Strategic Planning for Public and Nonprofit Organizations (San Francisco:
Jossey-Bass, 1995), chapter 7: Formulating and Adopting Strategies.
Products and services
Primary readings
CGAP. “Introducing Savings in Microcredit Institutions: When and How?” (CGAP
Focus Note 8, World Bank, Washington, D.C., 1997).
CGAP. “Microcredit Interest Rates” (CGAP Occasional Paper 1, World Bank,
Washington, D.C., 1996).
MicroFinance Network. “Establishing a Microfinance Industry: Governance, Best
Practices, Access to Capital Markets” (Washington, D.C., 1997), Client
Desertion and New Product Development (pp. 25–30).
Waterfield, Charles, and Ann Duval. CARE Savings and Credit Sourcebook (New
York: PACT Publications, 1996), chapter 5: Interventions; and chapter 6:
Methodology.
Marketing and distribution channels
Christen, Robert Peck. Banking Services for the Poor: Managing for Financial
Success (Washington, D.C.: ACCION International, 1997), section 5.3.2:
Decentralized Decision Making within Branch Offices (pp.189–92).
Gup, Benton E. The Bank Director’s Handbook (Chicago: Irwin Professional
Publishing, 1996), chapter 3: Developing Bank Marketing Strategy.
Institutional resources and capacity
CGAP Newsletter no. 4 (July 1997).
Finances and funding
Austin, Douglas, and Paul Simoff. Strategic Planning for Banks (Rolling Meadows,
Ill.: Bankers Publishing Company, 1990), chapter 14: Short-Term ALM (asset-
liability management).
228 BUSINESS PLANNING AND FINANCIAL MODELING FOR MICROFINANCE INSTITUTIONS: A HANDBOOK
Financial management
Primary readings
CGAP. Management Information Systems for Microfinance Institutions: A Handbook
(New York: PACT Publications, 1998), section 4.2 and Sample Report Formats,
Category C, Porfolio Quality Reports.
SEEP Network. Financial Ratio Analysis of Micro-Finance Institutions (New York:
PACT Publications, 1995).
Women’s World Banking. “Principles and Practices of Financial Management”
(New York, 1994), Introduction and chapters 1 and 2.
Secondary readings
CGAP. Management Information Systems for Microfinance Institutions: A Handbook
(New York: PACT Publications, 1998), chapter 4: Tracking Performance
through Indicators.
Women’s World Banking. “Principles and Practices of Financial Management”
(New York, 1994), chapter 5: Financial Indicators.
Management information systems
Primary readings
Christen, Robert Peck. Banking Services for the Poor: Managing for Financial
Success (Washington, D.C.: ACCION International, 1997), section 5.3.4:
Management Information Systems.
MicroFinance Network. “Establishing a Microfinance Industry: Governance, Best
Practices, Access to Capital Markets” (Washington, D.C., 1997), The MIS
Challenge (pp. 21–24).
Secondary reading
CGAP. Management Information Systems for Microfinance Institutions: A Handbook
(New York: PACT Publications, 1998), chapter 1: Introduction; chapter 5:
Developing and Implementing a Management Information System; and annex
1: An Introduction to MIS Software and Technology.
Implementing a planning process
Fogg, C. Davis. Team-Based Strategic Planning (New York: American Management
Association, 1994), chapter 1: The Traditional Strategic Planning Process.