A visualization tool for the rapid analysis of bacterial transcriptome data pot
Bạn đang xem bản rút gọn của tài liệu. Xem và tải ngay bản đầy đủ của tài liệu tại đây (873.55 KB, 6 trang )
Genome Biology 2004, 5:R37
comment reviews reports deposited research refereed research interactions information
Open Access
2004Baerendset al.Volume 5, Issue 5, Article R37
Software
Genome2D: a visualization tool for the rapid analysis of bacterial
transcriptome data
Richard JS Baerends
*
, Wiep Klaas Smits
*
, Anne de Jong
*
,
Leendert W Hamoen
*†
, Jan Kok
*
and Oscar P Kuipers
*
Addresses:
*
Molecular Genetics, Groningen Biomolecular Sciences and Biotechnology Institute, University of Groningen, Kerklaan 30, 9751 NN
Haren, The Netherlands.
†
Current address: Sir William Dunn School of Pathology, University of Oxford, South Parks Road, Oxford OX1 3RE,
UK.
Correspondence: Anne de Jong. E-mail:
© 2004 Baerends et al.; licensee BioMed Central Ltd. This is an Open Access article: verbatim copying and redistribution of this article are permitted in all
media for any purpose, provided this notice is preserved along with the article's original URL.
Genome2D: a visualization tool for the rapid analysis of bacterial transcriptome dataGenome2D is a Windows-based software tool for visualization of bacterial transcriptome and customized datasets on linear chromosome maps constructed from annotated genome sequences. Genome2D facilitates the analysis of transcriptome data by using different color ranges to depict differences in gene-expression levels on a genome map. Such output format enables visual inspection of the transcriptome data, and will quickly reveal transcriptional units, without prior knowledge of expression level cutoff values. The compiled version of Genome2D is freely available for academic or non-profit use from />Abstract
Genome2D is a Windows-based software tool for visualization of bacterial transcriptome and
customized datasets on linear chromosome maps constructed from annotated genome sequences.
Genome2D facilitates the analysis of transcriptome data by using different color ranges to depict
differences in gene-expression levels on a genome map. Such output format enables visual
inspection of the transcriptome data, and will quickly reveal transcriptional units, without prior
knowledge of expression level cutoff values. The compiled version of Genome2D is freely available
for academic or non-profit use from />molgensoftware.php.
Rationale
Current efforts in whole-genome sequencing have led to a
rapidly increasing number of publicly available bacterial
genome sequences [1,2]. Novel technologies, such as genome-
wide transcriptional profiling using DNA microarrays, ena-
bles the study of the transcriptional regulation of various
processes in these sequenced microorganisms, which can,
subsequently, lead to the identification of the regulatory net-
works involved [3-6]. Bioinformatics tools that enable one to
predict and/or identify transcription regulatory elements and
terminator sites are publicly available [7-14].
Graphical representations have proved very useful for the
efficient interpretation of large amounts of biological data
(for example, metabolic pathway and gene regulatory net-
work visualization [15-17], transcriptome data analysis and/
or clustering [18,19]). Our group investigates metabolic path-
ways and gene regulatory networks of different Gram-
positive bacteria. For easy and rapid interpretation of tran-
scriptome data, we required software that enables us to
project this onto a linear bacterial genome map, together with
additional data (that is, terminator and regulator binding
sites). Zimmer and co-workers have previously visualized
transcriptome data (displayed as spots) in gene order [20].
However, their program does not allow the inclusion of data
on transcription regulatory and terminator sites or other cus-
tomized data. Visualization of such information would facili-
tate the interpretation of transcriptomes by displaying which
genes are coexpressed in a transcriptional unit (an operon
[21]), or are transcribed via readthrough from the neighbor-
ing gene (or genes), or lead to the formation of antisense
RNA. The possibility of adding putative binding sites for tran-
scriptional regulators onto the genome map would be a quick
and convenient way to assess the biological relevance of such
operator sites. Furthermore, visual analysis can be preferable
over a statistical (mathematical) approach, as relevant data
Published: 5 April 2004
Genome Biology 2004, 5:R37
Received: 15 January 2004
Revised: 26 February 2004
Accepted: 11 March 2004
The electronic version of this article is the complete one and can be
found online at />R37.2 Genome Biology 2004, Volume 5, Issue 5, Article R37 Baerends et al. />Genome Biology 2004, 5:R37
can easily be ignored if too high cutoff settings are applied.
We screened several powerful commercial and public-
domain software packages for transcriptome data visualiza-
tion (GenVision (DNAStar, Madison, WI), GeneSpring (Sili-
con Genetics, Redwood City, CA), Kyoto Encyclopedia of
Genes and Genomes (KEGG) [15], EcoCyc [16] and TM4
[19]), but none of these fulfilled our needs. We therefore
developed the Microsoft Windows-based program
Genome2D.
Genome2D
Genome2D was programmed in Borland Delphi 6 and com-
piled to a Microsoft Windows 9x/NT/2000/XP application.
With its graphical user interface the program is easy to use for
non-experts and is easily accessible because of its low system
requirements; it can be installed on a standard local Windows
personal computer, making it fast and safe (when confidenti-
ality is required). The object-oriented programming
environment of Delphi makes it easy to extend Genome2D.
The CADSys 4 library version 4.2 was used for two-dimen-
sional visualization of genomes. This library extends the Del-
phi vectorial graphics support to include 2D/3D CAD-like
functions in applications.
The most prominent feature of Genome2D is a drawing mod-
ule that generates comprehensive bacterial genome maps, in
a single window screen, that can include specific genetic ele-
ments such as transcription terminators or regulator binding
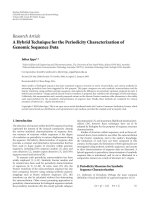
sites (Figure 1). The user can easily prepare figures for use in
printed or digital format.
Display of DNA microarray data in Genome2D is done by
coloring the selected genes using a simple input file - that is,
a tab-delimited text file with one column containing the
names of the genes to be colored (corresponding to the gene
names from the annotation file), and a second column with
the color codes (black, white, red, yellow, fuchsia, green, lime,
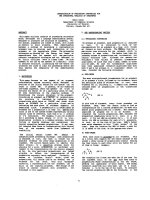
Genome2D visualization of the genomic organization of L. lactis IL1403 (GenBank annotation: AE0051576)Figure 1
Genome2D visualization of the genomic organization of L. lactis IL1403 (GenBank annotation: AE0051576). The figure displays a partial, detailed view in
which putative terminators, determined using the TIGR software package TransTerm, are shown as stem-loop structures [11,46]. Predicted promoter
elements (-35 boxes in green; -10 boxes in blue) and cre-boxes (in red) are shown. See text for more details.
Genome Biology 2004, Volume 5, Issue 5, Article R37 Baerends et al. R37.3
comment reviews reports refereed researchdeposited research interactions information
Genome Biology 2004, 5:R37
blue or aqua), or values, such as gene-expression ratios, on
the basis of which color shades are assigned. A defined
number of datasets from a complex transcriptome analysis
experiment (for example, time-course measurements) can be
loaded as separate input files, after which the data can be
shown in animation, a feature that, to our knowledge, is not
present in existing software. Clearly, the input files are not
restricted to transcriptome data, and different kinds of data-
sets can be projected, such as from proteome analysis.
An umbrella for analysis tools
In addition to its visualization capabilities, Genome2D serves
as a platform for different bioinformatics tools, such as data-
extraction and conversion algorithms, which are summarized
in Table 1. The combination of visualization and information
extraction allows subsequent rounds of analyses, and thus an
increase in data complexity, making Genome2D a powerful
tool in the investigation of bacterial genomics data, especially
from transcriptome and proteome analyses. Newly developed
algorithms or tools can be easily implemented within the
framework of the program.
Applications
Genome2D can be used for all annotated bacterial genome
sequences. In our group, Genome2D is commonly used for
the analysis of genomics data from Bacillus cereus, Bacillus
subtilis, Lactococcus lactis, Lactobacillus plantarum and
Streptococcus pneumoniae. We will illustrate the strength of
Genome2D in visualization of transcriptome data hereafter,
using the genomes of B. subtilis 168 [22] and L. lactis IL1403
[23] as examples.
The power of visualization
There are a number of benefits of visual inspection of tran-
scriptome data compared with statistical analyses, which we
will show here using published transcriptome data [24]. Most
important, visualization can help in discerning true low-level
gene activation. For instance, groES was classified as a
ComK-regulated gene, as it met the stringent cutoff set in the
analysis of Hamoen and co-workers [24]. However, groEL
failed to meet these criteria. It has been shown that groES and
groEL are part of a single operon in B. subtilis [25]. When the
transcriptome data are visualized in Genome2D, one can see
that groEL actually shows some level of activation, suggesting
that groEL and groES are indeed activated as an operon (Fig-
ure 2a). Choosing cutoff values to define the set of regulated
genes is a rather arbitrary process. Moreover, the statistical
value of expression data in transcriptome studies is based on
a limited number of data points, and it is therefore not sur-
prising that several possibly relevant genes, such as groEL,
will be missed. Another example is given in Figure 2b. yvrP,
yvrN and yvrM were found to be ComK-activated, whereas
yvrO did not meet the criteria [24]. Visualization in
Genome2D reveals that yvrO is also slightly activated, and
allows the conclusion that all four genes are likely to form a
ComK-dependent operon (Figure 2b).
Second, visualized transcriptome data can reveal putative
transcriptional readthrough. For example, in the study of
Hamoen and colleagues [24] mentioned above, thresholds of
significance were partly based on the prior knowledge that
limited readthrough from the comF operon occurs into the
yvyF, flgM and yvyG genes [26]. This becomes apparent also
in the Genome2D visualization of the data from Hamoen and
colleagues [24]: the comF operon and downstream-located
genes show differential levels of ComK-induction (Figure 2c).
Extending this notion, one can predict that the reported
ComK-dependent activation of spoIIB/maf/ysxA (radC) and
yqzE is due to readthrough from comC and the comG operon,
respectively (Figure 2d) [24].
Table 1
Features of Genome2D*
Menu Description
File Various input files (for example, FastA, GenBank, Glimmer, Paradox) can be loaded into Genome2D; contains commands to
handle the program
Blast Window to perform blast searches on a local system or at NCBI and handle blast results (data extraction)
Search Algorithms to make a weight matrix (consensus sequence/motif); use weight matrix or input motif to screen loaded genome
(see Example analysis: CcpA regulon in L. lactis)
Drawing Drawing of whole genome on linear map including additional information (promoter sites, terminators, regulator binding
sites). Individual genes can be colored (manual selection). Changes in gene expression (multiple datasets in animation) are
indicated by variation in color or number (see Application example: ComK regulon in B. subtilis)
Tools Algorithms for analysis of genomic DNA, randomization (statistical analysis) and extraction of coding or noncoding regions
Boxes Algorithms to analyze operons, upstream regions, box sequences and promoters. Custom adaptation of these algorithms is
easily implemented (see example of K-box analyses [24])
Reformatting Algorithms to convert files to another format
Proteomics Trypsin digestion on a database of proteins
*Online help can be obtained from [45].
R37.4 Genome Biology 2004, Volume 5, Issue 5, Article R37 Baerends et al. />Genome Biology 2004, 5:R37
Third, it has been reported that the use of double-stranded
amplicons in DNA array studies might lead to the detection of
antisense RNA, the biological significance of which is unclear
[24]. Genome2D helps in the identification of putative anti-
sense RNA detection by showing whether activated genes are
located in reverse orientation downstream of activated genes.
In the case of comE, it is known that the comER gene is not
transcribed during competence [27]. However, in several
array studies this gene appeared to be strongly activated by
ComK [24,28,29]. From Figure 2e, it is apparent that this
activation is due to the hybridization of antisense mRNA.
Similarly, the observed expression of yhxD and several genes
from the yck/nucA-nin/tlpC area may be instances of anti-
sense RNA detection (Figure 2f). These observations cannot
be made by normal statistical analyses without visual
inspection.
Data extraction and analysis
To our knowledge no software is available in the public
domain that allows information extraction and analysis in the
way Genome2D does. To correlate expression with the activ-
ity of specific transcription factors more quantitatively, we
incorporated several algorithms into Genome2D. The type of
analyses that can be performed with these algorithms are
exemplified below, using the analysis of the ComK-regulon in
B. subtilis and the in silico prediction of the CcpA-regulon of
L. lactis.
Hamoen and colleagues [24] used Genome2D to correlate the
occurrence of ComK-binding sites (K-boxes) to ComK-
dependent expression of genes, with the aim of testing
whether the presence of a K-box upstream of a gene can be
used to predict ComK-activation. They assigned genes to
putative operons using a widely used algorithm [30] incorpo-
rated into Genome2D ('Add First Gene of Operon to Gene
List'). Furthermore, they identified all K-boxes in the B. sub-
tilis genome (Box searches are available through the Search
menu) and located the closest upstream box for all genes and
operons ('Add Nearest Box to Gene List'). Finally, the pro-
gram is able to link predicted binding sites to the genes
located closest to the box ('Add Nearest Gene to Boxlist').
Using these and additional algorithms, the authors showed
that the predictive value of a K-box can be significantly
improved by taking into account genome organization, addi-
tional ComK-binding motifs, and binding sites for RNA
polymerase [24].
Prediction of the CcpA regulon in L. lactis
As is the case in other bacteria, many L. lactis ssp. lactis
IL1403 genes are of unknown function [23,31]. Prediction of
gene regulation can implicate unknown proteins in certain
cellular processes and, by directing genetics approaches, can
help to assign functions. This is illustrated by the prediction
of the CcpA-regulon (sugar catabolism control) in L. lactis
IL1403 using Genome2D. We searched for and visualized
putative CcpA-binding sites and promoter elements in the
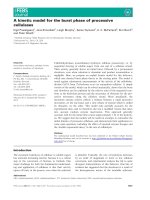
Demonstration of the power of visualization in transcriptome analysesFigure 2
Demonstration of the power of visualization in transcriptome analyses. The dataset used is from Hamoen and colleagues [24]. The strength of up- or
downregulation is depicted by the intensity of the color. Stem-loop structures indicate annotated terminators. (a,b) Probable cases of low-level activation.
Genes are colored on the basis of expression ratios from DNA macroarray experiments [24], without applying a stringent cutoff. Red shades indicate
ComK-dependent activation, whereas green shows downregulation. Gray shades indicate ratios of around 1. Stem-loop structures are used to depict
annotated terminators. K-boxes are shown by vertical red lines. (c,d) Putative cases of transcriptional readthrough. Red shades indicate significant ComK-
dependent expression. K-boxes are depicted by vertical green lines. Gray genes are not significantly ComK-dependent. (e,f) Probable cases in which
antisense RNA has a role (colors and symbols identical to (c) and (d)).
ydiJ
ydiL
ydiK
groES
groEL
yvyG
flgM
yvyF
comFC
comFB
comFA
yviA
flgK
yqeN
comEC
comEB
comEA
rpsT
comER
yqeM
yhzC
com
K
yhxD
yhjA
yhxC
yhjB
yckA
yckC
yckE
nin
yciC
nucA
tlpC
yckB
yckD
yckF
yckG
yckH
yvrL
yvrM
yvrN
yvrO
oxdC
yvrP
fhuC
ysxA
maf
spoIIB
comC
mreB
folC
yqzE
comGE
comGG
yqzG
yqxL
comGF
comGC
comGB
comGA
comGD
(a) (b)
(c) (d)
(f)(e)
Genome Biology 2004, Volume 5, Issue 5, Article R37 Baerends et al. R37.5
comment reviews reports refereed researchdeposited research interactions information
Genome Biology 2004, 5:R37
genome of L. lactis. Using the search-module in Genome2D
(<Search>, 'Make Trained Set') and a list of 36 catabolite-
responsive element (cre-box) sequences from several Gram-
positive bacteria (see Additional data file 1), a weight matrix
[32] was made that generated the consensus sequence
ATGWAARCGTTTWCA (where W represents A or T, and R
represents A or G) (see Additional data file 2). Subsequent
screening (<Search>, 'Search Trained Set') for this consen-
sus sequence, with an arbitrary cutoff of 8 (a perfect match
would give a score of 10.8 with our weight matrix), identified
1,807 putative cre-boxes in the genome of L. lactis IL1403.
Around 43% of these boxes are located in intergenic regions.
As CcpA can act as a repressor or activator depending on the
position of a cre-box relative to the RNA polymerase binding
site [33], consensus -35 and -10 promoter element positions
[34] of genes were predicted in the genome of L. lactis IL1403
using the MEME motif search routine [35] and Genome2D
(A.L. Zomer, G. Buist, J.K. and O.P.K, unpublished data). The
prediction was performed on intergenic regions from the L.
lactis IL1403 genome, the primary location for promoter
elements, which were extracted using Genome2D. Finally, the
datasets from the cre-box and promoter element predictions
were visualized onto the linear genome map of L. lactis
IL1403 (see Figure 1 and Additional data file 3). Visual
inspection confirmed the presence of operons previously
described as regulated by CcpA [36-38]. Thirteen L. lactis
genes (out of 116 putative CcpA-regulated genes) have coun-
terparts in B. subtilis, on the basis of protein sequence com-
parisons using BLASTP (e-values were lower than 10
-49
) ([39]
and see Additional data file 4). The 13 B. subtilis genes were
among those that were recently shown to be CcpA-regulated
in B. subtilis using DNA macroarray analyses [40], indicating
that Genome2D can be used to generate relevant predictions
on gene regulation. However, we would like to emphasize that
the in silico prediction of gene regulation has to be corrobo-
rated by 'real' biological experiments, such as genome-wide
transcriptome analysis [24,41,42].
Conclusions
Our analyses of transcriptome data in relation to the activity
of specific transcription factors and their operator sites
required a more flexible genome visualization program than
is currently publicly available. We therefore developed
Genome2D, a software tool that enables visualization of tran-
scriptome data onto a linear map of an annotated bacterial
genome and at the same time highlights additional features,
such as putative regulatory sequences and terminators. The
combination of information extraction and visualization
facilitates rapid, easy and intuitive analysis of genomics data,
and in our research group Genome2D proved to be of great
assistance in the study of transcriptome data. New algorithms
can be rapidly implemented in the Genome2D program menu
structure. Regular updates of Genome2D will be available via
the Internet [43]. Because of the exponential increase of pub-
licly available bacterial genome sequences and large-scale
experiments, tools like Genome2D will become indispensable
for the interpretation of complex datasets, such as those from
transcriptome and proteome studies.
Additional data files
The following additional data are available with the online
version of this article: a list of cre-box sequences found in
Gram-positive bacteria (Additional data file 1); a screen dump
from Genome2D showing the cre-box weight matrix (Addi-
tional data file 2); a Genome2D input (tab-delimited text) file
with the coordinates of the identified cre-boxes and promoter
elements in the genome of L. lactis IL1403 (color file) (Addi-
tional data file 3); a table of cre-boxes identified in promoters
of genes in the L. lactis IL1403 genome (Additional data file
4). All additional data files can also be obtained from [44].
Additional data file 1A list of cre-box sequences found in Gram-positive bacteriaA list of cre-box sequences found in Gram-positive bacteriaClick here for additional data fileAdditional data file 2A screen dump from Genome2D showing the cre-box weight matrixA screen dump from Genome2D showing the cre-box weight matrixClick here for additional data fileAdditional data file 3A Genome2D input (tab-delimited text) file with the coordinates of the identified cre-boxes and promoter elements in the genome of L. lactis IL1403A Genome2D input (tab-delimited text) file with the coordinates of the identified cre-boxes and promoter elements in the genome of L. lactis IL1403Click here for additional data fileAdditional data file 4A table of cre-boxes identified in promoters of genes in the L. lactis IL1403 genomeA table of cre-boxes identified in promoters of genes in the L. lactis IL1403 genomeClick here for additional data file
Acknowledgements
The authors acknowledge Piero Valagussa for development and distribution
of CADSys 4 library version 4.2 and thank Aldert Zomer for performing the
MEME-search. They are also much obliged to the members of the Molecu-
lar Genetics group for their valuable comments and suggestions to improve
the program.
References
1. Doolittle RF: Microbial genomes multiply. Nature 2002,
416:697-700.
2. Gold Genomes Online Database: Prokaryotic Ongoing
Genome Projects [ />index.cgi?want=Prokaryotic+Ongoing+Genomes]
3. DeRisi JL, Iyer VR, Brown PO: Exploring the metabolic and
genetic control of gene expression on a genomic scale. Science
1997, 278:680-686.
4. Lucchini S, Thompson A, Hinton JCD: Microarrays for
microbiologists. Microbiology 2001, 147:1403-1414.
5. Wyrick JJ, Young RA: Deciphering gene expression regulatory
networks. Curr Opin Genet Dev 2002, 12:130-136.
6. Conway T, Schoolnik GK: Microarray expression profiling: cap-
turing a genome-wide portrait of the transcriptome. Mol
Microbiol 2003, 47:879-889.
7. Kielbasa SM, Korbel JO, Beule D, Schuchhardt J, Herzel H: Combin-
ing frequency and positional information to predict tran-
scription factor binding sites. Bioinformatics 2001, 17:1019-1026.
8. Suzek BE, Ermolaeva MD, Schreiber M, Salzberg SL: A probabilistic
method for identifying start codons in bacterial genomes. Bio-
informatics 2001, 17:1123-1130.
9. Sabatti C, Rohlin L, Oh M-K, Liao JC: Co-expression pattern from
DNA microarray experiments as a tool for operon
prediction. Nucleic Acids Res 2002, 30:2886-2893.
10. Bussemaker HJ, Li H, Siggia ED: Regulatory element detection
using correlation with expression. Nat Genet 2001, 27:167-171.
11. Ermolaeva MD, Khalek HG, White O, Smith HO, Salzberg SL: Pre-
diction of transcription terminators in bacterial genomes. J
Mol Biol 2000, 301:27-33.
12. Snel B, Lehmann G, Bork P, Huynen MA: STRING: a web-server
to retrieve and display the repeatedly occurring neighbour-
hood of a gene. Nucleic Acids Res 2000, 28:3442-3444.
13. Zheng Y, Szustakowski JD, Fortnow L, Roberts RJ, Kasif S: Compu-
tational identification of operons in microbial genomes.
Genome Res 2002, 12:1221-1230.
14. Eskin E, Keich U, Gelfand MS, Pevzner PA: Genome-wide analysis
of bacterial promoter regions. Pac Symp Biocomput 2003:29-40.
15. Kanehisa M, Goto S, Kawashima S, Nakaya A: The KEGG data-
bases at GenomeNet. Nucleic Acids Res 2002, 30:42-46.
16. Karp PD, Riley M, Paley SM, Pellegrini-Toole A: The MetaCyc
Database. Nucleic Acids Res 2002, 30:59-61.
17. Salgado H, Santos-Zavaleta A, Gama-Castro S, Millan-Zarate D,
R37.6 Genome Biology 2004, Volume 5, Issue 5, Article R37 Baerends et al. />Genome Biology 2004, 5:R37
Diaz-Peredo E, Sanchez-Solano F, Perez-Rueda E, Bonavides-Martinez
C, Collado-Vides J: RegulonDB (Version 3.2): transcriptome
regulation and operon organization in Escherichia coli K-12.
Nucleic Acids Res 2001, 29:72-74.
18. Eisen MB, Spellman PT, Brown PO, Botstein D: Clustering analysis
and display of genome-wide expression patterns. Proc Natl
Acad Sci USA 1998, 95:14863-14868.
19. Saeed AI, Sharov V, White J, Li J, Liang W, Bhagabati N, Braisted J,
Klapa M, Currier T, Thiagarajan M et al.: TM4: a free, open-source
system for microarray data management and analysis. Bio-
techniques 2003, 34:374-378.
20. Zimmer DP, Soupene E, Lee HL, Wendish VF, Khodursky AB, Peter
BJ, Bender RA, Kustu S: Nitrogen regulatory protein C-control-
led genes of Escherichia coli: scavenging as a defense against
nitrogen limitation. Proc Natl Acad Sci USA 2000, 97:14674-14679.
21. Jacob F, Monod J: Genetic regulatory mechanisms in the syn-
thesis of proteins. J Mol Biol 1961, 3:318-356.
22. Kunst F, Ogasawara N, Moszer I, Albertini AM, Alloni G, Azevedo V,
Bertero MG, Bessieres P, Bolotin A, Borchert S et al.: The com-
plete genome sequence of the Gram-positive bacterium
Bacillus subtilis. Nature 1997, 390:249-256.
23. Bolotin A, Wincker P, Mauger S, Jaillon O, Malarme K, Weissenbach
J, Ehrlich SD, Sorokin A: The complete genome sequence of the
lactic acid bacterium Lactococcus lactis ssp. lactis IL1403.
Genome Res 2001, 11:731-753.
24. Hamoen LW, Smits WK, de Jong A, Holsappel S, Kuipers OP:
Improving the predictive value of the competence transcrip-
tion factor (ComK) binding site in Bacillus subtilis using a
genomic approach. Nucleic Acids Res 2002, 30:5517-5528.
25. Schmidt A, Schiesswohl M, Volker U, Hecker M, Schumann W: Clon-
ing, sequencing, mapping, and transcriptional analysis of the
groESL operon from Bacillus subtilis. J Bacteriol 1992,
174:3993-3999.
26. Liu J, Zuber P: A molecular switch controlling competence and
motility: competence regulatory factors ComS, MecA, and
ComK control sigma D-dependent gene expression in Bacil-
lus subtilis. J Bacteriol 1998, 180:4243-4251.
27. Hahn J, Inamine G, Kozlov Y, Dubnau D: Characterization of
comE, a late competence operon of Bacillus subtilis required
for the binding and uptake of transforming DNA. Mol Microbiol
1993, 10:99-111.
28. Ogura M, Yamaguchi H, Kobayashi K, Ogasawara N, Fujita Y, Tanaka
T: Whole-genome analysis of genes regulated by the Bacillus
subtilis competence transcription factor ComK. J Bacteriol
2002, 184:2344-2351.
29. Berka RM, Hahn J, Albano M, Draskovic I, Persuh M, Cui X, Sloma A,
Widner WD, Dubnau D: Microarray analysis of the Bacillus sub-
tilis K-state: genome-wide expression changes dependent on
ComK. Mol Microbiol 2002, 43:1331-1345.
30. Rocha EPC, Danchin A: Essentiality, not expressiveness, drives
gene-strand bias in bacteria. Nat Genet 2003, 34:377-378.
31. Guédon E, Jamet E, Renault P: Gene regulation in Lactococcus
lactis: gap between predicted and characterized regulators.
Antonie van Leeuwenhoek 2002, 82:93-112.
32. Staden R: Computer methods to locate signals in nucleic acid
sequences. Nucleic Acids Res 1984, 12:505-519.
33. Henkin TM: The role of the CcpA transcriptional regulator in
carbon metabolism in Bacillus subtilis. FEMS Microbiol Lett 1996,
135:9-15.
34. van der Guchte M, Kok J, Venema G: Gene expression in Lacto-
coccus lactis. FEMS Microbiol Rev 1992, 8:73-92.
35. Bailey TL, Elkan C: The value of prior knowledge in discovering
motifs with MEME. Proc Int Conf Intell Syst Mol Biol 1995, 3:21-29.
36. Luesink EJ, van Herpen REMA, Grossiord BP, Kuipers OP, de Vos
WM: Transcriptional activation of the glycolytic las operon
and catabolite repression of the gal operon in Lactococcus
lactis are mediated by the catabolite control protein CcpA.
Mol Microbiol 1998, 30:789-798.
37. Even S, Lindley ND, Cocaign-Bousquet M: Molecular physiology of
sugar catabolism in Lactococcus lactis IL1403. J Bacteriol 2001,
183:3817-3824.
38. Gaudu P, Lamberet G, Poncet S, Gruss A: CcpA regulation of aer-
obic and respiration growth in Lactococcus lactis. Mol Microbiol
2003, 50:183-192.
39. Altschul SF, Gish W, Miller W, Myers EW, Lipman DJ: Basic local
alignment search tool. J Mol Biol 1990, 215:403-410.
40. Moreno MS, Schneider BL, Maile RR, Weyler W, Saier MH Jr: Cat-
abolite repression by the CcpA protein in Bacillus subtilis:
novel modes of regulation by whole-genome analyses. Mol
Microbiol 2001, 39:1366-1381.
41. Bulyk ML, McGuire AM, Masuda N, Church GM: A motif co-occur-
rence approach for genome-wide prediction of transcrip-
tion-factor-binding sites in Escherichia coli. Genome Res 2004,
14:201-208.
42. Bulyk ML: Computational prediction of transcription-factor
binding site locations. Genome Biol 2003, 5:201.
43. Molecular Genetics software [ />research/molgensoftware.php]
44. Genome2D: supplementary data [ />lication/genome2d_data]
45. Genome2D: online help - home [ />genome2d]
46. TIGR Software TransTerm, Lactococcus lactis subsp. lactis
Rho-Independent Terminators [ />TransTermResults/ntll01.html]