Báo cáo y học: "Synorth: exploring the evolution of synteny and long-range regulatory interactions in vertebrate genomes." potx
Bạn đang xem bản rút gọn của tài liệu. Xem và tải ngay bản đầy đủ của tài liệu tại đây (1.34 MB, 14 trang )
Genome Biology 2009, 10:R86
Open Access
2009Donget al.Volume 10, Issue 8, Article R86
Software
Synorth: exploring the evolution of synteny and long-range
regulatory interactions in vertebrate genomes
Xianjun Dong
*†
, David Fredman
*‡
and Boris Lenhard
*†
Addresses:
*
Computational Biology Unit, Bergen Center for Computational Science, University of Bergen, Thormøhlensgate 55, N-5008
Bergen, Norway.
†
Sars Centre for Marine Molecular Biology, University of Bergen, Thormøhlensgate 55, N-5008 Bergen, Norway.
‡
Current
address: Department for Molecular Evolution and Development, Centre for Organismal Systems Biology, Faculty of Life Sciences, University
of Vienna, Althanstrasse, 1090 Wien, Austria.
Correspondence: Boris Lenhard. Email:
© 2009 Dong et al.; licensee BioMed Central Ltd.
This is an open access article distributed under the terms of the Creative Commons Attribution License ( which
permits unrestricted use, distribution, and reproduction in any medium, provided the original work is properly cited
Gene regulatory block analysis<p>Synorth is a web resource for exploring and categorizing the syntenic relationships in gene regulatory blocks across multiple genomes.</p>
Abstract
Genomic regulatory blocks are chromosomal regions spanned by long clusters of highly conserved
noncoding elements devoted to long-range regulation of developmental genes, often immobilizing
other, unrelated genes into long-lasting syntenic arrangements. Synorth />is a web resource for exploring and categorizing the syntenic relationships in genomic regulatory
blocks across multiple genomes, tracing their evolutionary fate after teleost whole genome
duplication at the level of genomic regulatory block loci, individual genes, and their phylogenetic
context.
Rationale
A genomic regulatory block (GRB) is a chromosomal region
spanned by an array of highly conserved noncoding elements
(HCNEs; for other names of these elements see [1]). The span
of HCNEs defines the extent of the block: in mammalian
genomes the mean size of GRBs is estimated to be 1.4 Mb
(median 1 Mb) [2]. HCNEs typically cluster around one par-
ticular gene in the region, most often encoding a transcription
factor involved in the regulation of embryonic development
and differentiation, referred to as the GRB target gene. Many
HCNEs have been shown to act as long-range enhancers of
the target gene [3-7], regardless of whether they are found
within the target gene, close to it, or hundreds of kilobases
away in either direction. In most cases, the target gene itself
spans only a small fraction of the total GRB size. Often, much
of the rest of the GRB consists of HCNE-spanned gene-free
regions called gene deserts [8]. However, many GRBs also
contain one or more unrelated genes, referred to as the GRB
bystander genes, which often contain HCNEs in their introns
and beyond but do not seem to be regulated by them. Instead,
many of those HCNEs were shown to regulate the GRB target
gene [9]. As enhancers, HCNEs must be in cis to (that is,
within the response distance of) their target gene. As long as
the function of the target gene depends on the regulatory
inputs from HCNEs located within or near bystander genes,
those genes are also locked into cis arrangement with the tar-
get gene. Indeed, we have shown that GRBs form the most
ancient and most resilient regions of conserved gene order
(synteny) across vertebrates [9], and across dipteran insects
[10], as a result of the selective pressure that keeps the
HCNEs in cis with the target gene. The conservation of syn-
teny with near-perfect colinearity of HCNEs at the locus is an
important defining feature of GRBs.
The key evolutionary mechanism that has the ability to affect
the synteny and integrity of a GRB and its gene content is
whole genome duplication (WGD). Immediately after WGD,
the affected organism is a tetraploid - all its genes (and GRBs)
Published: 21 August 2009
Genome Biology 2009, 10:R86 (doi:10.1186/gb-2009-10-8-r86)
Received: 29 March 2009
Revised: 22 June 2009
Accepted: 21 August 2009
The electronic version of this article is the complete one and can be
found online at /> Genome Biology 2009, Volume 10, Issue 8, Article R86 Dong et al. R86.2
Genome Biology 2009, 10:R86
are present in two copies per gamete. This duplicated genome
content is highly redundant, so a WGD is followed by an
extended evolutionary period during which one copy of most
genes will become inactivated and disappear by neutral muta-
tion - a process known as re-diploidization. A smaller fraction
of the genes will remain in two copies that over time will
either each specialize to perform complementary subsets of
functions of the ancestral gene (subfunctionalization), or one
will acquire a completely new function (neofunctionalization)
[11].
Since each GRB (with the full set of target genes, bystander
genes and HCNEs) is present in two copies following WGD,
we say each has a 1-to-2 orthologous relationship with the
ancestral (pre-WGD) genome. Over time, the aforementioned
processes lead to inactivation of one copy of some of the GRBs
(re-diploidization), reverting the orthology relationship with
the ancestral genome to the 1-to-1 type. How we define the
fate of a GRB is tied to the fate of its target gene(s): if the tar-
get gene survives in two copies, we consider that the GRB has
survived in two copies ('1-to-2 scenario'); if, on the other
hand, one copy of the target gene becomes inactivated, the
HCNEs on that locus lose the gene on which they act and, as
such, become non-functional, are no longer under selection,
and are subsequently lost. This leaves the other GRB as the
only copy in the genome ('1-to-1 scenario').
The bystander genes could also remain in two copies (1-to-2
orthology) or re-diploidize to a single copy (1-to-1 orthology).
However, it is important to note that the fate and the final
number of copies of each bystander gene can be, and often is,
different from that of the target gene, and that the fates of dif-
ferent bystander genes in a single GRB are also different from
each other.
Given the apparent independence of re-diploidization and/or
subfunctionalization processes for each of the genes in a GRB,
studying the number of copies of each gene, their location in
the genome and the location of HCNEs can reveal many
details about the evolutionary history of each GRB. For exam-
ple, in 1-to-2 scenarios, the distribution of HCNEs between
the two loci can help in the characterization of regulatory sub-
functionalization of the two copies of the target gene [12]. As
a special form of subfunctionalization, in the duplicated state
there is a 'window of opportunity' in which it is allowed for
one part of the HCNE array to break off from one copy of the
GRB, as long as the equivalent part of the array is still in cis to
the other copy of the target gene (for an example and detailed
explanation, see Figure 7 in Kikuta et al. [9]). Additionally,
the syntenic relationship between HCNEs and genes, and
their locations after WGD, can reveal different mechanisms
by which bystander genes escape synteny lock-in with the tar-
get genes. In ambiguous cases, this approach can help deter-
mine the actual target gene and infer boundaries between
adjacent GRBs.
It is now established that there have been several WGDs in
the course of evolution of chordates (Figure 1). The first round
of WGD (the 1R WGD) is thought to have happened at the
root of vertebrates around 550 Myr ago [13], after the separa-
tion from lancelets, hemichordates and urochordates. The 2R
WGD took place at the root of jawed vertebrates. This is the
last WGD in the human lineage, and many GRBs and their
target genes were duplicated on that occasion (examples of
duplicates from that event that remain in two subfunctional-
ized copies to this day are SOX2/3, MEIS1/2, BARHL1/2,
PAX4/6). Extant jawless vertebrates (lampreys and hagfish)
did not undergo this duplication, and their genomes will be
used to compare the fates of GRBs after the 2R WGD once
reasonably complete genome assemblies become available.
The 3R WGD occurred 300 to 450 Myr ago, which is close to
the root of today's teleost fish [14]. This is the WGD event that
is the focus of the resource presented in this paper. Four tele-
ost genomes have been assembled at the chromosome level
(zebrafish, medaka, stickleback, tetraodon), and one at the
level of large scaffolds (fugu). Since the genomes of other
jawed vertebrates (including all tetrapods) did not undergo
this duplication, they can be used with reasonable confidence
as a reference for comparison that reflects the GRB structure
of the last common ancestor before the 3R WGD. Indeed,
there are almost no gross differences in general structure and
gene content of the GRBs across tetrapod vertebrates, and
any of their genomes may be used as a model for the ancestral
structure of the GRB [15]. The 4R WGD might have happened
as recently as 25 Myr ago in the ancestor of today's salmonid
fish [16]. Since it was recent, the re-diploidization has not
progressed far and the genomes of salmonid fish are still
largely tetraploid [17].
There are two main tasks important for the interpretation of
the impact of WGD and subsequent processes on the struc-
ture of GRBs: correct estimation of the extent of the GRB and
distinguishing between the target gene(s) and the bystander
genes in a GRB. With regard to the first, a GRB is defined
physically by the extent of long-range regulatory elements
around its target gene. Therefore, the combined synteny of
HCNEs and the intertwined genes defines a minimal span of
the GRB (see below for an approach we took to determine it
genome-wide). The approach is not bulletproof as genes out-
side GRBs as well as multiple GRBs can still be syntenic by
chance, and often are in more closely related species. In our
experience, however, synteny estimation between human and
zebrafish is a good conservative estimate of a GRB's span [15],
even though a GRB may 'grow' by recruiting new regulatory
elements at its edges after the separation of lineages. The new
elements, however, do not help in elucidating GRB fate after
WGD.
While there is no automated, failsafe method for distinguish-
ing between the target gene(s) and the bystander genes in a
GRB, there is a growing list of features of target genes that set
them apart from bystander genes and other genes in the
Genome Biology 2009, Volume 10, Issue 8, Article R86 Dong et al. R86.3
Genome Biology 2009, 10:R86
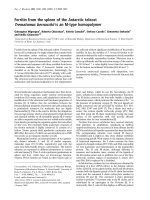
Species available for comparison in Synorth and their associated species treeFigure 1
Species available for comparison in Synorth and their associated species tree. (a) Phylogenetic tree based on data from [14,50,70-72]. The red dots
indicate the second-round (2R) and third-round (3R) WGD events [72]. The blue dot indicates the genome compaction in the pufferfish lineage beginning
20 to 30 Myr ago [70]. The species shown in the tree are: bichir (Polypterus senegalus), zebrafish (Danio rerio), fugu (Takifugu rubripes), Tetraodon (Tetraodon
nigroviridis), stickleback (Gasterosteus aculeatus), medaka (Oryzias latipes), frog (Xenopus tropicalis), chicken (Gallus gallus), mouse (Mus musculus), and human
(Homo sapiens). Sources of fish images: Byrappa Venkatesh (fugu), Manfred Schartl (medaka), Wikipedia (zebrafish, tetraodon), Kraft CE et al. [73]
(stickleback). (b) Reference and comparison species available in Synorth. Shaded boxes correspond to the reference genomes in Synorth. Connecting lines
indicate genome pairs between which GRBs are available to check in the browser. Dashed lines indicate the genome comparison to be offered in the near
future. The following genome assemblies underlie the current data sets: human NCBI 36, zebrafish Zv7 (The Wellcome Trust Sanger Institute), fugu v4.0
[74], tetraodon V7 [75], stickleback v1.0 (The Broad Institute), medaka v1.0 [51].
zebrafish
fu
g
u
tetradon
medaka
stickleback
human
mouse
chicken
fro
g
60-80 Myr110-160 Myr~250 Myr~450 Myr now
Mouse
Frog
Chicken
Bichir
zebrafish
fugu
tetradon
medaka
stickleback
human
3R WGD
(FSGD)
2R WGD
(b)
(a)
340 Myr 310 Myr
Genome
compaction
20-30 Myr
Genome Biology 2009, Volume 10, Issue 8, Article R86 Dong et al. R86.4
Genome Biology 2009, 10:R86
genome. These are: trans-dev function (most are transcrip-
tion factors or co-factors, or developmental cell adhesion pro-
teins); complex spatiotemporal expression pattern; long and/
or multiple CpG islands; and distinct chromatin marks. For
more details about each of these features of GRB target genes,
see Akalin et al. [2] and Fredman et al. [18].
For an in-depth understanding of the concepts presented so
far, the reader is advised to consult references
[1,2,9,10,15,19], where detailed explanations and additional
examples can be found. We have also prepared an animated
introduction to the basic concepts, accessible from the Syn-
orth home page.
With the emerging understanding of the GRB model, it has
become clear that their study is inextricably bound to the
WGD events in Metazoa, and that the most illuminating
approach to studying their evolutionary history and the rela-
tionship between genes and their regulatory inputs should
start with the analysis of syntenic relationships and re-dip-
loidization scenarios following WGDs. A suitable tool for this
type of analysis should enable the study of the evolutionary
dynamics of HCNEs and gene content within GRBs, in the
context of their genomic neighborhood and syntenic relation-
ships. Here, we describe Synorth ("Syntenic orthologs")
[20], a web-based application consisting of: a genome locus
browser where all reference genome genes and HCNE loca-
tions in any given synteny block are displayed in relation to
orthologous loci across multiple vertebrate genomes, with a
number of adjustable parameters; a table browser that lists
the orthologous and syntenic relationships for each
bystander-target pair in a GRB, for each teleost fish species
relative to human as a reference tetrapod genome; and a tree
browser in which all genes in the GRB are projected onto an
ideal gene tree that assumes a WGD event in teleost fish. We
demonstrate how Synorth can be used to discover and visual-
ize orthologous relationships, duplication and maintained
synteny, and to trace genome rearrangement following the
WGD. We anticipate that Synorth will also be useful for
improving gene annotation and to visually detect genome
assembly errors.
A comprehensive ortholog dataset
To be able to study the evolution of HCNEs and gene arrange-
ments in a genomic regulatory block context, we must first
have a comprehensive and accurate annotation of gene
orthology. We needed a comprehensive ortholog set that
would be suitable for study of the evolutionary dynamics of
genomic regulatory blocks, while considering a long-range
regulatory model with gene loss, as well as difference in evo-
lutionary rates among species [21]. This required an exten-
sion of existing methods for orthology detection to increase
the coverage and assignment of mis- and un-annotated genes
in incompletely annotated teleost genomes. To this end, we
developed a strategy that combined Ensembl ortholog genes
with ortholog genes predicted by an exon alignment pipeline
(Figure 2a), and an examination of conserved synteny. Since
we gave precedence to the Ensembl ortholog set, an ortholog
predicted by exon alignment was used only if a gene did not
have any orthologous genes in Ensembl (Additional data file
1).
In the final implementation, Synorth uses the Ensembl
ortholog set, with two additional options that can be turned
on or off: inclusion of additional orthologs predicted by our
exon alignment pipeline; and exclusion of out-paralogs (par-
alogs whose origin predates the last common ancestor of the
compared set of species; Additional data file 1). Inclusion of
additional predicted orthologs improved coverage by provid-
ing orthologs for 424 out of 1,982 putative bystander genes in
our initial GRB set that were missing in the Ensembl ortholog
set (Table 1). By default, Synorth includes orthologs predicted
by exon alignment and excludes out-paralogs (Additional
data file 2).
Exploring genomic regulatory block evolution
with Synorth
Users can explore GRB content and evolutionary rearrange-
ment in three different modes (Genome locus browser, Table
browser, and Tree browser) through the links in the top-left
corner of the Synorth start page [20]. The Genome locus
browser shows GRB genes and HCNEs in the reference
genome in a locus-centered genome browser fashion, and
additionally shows multiple tracks for each compared species
(Figure 2b). The Table browser describes the evolutionary
fate of each bystander gene in the GRB using the scenario
code we developed for this purpose (Figure 2c). The Tree
browser shows GRB rearrangement(s) among species in the
context of an ideal gene tree in a simplified cartoon form (Fig-
ure 2d). Synorth currently supports analysis of GRBs in
human and fish genomes (zebrafish, fugu, tetraodon, stickle-
back and medaka; Figure 1b). We aim to expand this list in the
future to study other perspectives or instances of WGDs, after
the suitable genome assemblies become available. The first
on the list is the upcoming Zv8 zebrafish genome assembly as
a reference genome, followed by the lamprey genome for
studying the 2R WGD.
Genome locus browser
For any supported input query (gene symbol or reference
(human) genomic location), the browser shows the region
containing all synteny blocks overlapping with the input
query (Figure 2a) and their orthologous content in the com-
pared genomes, one genome per row. Each orthologous gene
and HCNE is horizontally aligned to its human ortholog for
quick visual assessment of retention, rearrangement and loss.
The sizes of genes in the compared (fish) genomes are not
drawn to scale, but are reshaped to keep the same spacing and
length as in the reference genome and so align vertically with
them (Figure 2b). Clicking on the gene models brings up gene
Genome Biology 2009, Volume 10, Issue 8, Article R86 Dong et al. R86.5
Genome Biology 2009, 10:R86
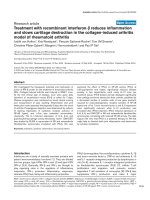
Synorth pipeline and three data viewsFigure 2
Synorth pipeline and three data views. (a) The Synorth data/analysis pipeline. (b) The Synorth genome locus browser: (A) navigation bar; (B) search field;
(C) external link to other browsers (Ancora, UCSC Genome Browser, Ensembl and Vista) for the same region; (D) GRB genomic coordinates - the
coordinates are the union of all synteny regions overlapping with the query gene - if no overlapping synteny region is found, no region will be shown; (E)
reference species track; (F) track(s) of compared species - in each track, the species name and the sub-tracks for all synteny regions are shown; (G)
browser legend; (H) chromosome color key for the compared species. For more details, see the description in the Help page of the Synorth website [20].
(c) Synorth table browser (d) Synorth tree browser.
Genome Biology 2009, Volume 10, Issue 8, Article R86 Dong et al. R86.6
Genome Biology 2009, 10:R86
information in the UCSC Genome Browser [22]. By default,
the orthologs are colored by the chromosome on which they
reside in the other genome. If the GRB content maps to more
than one chromosome in the compared genome, each chro-
mosome will be shown on a separate track, and the tracks are
ordered by the number of orthologous genes they contain. To
visualize the tendency of HCNE arrays to correspond to large
synteny blocks, we also included tracks showing HCNEs
between the reference genome and the compared genome
(using the HCNE data from Ancora [15], with window size 50
bp and similarity threshold 70% for mammals:teleosts),
which are displayed below the genes in each track. The
browser also provides links that bring up the same synteny
region in Ensembl [23], UCSC [22], Ancora [15] and VISTA
[24] genome browsers.
Table browser
A GRB target gene, which is often a developmental transcrip-
tion factor, is spanned by a synteny-maintaining array of
HCNEs [25], many of which were shown to act as the gene's
regulatory inputs [6,26], often intertwined with other, unre-
lated (bystander) genes [9]. To trace the fate of genes in GRBs
after WGD relative to the reference genome (which we
assumed to contain an ancestral arrangement of genes in
GRBs [1] - see Rationale), we need to define the orthologous
mapping positions of bystander genes in relation to the target
gene. Here we define a code for each bystander-target gene
pair, which is composed of three digits 'XYZ' (Figure 3a): the
first digit of the code, X, represents the number of the target
gene orthologs in the compared species (which also means it
is a 1-to-X scenario for the GRB evolution); the second digit,
Y, is the number of the bystander gene orthologs present in
the compared species - Y can be 0 (not present in fish at all),
1 (re-diploidized bystander gene - one copy remains) or 2
(bystander gene survived in two copies); the third digit, Z,
stands for the number of the bystander gene orthologs that
are in synteny with the target gene (Z = Y). For example, code
'221' indicates that it is a 1-to-2 scenario for the target gene
(the target was retained in two copies), that the bystander
gene has also been retained in two copies in the compared
(fish) species, and that only one of the two copies of the
bystander gene is still in synteny with the corresponding copy
of the target gene in the fish genome.
The code captures the relationship of the bystander orthologs
and in-paralogs [27,28] with the corresponding target genes,
with respect to the copy number and synteny conservation. It
is important to understand that the full three-digit codes refer
to bystander genes and capture three important parameters
of their fate with respect to the ancestral GRB they were part
of. Since each target gene is, by definition, retained in the
same number of copies as its GRB, and is still contained
within all copies of the GRB, only the first digit has physical
meaning for target genes.
The Synorth table browser shows the scenario codes for all
bystander genes with respect to their target genes/GRBs in a
table format, with one column for each compared species
(Figure 2c). For each gene, a phylogenetic tree was built using
TreeBeST [29] based on the multiple alignment of orthologs
for human, mouse, chicken, frog and teleost fish. This tree
building methodology is also used in Ensembl to build the
protein family tree [23,30]. The trees can be accessed from
links in the rightmost column of the table. For comparison,
Synorth also provides the corresponding Ensembl protein
family tree and ortholog tree from TreeFam [31,32].
Table 1
Ortholog gene counts in Synorth
Count of human orthologs detected in fish
Source Zebrafish Fugu Tetraodon Stickleback Medaka
Ensembl
One2one 7,790 8,429 7,784 8,903 8,639
One2many 6,144 6,285 7,718 5,868 5,307
Many2many 2,711 1,410 1,541 1,592 1,311
Apparent_one2one (out-paralogs) 197 192 181 175 238
Total 16,842 16,316 17,224 16,538 15,495
Ensembl + Option 1 (include exonAlign predictions) 26,695 20,529 20,460 23,070 21,269
Ensembl + Option 2 (exclude out-paralogs) 16,645 16,124 17,043 16,363 15,257
Ensembl + Option 1 + Option 2 (Synorth default set) 20,036 18,427 18,094 19,449 18,236
Counts for the different ortholog classes in the Ensembl ortholog set, the Synorth exon predictions, and out-paralogs that can be excluded via
options on the Synorth preference page (Additional data file 2). Option 1 represents the inclusion of additional ortholog predictions from our
exonAlign pipeline. Option 2 represents the exclusion of out-paralogs. The exonAlign ortholog prediction pipeline and the method used to exclude
out-paralogs are described in Additional data file 1. The Ensembl ortholog set was extracted from Ensembl Compara version 49.
Genome Biology 2009, Volume 10, Issue 8, Article R86 Dong et al. R86.7
Genome Biology 2009, 10:R86
Tree browser
The tree browser is designed to reveal the evolutionary fate of
genes at the level of the entire GRB (Figure 2d), instead of the
single gene level as in the table browser. To construct this
browser, we first projected the target gene tree (sub-tree from
the Ensembl protein family tree) onto the ideal gene tree that
includes the teleost WGD duplication. The synteny regions
overlapping with the target gene's orthologs in each fish
genome were recorded. Second, we mapped orthologs for
each bystander gene within the GRB span onto their corre-
sponding branches and levels in the ideal tree. In the ideal
gene tree, each fish species has two branches, one for each of
their duplicated gene paralogs. Each branch has two levels:
the upper level (on the guide line) contains paralogs that are
in synteny with the target genes; and the lower level (under
the guide line) contains those paralogs not in synteny with the
target genes (Figure 2d). For each bystander gene, any
ortholog that was in synteny with a target ortholog was placed
in the upper level of the same branch as the target ortholog.
For each teleost bystander gene not in synteny with (either
copy of) the target gene, we could map it to the correct branch
when one of the other teleosts had two copies of the bystander
gene, and both were in synteny with their corresponding tar-
get gene. In those cases, we compared the pairwise gene dis-
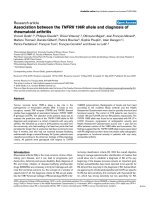
Scenario code illustration and statisticsFigure 3
Scenario code illustration and statistics. (a) Definition of scenario code. (b) Descriptive statistics of scenario codes for all bystander-target pairs in 215
curated GRBs.
20
21
22
10
11
00
1
2
1-to-2
1-to-1
two outside GRB1 in GRB, 1 outsidetwo in GRBone outside GRBone in GRB
1-to-21-to-11-to-0
1-to-2
1-to-1
1-to-21-to-11-to-0
Target gene
Bystander gene count and location relative to the GRB
Target gene
Bystander gene
Human GRB synteny blo ck
Teleost GRB synteny blo ck
Example scenario code: 211
Scenario code for bystander_gene:target_gene pair
Count for each category
(a)
(b)
0
100
200
300
400
500
600
100 110 111 120 121 122 200 210 211 220 221 222
bystander lost
Genome Biology 2009, Volume 10, Issue 8, Article R86 Dong et al. R86.8
Genome Biology 2009, 10:R86
tances as measured by branch length in the gene tree, and
defined the closer of the two genes in the other teleost as the
ortholog. The bystander gene was then placed at the lower
level of the same branch as that ortholog. The initial assump-
tion for this method is that at least one ortholog in all the
compared species is in synteny with the target gene; if neither
was, they were placed in the tree in arbitrary order.
If the mouse pointer is hovered over an underlined gene
name, a window showing the ideal gene tree for that gene
pops up. Branches for which no ortholog genes were found in
the tree are shown in gray, and are not underlined (Figure
2d). Paralogous branches of the same species are marked in
the same color. The tree on the left side is the ideal gene tree
for a perfect WGD model, which is based on the species tree
in Figure 1a.
Detecting the duplication, maintenance, and
breakup of genomic regulatory blocks
As a result of WGD in teleosts, many mammalian GRBs have
two orthologous regions in teleost genomes. Synorth makes it
straightforward to visualize such mammal:teleost GRB
orthologs by querying for a gene or genome region that over-
laps with the GRB in the reference genome. For example,
when viewing a human:zebrafish GRB, the synteny block (if
any) spanning the human gene will be shown, and all its
duplicated segments (if any) will be shown in zebrafish. One
of the hallmarks of GRBs is that they are HCNE-dense regions
[9,10], and that HCNEs aid in defining the extent of synteny
across GRBs. We obtained HCNE track data from Ancora [15]
and used them in Synorth both for analysis purposes and as a
guide for visualization. By default, the browser displays tracks
with more than ten HCNEs, tracks from chromosomes con-
taining at least half of the GRB gene orthologs, tracks from
chromosomes that harbor the ortholog of a transcription fac-
tor gene in the region, and/or tracks from chromosomes that
harbor the predicted target gene. Users can choose to show/
hide each track, or use one of the preset configurations avail-
able in the preference page (Additional data file 2). Figure 2b
shows an example of the GRB for PAX6, a transcription factor
gene with important functions in development of, for exam-
ple, the eye, central nervous system and pancreas [33-35].
The GRB covers more than 2 Mb, harboring several bystander
genes and an array of regulatory HCNEs [7]. Most of the
human-zebrafish HCNEs in this region align to the ortholo-
gous loci of PAX6 on zebrafish chromosome 25 (pax6a) and
chromosome 7 (pax6b). The bystander genes in the GRB are
either present in a single copy on one of the branches (for
example, DPH4 has one ortholog on zebrafish chromosome
25, and elp4 is left only on chromosome 7) or have disap-
peared from the zebrafish genome altogether (for example,
DCDC1, which is highly expressed in human testis [36]).
Thus, the browser quickly suggests that the noncoding puta-
tive regulatory sequences have been conserved to a similar
extent at both of the duplicated pax6 loci in zebrafish, and
that the bystander genes have largely re-diploidized.
In contrast, there are other cases in which target genes and
the other GRB components (bystander genes and HCNEs)
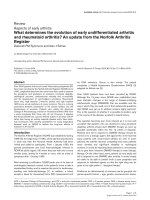
remain almost intact even after the WGD. Figure 4a shows an
example for the GRB of FOXD3. Human FOXD3, a forkhead
transcription factor gene upregulated in chronic myeloid
leukemia, Jurkat T-cell leukemia and teratocarcinoma cell
lines [37], lies within a GRB harboring a dozen other genes
and a cluster of HCNEs, all mapping to a single syntenic locus
in all teleost genomes (Figure 4a). A possible explanation for
this is that one of the two copies of the entire locus was lost
from the genome of a teleost ancestor by a large-scale chro-
mosomal deletion shortly after WGD.
There are other, more complex cases that shed further light
on the way GRBs and their components evolve. One of the
more interesting scenarios is when a part of one copy of a
duplicated GRB breaks off from its target gene. According to
the GRB model, this is generally not tolerated in the ancestral
(non-duplicated) GRB as it disconnects the target gene from
a substantial number of its long-range regulatory inputs.
However, after WGD, breaking off of a part of one GRB may
be tolerated as long as the other copy of these disconnected
regulatory inputs is still in cis to the other copy of the target
gene [9]. For example, TBX2, a T-box gene encoding a tran-
scription factor involved in the regulation of developmental
processes in human [38-40] and zebrafish [41-43], is in the
neighborhood of the gene BCAS3, and both are spanned by a
cluster of HCNEs between human and zebrafish (Figure 4b).
In zebrafish, TBX2 has two orthologous copies, tbx2a on
chromosome 5 and tbx2b on chromosome 15. The ortholog of
BCAS3 in zebrafish, bcas3, is still in synteny with tbx2b on
chromosome 15, and contains a large array of intragenic
HCNEs, with no other human:zebrafish HCNEs extending
beyond that gene in that direction of the zebrafish GRB. In
contrast, in the tbx2a zebrafish locus, only the 3' half of the
corresponding HCNE array remains, and the zebrafish
ortholog of BCAS3 itself is no longer present in that locus. The
most parsimonious explanation for this arrangement is that
there was a chromosome break somewhere in the middle of
the zebrafish BCAS3 ortholog in the tbx2a locus, leading to
the removal of the 5' part of the gene and that portion of the
intragenic HCNE array. By this rearrangement, the remain-
der of the gene was non-functionalized and degraded through
neutral evolution over time, while the intragenic HCNEs
downstream of the break remained functional in cis to the
tbx2a target gene, and were thus conserved.
Another scenario concerns GRBs with two copies of the target
gene in teleost fish, where the two copies are surrounded by
partially complementary sets of bystander genes and HCNEs.
Figure 4c shows such an example, LHX1, a LIM homeobox
transcription factor gene implicated in the development of
head, nervous and reproductive systems [44]. It is apparent
Genome Biology 2009, Volume 10, Issue 8, Article R86 Dong et al. R86.9
Genome Biology 2009, 10:R86
Using Synorth to show GRB duplication, maintenance and breakageFigure 4
Using Synorth to show GRB duplication, maintenance and breakage. (a) FOXD3 locus, (b) TBX2 locus and (c) LHX1 locus. See the text for description.
human (hg18)
zebrafish (danRer5)
chr6:16546842-17691046(-)
A U E V
medaka (oryLat1)
chr4:16718301-17382979(-)
U
E V
human (hg18)
zebrafish (danRer5)
chr15:27024621-27618657(-)
A U E V
chr5:49956411-50266525(-)
A U E V
human (hg18)
zebrafish (danRer5)
chr5:49649235-49937056(+)
A
U E V
chr15:26373448-27016876(+)
A
U E V
(a)
(b)
(c)
Genome Biology 2009, Volume 10, Issue 8, Article R86 Dong et al. R86.10
Genome Biology 2009, 10:R86
that the two zebrafish copies of the GRB harboring the LHX1
ortholog after WGD each lost alternative sets of HCNEs and
bystander genes; the copy on chromosome 15 contains a large
HCNE array and the target gene ortholog lhx1a, while the
other branch on chromosome 5 contains all the other
bystander genes, the target gene ortholog lhx1b, and very few
HCNEs at the applied threshold. This differential pattern of
HCNE retentionHCNE re broadly matches the complexity of
the expression pattern of the target gene. While the expres-
sion of zebrafish lhx1a (synonym lim1; expressed in forebrain,
hindbrain, neural tube and spinal cord [45]) corresponds well
to the expression of the mouse gene Lhx1 [46], zebrafish lhx1b
(synonym lim6) mRNA was found in lower amounts and in
fewer spatiotemporal contexts compared to lhx1a mRNA
[47], in line with an apparently lower number of regulatory
inputs. The two zebrafish paralogs are expressed in comple-
mentary clusters of cells in the rostral telencephalon (Figure
7e, g in [48]).
From inspecting a number of cases such as the one above, it
appears that the large-scale deletion of entire chromosomal
segments (or possibly entire copies of duplicated chromo-
somes), as well as the event of one set of bystanders breaking
off from their targets, could have been tolerated shortly after
WGD while all genes and regulatory inputs on the other copy
of the same segment were still fully functional. As time
passed, more and more elements were selectively inactivated
on either copy of the locus that still survived in two copies,
making both essential for the full complement of their func-
tions, and rendering further large-scale losses intolerable.
Tracing the evolutionary change of genomic
regulatory blocks among teleost fish
The WGD in the teleost fish lineage created two copies of
most GRBs if the human genome is taken as outgroup of the
teleost clade. Inspection of many of the loci reveals a striking
confirmation and further explanation of the observation by
Semon and Woolfe [49] that, in many cases, the fate of the
GRBs after duplication is distinctly different in zebrafish and
the other four fish - both with respect to the fate of individual
bystander genes and whether the GRB and its target gene fall
under a 1-to-1 or 1-to-2 scenario. This implies that the last
common ancestor of zebrafish and the other four fish was
still, to a large extent, tetraploid. Zebrafish is known to be an
outgroup to the other four fish. For that reason, we suspect
that some of the published estimates put the two events too
far apart; for example, Wittbrodt et al. [50] state that the last
common ancestor of medaka and zebrafish lived around 110
to 160 Myr ago (Figure 1a): since the teleost WGD is esti-
mated to have occurred about 350 Myr ago, it would imply
(rather implausibly) that much of the genome has remained
tetraploid for more than 200 Myr, after which the reciprocal
gene loss process took off. Other estimates [51] put the two
events much closer to each other (WGD at 370 ± 34 Myr ago,
zebrafish:medaka separation at 323 ± 9.1 Myr ago), which is
more in line with what the interpretation of re-diploidization
events would suggest. Synorth not only provides the most
straightforward way to explore GRB content changes follow-
ing the WGD, but also aims to visualize the differences in
GRBs among the teleost fish, using human as a reference out-
group.
Figure 5 shows an example of how a GRB can change along
with the speciation events on the fish species tree. The GRB
for the candidate target gene paired box gene PAX2 contains
a large cluster of HCNEs and several bystander genes. The
PAX2 gene was found to play critical roles in eye, ear, central
nervous system and urogenital tract development [52-54].
Several of the HCNEs that span the region around it were
found to function as enhancer elements for its regulation [55].
The target gene has two orthologs in each of the five fish
genomes (see below), each with an array of HCNEs that align
to the single human PAX2 locus. According to the scenario
code defined in the Table browser (Figure 2c), it is a 1-to-2
GRB. If we look at the four bystander genes upstream of PAX2
in order (WNT8B, SEC31B, NDUFB8, and HIF1AN), they are
no longer syntenic as a group in teleost. WNT8B and HIF1AN
are in synteny at one locus, and SEC31B and NDUFB8 in the
other, showing a 'split-up' pattern (Figure 5). Interestingly,
when we looked at their syntenic relationship with the target
gene, zebrafish shows a different pattern than the other fish:
while wnt8 and hif1an are in synteny with pax2a in all cases,
from zebrafish to fugu, sec21b and ndufb8 are in synteny with
the corresponding pax2b ortholog in all fish except the
zebrafish. Again, this zebrafish outgroup feature is observed
at many other loci, such as the GRBs for FOXP2, SP3/SP5,
MAB21L2
and TFAP2A.
Synorth as a tool for improving gene annotation,
ortholog detection, and genome assemblies
Due to the fact that various duplication events, including
WGD, have created multiple copies of many DNA segments in
teleost genomes, gene annotation and genome assembly for
teleosts has been shown to be difficult and error-prone. Using
comparative genomics and phylogenetic methods, the
approach taken by Synorth can aid in adding missing gene
annotation and detecting likely cases of genome mis-assem-
bly.
Returning to PAX2 GRB as an example (Figure 5), we can see
that multiple HCNEs are present not only around zebrafish
pax2, but around PAX2 orthologs in all teleost. In the medaka
chromosome 15, the HCNEs and bystander genes are present,
but without annotation of the orthologous pax2. This casts
doubt on either the medaka gene annotation, or the target for
HCNE regulation in this branch. From the medaka expressed
sequence tag data in the UCSC Genome Browser [22] we
could see that two unspliced expressed sequence tags map
next to the orthologous position of PAX2 in medaka
(chr15:21016757-21035010; data not shown). The situation is
Genome Biology 2009, Volume 10, Issue 8, Article R86 Dong et al. R86.11
Genome Biology 2009, 10:R86
clearer in tetraodon; PAX2 seems to have an ortholog at
chr2_random, supported by the GRB model and a high den-
sity of HCNEs there. The tetraodon assembly we used in Syn-
orth (Ensembl 49, TETRAODON 7) has only one ortholog in
chromosome 17: in the new assembly (TETRAODON 8), there
is another ortholog, yet it is still in an unmapped contig
(chrUn_random). Other cases of missed annotation, like the
ortholog of human PAX9 in medaka, and the ST18 ortholog in
zebrafish, could easily be corrected with the aid of the Synorth
locus browser.
In addition to contributing to improved gene annotation,
Synorth could also be used interactively to improve ortholog
recognition. As shown previously, the ortholog prediction
pipeline (the right hand-side of Figure 2a) used for Synorth
outputs an extra set of orthologs ('prediction' in Table 1),
which are shown in gray in the Locus browser. For example,
in the PAX2 case, gene ENSGACG00000002432 (no gene
symbol available) on stickleback chromosome V is in synteny
with SEC31B and NDUFB8, spanned by an array of HCNEs,
just like the case in most of the other teleost fish. The
ENSGACG00000002432 gene was not predicted as an
ortholog gene of PAX2 in Ensembl v49 (the version we used
for prediction); however, Synorth provides ample evidence
from synteny and HCNE content to annotate it as an ortholog.
Cases like this were also mentioned in our previous examples,
such as lhx1b - jak1 in zebrafish - which should be annotated
as orthologs to their corresponding human gene according to
Synorth and our ortholog dataset.
We have also found that Synorth could help in the detection
and diagnostics of assembly errors in fish genomes by visual-
izing the problematic loci. An interesting case is that of
WWOX (alleged bystander in the MAF GRB). The target gene,
MAF, is a transcription factor that regulates differentiation,
defects in which cause juvenile-onset pulverulent cataract
[56]. There are two non-identical copies of MAF in zebrafish
(Zv7), which are closely located on chromosome 18, while the
single copy of WWOX is on another chromosome (chromo-
some 25), but still with HCNEs around it. According to the
GRB model and the criteria for target gene selection (see
Rationale and the cited references therein), these HCNEs
should be associated with its target gene MAF, and not
WWOX. This also appears true if we inspect the correspond-
ing locus in other fish, where the synteny between the
orthologs of WWOX and MAF, and the locus-spanning
HCNEs, is intact. We checked this locus in the new Zv8
assembly by mapping the two MAF copies to it. Indeed, we
found one of the copies mapped to chromosome 25, syntenic
with the WWOX ortholog, as we expected, and the other
mapped to chromosome 18 (Additional data file 3). This sug-
gests that in the true zebrafish assembly, the first
MAF
ortholog (referred to here as mafa) should be placed on chro-
mosome 25, in synteny with wwox, and the second one
(mafb) on chromosome18, with both copies surrounded by
HCNEs. This arrangement is similar to the orthologous loci in
PAX2 exampleFigure 5
PAX2 example. Using Synorth to trace the GRB changes between teleost
fish and to detect possible errors in genome assembly or missed
annotation. See detailed interpretation in the text.
human (hg18)
zebrafish (danRer5)
chr13:29231927-29498879(-)
A U E V
chr12:47121577-47408258(-)
A U E V
chr17:10921387-10957448(+)
A U E V
medaka (oryLat1)
chr19:10021353-10068111(+)
U E V
chr15:20935873-20965807(+)
U E V
chr19:10086903-10233838(-)
U E V
chr15:20976160-21123086(-)
U E V
stickleback (gasAcu1)
chrV:842515-862862(+)
U E V
chrVI:9769343-9805595(-)
U E V
chrV:869542-989006(-)
U E V
chrVI:9642695-9773533(+)
U E V
fugu (fr2)
chrUn:126349807-126369025(-)
U E V
chrUn:158905117-158931844(+)
U E V
chrUn:126232258-126343446(+)
U E V
chrUn:158928807-159034794(-)
U E V
Genome Biology 2009, Volume 10, Issue 8, Article R86 Dong et al. R86.12
Genome Biology 2009, 10:R86
other fish. Other examples of possible genome assembly
errors in zebrafish are in the loci of the orthologs of the
human genes GSX2, NKX2-4 and FEZF2. They are presently
1-to-2 orthologs in human:zebrafish comparisons, but 1-to-1
in other fish genomes. In each case, the two zebrafish
orthologs are closely located within one chromosome with
very high sequence identity, but map to one locus in the new
Zv8 assembly. This illustrates that, by considering the syn-
tenic arrangement of corresponding loci among different
genomes, Synorth can be used to detect a subset of likely
assembly artifacts.
Discovering prevalent evolutionary scenarios for
genes in genomic regulatory blocks
As described above, we assigned a three-digit scenario code to
each bystander gene that defines the rearrangement status of
each bystander gene in relation to the target gene for the GRB
in which it was located. This code offers a way to count the
prevalence of different evolutionary fates for the contents of
GRBs. Descriptive statistics for the scenario codes of all
bystander:target gene pairs in the set of 215 curated GRBs
that we investigated are shown in Figure 3b. Counting all
bystander:target gene pairs for human:zebrafish belonging to
the 1-to-1 scenario for the GRB, the top two scenario codes are
'111' and '100' (Figure 3b). This means that most bystander
genes in those GRBs were either maintained in synteny with
the target gene, or not present in the zebrafish genome. In a
few cases, the bystander gene was present outside of the
orthologous GRB (group '110' in Figure 3b), where the
zebrafish ortholog was present in a single copy, but no longer
in synteny with the target gene. Those genes might have
escaped the synteny with the target gene by reciprocal gene
loss, leaving a copy of each in different loci [49]. For the genes
belonging to the 1-to-2 orthology type, the most dominant
scenario code was 211. This means most zebrafish orthologs
of bystander genes were only present in single copy in the
zebrafish genome, and that those orthologs were located in
one of the orthologous GRBs. Scenario codes such as '210',
'221', and '220', where the human bystander gene was found
within the human GRB but outside of the zebrafish GRB, were
found to be less common, most likely because such an
arrangement requires a breakage/rearrangement of one copy
of the zebrafish GRB, and this breakage can only occur in a
'window of opportunity' in which the corresponding part of
the other copy of the GRB is still fully functional - that is, con-
tains the full set of ancestral regulatory inputs.
Summary
Synorth is designed to allow detailed study of the evolution-
ary changes in large chromosomal regulatory domains
(GRBs) across vertebrate genomes. In its current form it is
especially well suited for comparing changes in the different
teleost fish lineages. Built upon a database of orthologous
genes, syntenic regions and HCNEs, Synorth provides several
ways of visualizing and summarizing the evolutionary
changes of those syntenic orthologs in the context of HCNEs.
One of its novel features is a straightforward way to display,
measure, and explain the evolutionary changes of ortholo-
gous relationships in the framework of genomic synteny
blocks. Ortholog relationships displayed in Synorth are qual-
itatively different from paired ortholog profiles available in
other ortholog sets [23,32,57-61]: they clearly reveal regions
of extensive noncoding conservation and highlight large chro-
mosomal domains that have been maintained during evolu-
tion by the interaction of long-range regulatory elements and
their target genes. Consequently, we anticipate that Synorth
will be useful in tracing genes lost and gained in synteny
regions, and for studying evolutionary events such as sub-
functionalization following WGD. We have illustrated how
Synorth can be used to visualize and explore the fate of orthol-
ogous genes through duplication, maintenance and breakage
of GRBs. Synorth is also useful for improving ortholog recog-
nition, gene annotation and genome assembly. The scenario
code for bystander:target gene pairs defined in Synorth is also
a powerful approach for the study of GRB evolutionary
dynamics.
Abbreviations
GRB: genomic regulatory block; HCNE: highly conserved
non-coding element; Myr: million years; WGD: whole
genome duplication.
Authors' contributions
BL and XD designed the study. XD analyzed the data, created
the Synorth web resource and the underlying database, and
generated all examples and figures for the manuscript. DF co-
supervised the design and development of the resource. XD,
DF and BL wrote the manuscript.
Additional data files
The following additional data are available with the online
version of this paper: supplementary methods (Additional
data file 1); a figure showing the Synorth configuration page
(Additional data file 2); a figure showing the use of Synorth to
detect genome assembly errors (Additional data file 3).
Additional data file 1Supplementary methodsSupplementary methods.Click here for fileAdditional data file 2Synorth configuration pageUsers can set personal search preferences, including which species are used, the ortholog dataset, the appearance of the browser images (image width, connection lines, gene names, and so on), and set criteria that decide which tracks are shown by default based on track content ('smart' view mode).Click here for fileAdditional data file 3Using Synorth to detect genome assembly errorsUsing Synorth to detect genome assembly errors.Click here for file
Acknowledgements
We thank Thomas S Becker, Altuna Akalin, Christopher Previti, Pavla
Navratilova, and other members of Lenhard and Becker research groups
for valuable discussions and feedback. XD was supported by grant 170508
of the Norwegian Research Council (NFR) to BL. DF and BL were sup-
ported by grants from Bergen Research Foundation (BFS) and the Young
Future Research Leaders (YFF) program of the Norwegian Research Coun-
cil (NFR) to BL.
References
1. Becker TS, Lenhard B: The random versus fragile breakage
Genome Biology 2009, Volume 10, Issue 8, Article R86 Dong et al. R86.13
Genome Biology 2009, 10:R86
models of chromosome evolution: a matter of resolution.
Mol Genet Genomics 2007, 278:487-491.
2. Akalin A, Fredman D, Arner E, Dong X, Bryne JC, Suzuki H, Daub
CO, Hayashizaki Y, Lenhard B: Transcriptional features of
genomic regulatory blocks. Genome Biol 2009, 10:R38.
3. Nobrega MA, Ovcharenko I, Afzal V, Rubin EM: Scanning human
gene deserts for long-range enhancers. Science 2003, 302:413.
4. Kimura-Yoshida C, Kitajima K, Oda-Ishii I, Tian E, Suzuki M,
Yamamoto M, Suzuki T, Kobayashi M, Aizawa S, Matsuo I: Charac-
terization of the pufferfish Otx2 cis-regulators reveals evolu-
tionarily conserved genetic mechanisms for vertebrate head
specification. Development 2004, 131:57-71.
5. de la Calle-Mustienes E, Feijoo CG, Manzanares M, Tena JJ, Rod-
riguez-Seguel E, Letizia A, Allende ML, Gomez-Skarmeta JL: A func-
tional survey of the enhancer activity of conserved non-
coding sequences from vertebrate Iroquois cluster gene
deserts. Genome Res 2005, 15:1061-1072.
6. Pennacchio LA, Ahituv N, Moses AM, Prabhakar S, Nobrega MA,
Shoukry M, Minovitsky S, Dubchak I, Holt A, Lewis KD, Plajzer-Frick
I, Akiyama J, De Val S, Afzal V, Black BL, Couronne O, Eisen MB, Visel
A, Rubin EM: In vivo enhancer analysis of human conserved
non-coding sequences. Nature 2006, 444:499-502.
7. Navratilova P, Fredman D, Hawkins TA, Turner K, Lenhard B, Becker
TS: Systematic human/zebrafish comparative identification
of cis-regulatory activity around vertebrate developmental
transcription factor genes. Dev Biol 2009, 327:526-540.
8. Ovcharenko I, Loots GG, Nobrega MA, Hardison RC, Miller W,
Stubbs L: Evolution and functional classification of vertebrate
gene deserts. Genome Res 2005, 15:137-145.
9. Kikuta H, Laplante M, Navratilova P, Komisarczuk AZ, Engstrom PG,
Fredman D, Akalin A, Caccamo M, Sealy I, Howe K, Ghislain J, Peze-
ron G, Mourrain P, Ellingsen S, Oates AC, Thisse C, Thisse B, Foucher
I, Adolf B, Geling A, Lenhard B, Becker TS: Genomic regulatory
blocks encompass multiple neighboring genes and maintain
conserved synteny in vertebrates. Genome Res 2007,
17:545-555.
10. Engstrom PG, Ho Sui SJ, Drivenes O, Becker TS, Lenhard B:
Genomic regulatory blocks underlie extensive microsynteny
conservation in insects. Genome Res 2007, 17:1898-1908.
11. Force A, Lynch M, Pickett FB, Amores A, Yan YL, Postlethwait J:
Preservation of duplicate genes by complementary, degen-
erative mutations. Genetics 1999, 151:1531-1545.
12. Kleinjan DA, Bancewicz RM, Gautier P, Dahm R, Schonthaler HB,
Damante G, Seawright A, Hever AM, Yeyati PL, van Heyningen V,
Coutinho P: Subfunctionalization of duplicated zebrafish pax6
genes by cis-regulatory divergence. PLoS Genet 2008, 4:e29.
13. Putnam NH, Butts T, Ferrier DE, Furlong RF, Hellsten U, Kawashima
T, Robinson-Rechavi M, Shoguchi E, Terry A, Yu JK, Benito-Gutierrez
EL, Dubchak I, Garcia-Fernandez J, Gibson-Brown JJ, Grigoriev IV,
Horton AC, de Jong PJ, Jurka J, Kapitonov VV, Kohara Y, Kuroki Y,
Lindquist E, Lucas S, Osoegawa K, Pennacchio LA, Salamov AA, Satou
Y, Sauka-Spengler T, Schmutz J, Shin IT, et al.: The amphioxus
genome and the evolution of the chordate karyotype. Nature
2008, 453:1064-1071.
14. Panopoulou G, Poustka AJ: Timing and mechanism of ancient
vertebrate genome duplications - the adventure of a hypoth-
esis. Trends Genet 2005, 21:559-567.
15. Engstrom PG, Fredman D, Lenhard B: Ancora: a web resource for
exploring highly conserved noncoding elements and their
association with developmental regulatory genes. Genome Biol
2008, 9:R34.
16. Mungpakdee S, Seo HC, Angotzi AR, Dong X, Akalin A, Chourrout
D: Differential evolution of the 13 Atlantic salmon Hox clus-
ters. Mol Biol Evol 2008, 25:1333-1343.
17. Bailey GS, Poulter RT, Stockwell PA: Gene duplication in tetra-
ploid fish: model for gene silencing at unlinked duplicated
loci. Proc Natl Acad Sci USA 1978, 75:5575-5579.
18. Fredman DEP, Lenhard B: Web-based tools and approaches to
study long-range gene regulation in Metazoa. Brief Funct
Genomic Proteomic 2009 in press.
19. Lenhard B, Sandelin A, Mendoza L, Engstrom P, Jareborg N, Wasser-
man WW: Identification of conserved regulatory elements by
comparative genome analysis. J Biol 2003,
2:13.
20. Synorth []
21. Wagner GP, Takahashi K, Lynch V, Prohaska SJ, Fried C, Stadler PF,
Amemiya C: Molecular evolution of duplicated ray finned fish
HoxA clusters: increased synonymous substitution rate and
asymmetrical co-divergence of coding and non-coding
sequences. J Mol Evol 2005, 60:665-676.
22. Kuhn RM, Karolchik D, Zweig AS, Trumbower H, Thomas DJ,
Thakkapallayil A, Sugnet CW, Stanke M, Smith KE, Siepel A, Rosen-
bloom KR, Rhead B, Raney BJ, Pohl A, Pedersen JS, Hsu F, Hinrichs
AS, Harte RA, Diekhans M, Clawson H, Bejerano G, Barber GP,
Baertsch R, Haussler D, Kent WJ: The UCSC Genome Browser
Database: update 2007. Nucleic Acids Res 2007, 35:D668-673.
23. Hubbard TJ, Aken BL, Beal K, Ballester B, Caccamo M, Chen Y, Clarke
L, Coates G, Cunningham F, Cutts T, Down T, Dyer SC, Fitzgerald S,
Fernandez-Banet J, Graf S, Haider S, Hammond M, Herrero J, Holland
R, Howe K, Johnson N, Kahari A, Keefe D, Kokocinski F, Kulesha E,
Lawson D, Longden I, Melsopp C, Megy K, Meidl P, et al.: Ensembl
2007. Nucleic Acids Res 2007, 35:D610-617.
24. Visel A, Minovitsky S, Dubchak I, Pennacchio LA: VISTA Enhancer
Browser a database of tissue-specific human enhancers.
Nucleic Acids Res 2007, 35:D88-92.
25. Sandelin A, Bailey P, Bruce S, Engstrom PG, Klos JM, Wasserman
WW, Ericson J, Lenhard B: Arrays of ultraconserved non-coding
regions span the loci of key developmental genes in verte-
brate genomes. BMC Genomics 2004, 5:99.
26. Woolfe A, Goodson M, Goode DK, Snell P, McEwen GK, Vavouri T,
Smith SF, North P, Callaway H, Kelly K, Walter K, Abnizova I, Gilks
W, Edwards YJ, Cooke JE, Elgar G: Highly conserved non-coding
sequences are associated with vertebrate development. PLoS
Biol 2005, 3:e7.
27. Remm M, Storm CE, Sonnhammer EL: Automatic clustering of
orthologs and in-paralogs from pairwise species compari-
sons. J Mol Biol 2001, 314:1041-1052.
28. Sonnhammer EL, Koonin EV: Orthology, paralogy and proposed
classification for paralog subtypes. Trends Genet 2002,
18:619-620.
29. TreeBeST
[ />30. Vilella AJ, Severin J, Ureta-Vidal A, Heng L, Durbin R, Birney E:
EnsemblCompara GeneTrees: Complete, duplication-aware
phylogenetic trees in vertebrates. Genome Res 2009,
19:327-335.
31. Li H, Coghlan A, Ruan J, Coin LJ, Heriche JK, Osmotherly L, Li R, Liu
T, Zhang Z, Bolund L, Wong GK, Zheng W, Dehal P, Wang J, Durbin
R: TreeFam: a curated database of phylogenetic trees of ani-
mal gene families. Nucleic Acids Res 2006, 34:D572-580.
32. Ruan J, Li H, Chen Z, Coghlan A, Coin LJ, Guo Y, Heriche JK, Hu Y,
Kristiansen K, Li R, Liu T, Moses A, Qin J, Vang S, Vilella AJ, Ureta-
Vidal A, Bolund L, Wang J, Durbin R: TreeFam: 2008 Update.
Nucleic Acids Res 2008, 36:D735-740.
33. Nornes S, Clarkson M, Mikkola I, Pedersen M, Bardsley A, Martinez
JP, Krauss S, Johansen T: Zebrafish contains two pax6 genes
involved in eye development. Mech Dev 1998, 77:185-196.
34. Ashery-Padan R, Zhou X, Marquardt T, Herrera P, Toube L, Berry A,
Gruss P: Conditional inactivation of Pax6 in the pancreas
causes early onset of diabetes. Dev Biol 2004, 269:479-488.
35. Matsumoto Y, Osumi N: [Role of Pax6 in the developing central
nervous system]. Brain Nerve 2008, 60:365-374.
36. Zeng L, Gu S, Li Y, Zhao E, Xu J, Ye X, Wu Q, Wang L, Xie Y, Mao
Y: Identification of a novel human doublecortin-domain-con-
taining gene (DCDC1) expressed mainly in testis. J Hum Genet
2003, 48:393-396.
37. Hanna LA, Foreman RK, Tarasenko IA, Kessler DS, Labosky PA:
Requirement for Foxd3 in maintaining pluripotent cells of
the early mouse embryo. Genes Dev 2002, 16:2650-2661.
38. Teng H, Davis E, Abrahams A, Mowla S, Parker MI, Prince S: A role
for Tbx2 in the regulation of the alpha2(1) collagen gene in
human fibroblasts. J Cell Biochem 2007, 102:618-625.
39. Prince S, Carreira S, Vance KW, Abrahams A, Goding CR: Tbx2
directly represses the expression of the p21(WAF1) cyclin-
dependent kinase inhibitor. Cancer Res 2004,
64:1669-1674.
40. Law DJ, Gebuhr T, Garvey N, Agulnik SI, Silver LM: Identification,
characterization, and localization to chromosome 17q21-22
of the human TBX2 homolog, member of a conserved devel-
opmental gene family. Mamm Genome 1995, 6:793-797.
41. Gross JM, Dowling JE: Tbx2b is essential for neuronal differen-
tiation along the dorsal/ventral axis of the zebrafish retina.
Proc Natl Acad Sci USA 2005, 102:4371-4376.
42. Dheen T, Sleptsova-Friedrich I, Xu Y, Clark M, Lehrach H, Gong Z,
Korzh V: Zebrafish tbx-c functions during formation of mid-
line structures. Development 1999, 126:2703-2713.
43. Ribeiro I, Kawakami Y, Buscher D, Raya A, Rodriguez-Leon J, Morita
M, Rodriguez Esteban C, Izpisua Belmonte JC: Tbx2 and Tbx3 reg-
ulate the dynamics of cell proliferation during heart remod-
Genome Biology 2009, Volume 10, Issue 8, Article R86 Dong et al. R86.14
Genome Biology 2009, 10:R86
eling. PLoS ONE 2007, 2:e398.
44. Hunter CS, Rhodes SJ: LIM-homeodomain genes in mammalian
development and human disease. Mol Biol Rep 2005, 32:67-77.
45. Sprague J, Bayraktaroglu L, Bradford Y, Conlin T, Dunn N, Fashena D,
Frazer K, Haendel M, Howe DG, Knight J, Mani P, Moxon SA, Pich C,
Ramachandran S, Schaper K, Segerdell E, Shao X, Singer A, Song P,
Sprunger B, Van Slyke CE, Westerfield M: The Zebrafish Informa-
tion Network: the zebrafish model organism database pro-
vides expanded support for genotypes and phenotypes.
Nucleic Acids Res 2008, 36:D768-772.
46. Gray PA, Fu H, Luo P, Zhao Q, Yu J, Ferrari A, Tenzen T, Yuk DI,
Tsung EF, Cai Z, Alberta JA, Cheng LP, Liu Y, Stenman JM, Valerius
MT, Billings N, Kim HA, Greenberg ME, McMahon AP, Rowitch DH,
Stiles CD, Ma Q: Mouse brain organization revealed through
direct genome-scale TF expression analysis. Science 2004,
306:2255-2257.
47. Toyama R, Dawid IB: lim6, a novel LIM homeobox gene in the
zebrafish: comparison of its expression pattern with lim1.
Dev Dyn 1997, 209:406-417.
48. Shanmugalingam S, Houart C, Picker A, Reifers F, Macdonald R, Barth
A, Griffin K, Brand M, Wilson SW: Ace/Fgf8 is required for fore-
brain commissure formation and patterning of the telen-
cephalon. Development 2000, 127:2549-2561.
49. Semon M, Wolfe KH: Reciprocal gene loss between Tetraodon
and zebrafish after whole genome duplication in their ances-
tor. Trends Genet 2007, 23:108-112.
50. Wittbrodt J, Shima A, Schartl M: Medaka - a model organism
from the far East. Nat Rev Genet 2002, 3:53-64.
51. Kasahara M, Naruse K, Sasaki S, Nakatani Y, Qu W, Ahsan B, Yamada
T, Nagayasu Y, Doi K, Kasai Y, Jindo T, Kobayashi D, Shimada A, Toy-
oda A, Kuroki Y, Fujiyama A, Sasaki T, Shimizu A, Asakawa S, Shimizu
N, Hashimoto S, Yang J, Lee Y, Matsushima K, Sugano S, Sakaizumi M,
Narita T, Ohishi K, Haga S, Ohta F, et al.: The medaka draft
genome and insights into vertebrate genome evolution.
Nature 2007, 447:
714-719.
52. Burton Q, Cole LK, Mulheisen M, Chang W, Wu DK: The role of
Pax2 in mouse inner ear development. Dev Biol 2004,
272:161-175.
53. Dressler GR, Deutsch U, Chowdhury K, Nornes HO, Gruss P: Pax2,
a new murine paired-box-containing gene and its expression
in the developing excretory system. Development 1990,
109:787-795.
54. Nornes HO, Dressler GR, Knapik EW, Deutsch U, Gruss P: Spa-
tially and temporally restricted expression of Pax2 during
murine neurogenesis. Development 1990, 109:797-809.
55. Pfeffer PL, Payer B, Reim G, di Magliano MP, Busslinger M: The acti-
vation and maintenance of Pax2 expression at the mid-hind-
brain boundary is controlled by separate enhancers.
Development 2002, 129:307-318.
56. Jamieson RV, Perveen R, Kerr B, Carette M, Yardley J, Heon E, Wirth
MG, van Heyningen V, Donnai D, Munier F, Black GC: Domain dis-
ruption and mutation of the bZIP transcription factor, MAF,
associated with cataract, ocular anterior segment dysgene-
sis and coloboma. Hum Mol Genet 2002, 11:33-42.
57. Li L, Stoeckert CJ Jr, Roos DS: OrthoMCL: identification of
ortholog groups for eukaryotic genomes. Genome Res 2003,
13:2178-2189.
58. Schneider A, Dessimoz C, Gonnet GH: OMA Browser - exploring
orthologous relations across 352 complete genomes. Bioinfor-
matics 2007, 23:2180-2182.
59. Lehmann J, Stadler PF, Prohaska SJ: SynBlast: assisting the analy-
sis of conserved synteny information. BMC Bioinformatics 2008,
9:351.
60. Chen F, Mackey AJ, Stoeckert CJ Jr, Roos DS: OrthoMCL-DB: que-
rying a comprehensive multi-species collection of ortholog
groups. Nucleic Acids Res 2006, 34:D363-368.
61. O'Brien KP, Remm M, Sonnhammer EL: Inparanoid: a compre-
hensive database of eukaryotic orthologs. Nucleic Acids Res
2005, 33:D476-480.
62. Matsuya A, Sakate R, Kawahara Y, Koyanagi KO, Sato Y, Fujii Y, Yama-
saki C, Habara T, Nakaoka H, Todokoro F, Yamaguchi K, Endo T,
Oota S, Makalowski W, Ikeo K, Suzuki Y, Hanada K, Hashimoto K,
Hirai M, Iwama H, Saitou N, Hiraki AT, Jin L, Kaneko Y, Kanno M,
Murakami K, Noda AO, Saichi N, Sanbonmatsu R, Suzuki M,
et al.:
Evola: Ortholog database of all human genes in H-InvDB
with manual curation of phylogenetic trees. Nucleic Acids Res
2008, 36:D787-792.
63. Fu Z, Chen X, Vacic V, Nan P, Zhong Y, Jiang T: MSOAR: a high-
throughput ortholog assignment system based on genome
rearrangement. J Comput Biol 2007, 14:1160-1175.
64. Tatusov RL, Fedorova ND, Jackson JD, Jacobs AR, Kiryutin B, Koonin
EV, Krylov DM, Mazumder R, Mekhedov SL, Nikolskaya AN, Rao BS,
Smirnov S, Sverdlov AV, Vasudevan S, Wolf YI, Yin JJ, Natale DA: The
COG database: an updated version includes eukaryotes.
BMC Bioinformatics 2003, 4:41.
65. Berglund AC, Sjolund E, Ostlund G, Sonnhammer EL: InParanoid 6:
eukaryotic ortholog clusters with inparalogs. Nucleic Acids Res
2008, 36:D263-266.
66. Gene Tree for gene PAX2 in Ensembl v47
[http:oct2007.archive.ensembl.org/Homo_sapiens/gene
treeview?db=core;gene=ENSG00000075891]
67. Zheng XH, Lu F, Wang ZY, Zhong F, Hoover J, Mural R: Using
shared genomic synteny and shared protein functions to
enhance the identification of orthologous gene pairs. Bioinfor-
matics 2005, 21:703-710.
68. Kuhn RM, Karolchik D, Zweig AS, Wang T, Smith KE, Rosenbloom
KR, Rhead B, Raney BJ, Pohl A, Pheasant M, Meyer L, Hsu F, Hinrichs
AS, Harte RA, Giardine B, Fujita P, Diekhans M, Dreszer T, Clawson
H, Barber GP, Haussler D, Kent WJ: The UCSC Genome
Browser Database: update 2009. Nucleic Acids Res 2009,
37:D755-761.
69. Gene Orthology/Paralogy Prediction Method [http://
www.ensembl.org/info/docs/compara/homology_method.html]
70. Volff JN: Genome evolution and biodiversity in teleost fish.
Heredity 2005, 94:280-294.
71. Consortium ICGS: Sequence and comparative analysis of the
chicken genome provide unique perspectives on vertebrate
evolution. Nature 2004, 432:695-716.
72. Meyer A, Peer Y Van de: From 2R to 3R: evidence for a fish-spe-
cific genome duplication (FSGD). Bioessays 2005, 27:937-945.
73. Kraft CE, Carlson DM, Carlson M: Inland Fishes of New York (Online),
Version 4.0 2006 [ />fish.html]. Department of Natural Resources, Cornell University, and
the New York State Department of Environmental Conservation
74. Aparicio S, Chapman J, Stupka E, Putnam N, Chia JM, Dehal P, Christ-
offels A, Rash S, Hoon S, Smit A, Gelpke MD, Roach J, Oh T, Ho IY,
Wong M, Detter C, Verhoef F, Predki P, Tay A, Lucas S, Richardson
P, Smith SF, Clark MS, Edwards YJ, Doggett N, Zharkikh A, Tavtigian
SV, Pruss D, Barnstead M, Evans C, et al.: Whole-genome shotgun
assembly and analysis of the genome of Fugu rubripes. Sci-
ence 2002, 297:1301-1310.
75. Jaillon O, Aury JM, Brunet F, Petit JL, Stange-Thomann N, Mauceli E,
Bouneau L, Fischer C, Ozouf-Costaz C, Bernot A, Nicaud S, Jaffe D,
Fisher S, Lutfalla G, Dossat C, Segurens B, Dasilva C, Salanoubat M,
Levy M, Boudet N, Castellano S, Anthouard V, Jubin C, Castelli V,
Katinka M, Vacherie B, Biemont C, Skalli Z, Cattolico L, Poulain J, et
al.: Genome duplication in the teleost fish Tetraodon nigro-
viridis reveals the early vertebrate proto-karyotype. Nature
2004, 431:946-957.