Báo cáo y học: " Identification of functional modules that correlate with phenotypic difference: the influence of network topology" potx
Bạn đang xem bản rút gọn của tài liệu. Xem và tải ngay bản đầy đủ của tài liệu tại đây (1.39 MB, 16 trang )
METH O D Open Access
Identification of functional modules that correlate
with phenotypic difference: the influence of
network topology
Jui-Hung Hung
1
, Troy W Whitfield
2
, Tun-Hsiang Yang
1
, Zhenjun Hu
1,3
, Zhiping Weng
1,2,3*
, Charles DeLisi
1,3*
Abstract
One of the important challenges to post-genomic biology is relating observed phenotypic alterations to the under-
lying collective alterations in genes. Current inferential methods, however, invariably omit large bodies of informa-
tion on the relationships between genes. We present a method that takes account of such information - expressed
in terms of the topology of a correlation network - and we apply the method in the context of c urrent procedures
for gene set enrichment analysis.
Background
A central problem in cell biology is to infer functional
molecular modules underlying cellular altera tions from
high throughput data such as differential gene, protein
or metabolite concentrations. A number of computa-
tional techniques have been developed that use expres-
sion for class distinction to identify, from among a
priori defined sets of functionally or structurally related
genes, those that correlate with phenotypic difference
(see, for e xample, Goeman and Buhlmann [1]). More
sophisticated a pproaches have used random forests to
capture nonlinear and complex information in expres-
sion profiles [2]; applied linear transformations to mea-
sure the discriminative information of genes [3]; and
combined information from multiple assessments [4].
One of the most widely used methods, gene set
enrichment analysis (GSEA) [5], ranks genes according
to their differential expression and then uses a modified
Kolmogorov-Smirnov statistic (weighted K-S test) as a
basis for determining whether genes from a prespecified
set (for example, Kyoto Encyclopaedia of Genes and
Genomes (KEGG) pathways or Gene Ontolog y (GO)
terms) are overrepresented toward the top or bottom of
the list, correcting for false discovery when multiple sets
are tested [6]. The central message of this paper is that
discovery depends strongly on the type of correlation
used, and we illustrate this point by elaborating on the
biological implications of two different cancer data sets.
GSEA uses a weighted Kolmogorov-Smirnov statistic
(WKS) to quantify enrich ment. The weight is related to
the correlation with phenotype, essentially omitting
known network properties of gene sets. Here we take
such properties into account, as explained below. We
reserve the term WKS for describing GSEA, and refer to
our method, which integrates topological information, as
pathway enrichment analysis (PWEA), where a pathway
is defined as a pair of nodes connected by an uninter-
rupted set of intervening nodes and edges, such as those
found in protein-protein interaction networks, signal
transduction networks, and metabolic pathways. In this
paper we use KEGG pathways. Just as WKS represents a
conceptual and practical improvement over the K-S test,
we s how in this paper that the inclusion of topological
weighting is not only a conceptual change in enrichment
analysis, but a substantial practical improvement.
Several recently introduced techniques, including
ScorePAGE [7], g ene network enric hment analysis [8]
and Pathway-Express [9], incorporate concepts of gene
topology. ScorePAGE uses a topology-weighted cross-
correlation of time-dependent (or condition-dependent)
gene expression data to assign a significa nce value to a
priori defined KEGG metabolic pathways. Gene network
enrichment analysis first identifies a high-scoring tran-
scriptionally affected sub-network from a global network
of protein-protein interactions, and then identifies gene
sets that are enr iched in the sub-network using a Fisher
* Correspondence: ;
1
Bioinformatics Program, Boston University, 24 Cummington Street, Boston,
MA 02215, USA
Hung et al. Genome Biology 2010, 11:R23
/>© 2010 Hung et al.; licensee BioMed Central Ltd. This is an open access article distributed under the terms of the Creative Commons
Attribution License ( nses/by/2.0), which permits unrestricted use, distribution, and reproduction in
any medium, provided the original work is properly cited.
test. Pathway -Express contains in its scoring function a
term that increases the scores of the genes that are
directly connected to other differentially expressed
gene s, which in turn produces a hi gher overall score for
predefined KEGG signaling pathways in which the dif-
ferentially expressed genes are localized in a connected
sub-graph. Other strategies that extract enriched func-
tional submodules [10,11] or paths [ 12] from protein-
protein interaction networks or other topological path-
ways without strict boundary (that is, identify only a
subset of networks without a priori gene set definition)
also take advantage of the topology.
Here we present a new and general method for incor-
porating disparate data into statistical methods used to
infer functional modules from a class distinction metric.
In order to fix ideas and compare with the most popular
method, we use differential expression to distinguish
phenotype and define a topological influence factor (TIF)
to weight the K-S statistic. The TIF, however, can just
as easily be used with other kinds of class distinctions as
data become available, and with other kinds of statistics.
The co ntributions of this paper are both methodologi-
cal and biological. The methodological contribution
consists of including known correlations among the
genes in a gene set in the weighting procedure. When
applied to cancer data sets we find that the inclusion of
longer-range correlations substantially improves sensitiv-
ity, with little or no loss of specificity. In particular for
colorectal cancer, PWEA and GSEA agree on 24 out of
25 pathways identified by GSEA, but PWEA identifies
an additional 10 pathways, 8 of which, including oxida-
tive metabolism of arachidonic acid, are supported by
evidence from the literature. For small cell lung carci-
noma, PWEA finds all 19 of the pathways identified by
GSEA, and an additional 14 highly plausible pathway s,
including apoptosis, MAPK signaling pathway, Jak-
STAT signaling pathway, and the GnRH signaling
pathway.
Results
The topological influence factor
The goal of enrichment analysis is to discover sets of
related genes that correlate with differential behavior.
However, many such sets, including pathways and chro-
mosomal locatio ns in linkage disequilibrium, have long
range correlations whose omission could affect conclu-
sions. Thus, in an established biochemical pathway,
nearest neighbor interactions are implicitly presen t in
standard analysis, but cross-talk between pathways is
missing, as is possible variation in correlation between
non-neighboring genes that might be identified by
genetic interactions, phylogeneti c analysis and so on.
Here, we define the correlation between genes in a net-
work by an influence factor, Ψ.Weconstrainthe
functional form of Ψ by assuming that the influence of
genes i and j on one another will drop as the ratio of
the shortest distance between them to their correlation,
the latter being obtained from variations in expression
over a set of conditions. In particular, we define the
mutual influence between two genes as:
ij ij
f
exp
(1)
where f
ij
= d
ij
/|c
ij
|, d
ij
is the shortest distance between
genes i and j,andc
ij
is the correlation based on their
expression profiles. If m is the total number of samples,
including both normal and disease samples, then the
Pearson correlation coefficient is:
ciijjmss
ij k
k
m
kij
()( )()
1
1
where i
k
is the expression level of gene i in sample j,
and s
i
is the sample standard deviation of gene i.The
exponential form of Equation 1 is suggested by the
observed discriminative weight of each gene measured
by the machine lea rning algorithm introduced in Fujita
et al. [3]. It is reasonable to expect that only close
neighbors with strong correlations will contribute signif-
icantly to the score.
Since d
ij
and |c
ij
| are pos itive definite, and positive,
respectively, 0 < Ψ
ij
≤ 1, and Ψ behavesinanobvious
and intuitive manner as shown in Figure S1 in Addi-
tional file 1. We further define the TIF of a gene i as
the a verage mutual influence that the gene imposes on
the rest of the genes in the pathway. In particular (see
Materials and methods):
TIF
n
f
i
ij
n
j
ji
n
ij
j
ji
n
1
1
1
1
/
exp
(2)
where n is the total number of genes c onnected by
paths starting at gene i.IfTIF
i
is small, gene i fails to
affect the pathway and its abnormality can be eliminated
by genetic buffering (Additional file 1) or some other
effect (see Discussion and conclusions). Otherwise, the
gene could play an important role in perturbing the
functionality of the pathway. Although we apply TIF
only to KEGG pathways in this paper, its definition
allows application to a general network.
Controlling the magnitude of TIF
One shortcoming of Equation 2 is that the effect of a
gene on a few nearby and tightly correlated genes can
be washed out if the gene influences many other genes
weakly (see Discussion and con clusions). In order to
Hung et al. Genome Biology 2010, 11:R23
/>Page 2 of 16
avoid this difficulty, we define a filtering process (see
Materials and methods) to include only genes for wh ich
Ψ is larger than a given threshold, a.Fromobserving
the behavior of Ψ (Figure S2 in Additional file 1), a is
set to 0.05. The final TIF is written as:
TIF
N
ff
iij
j
ji
n
ij
exp ln
1
1
(3)
where Θ is the step function (see Materials and
methods) and
Nf
ij
j
ji
n
ln
1
is the total
number of genes connected by paths starting at gene i
and for which Ψ is larger than a.WeuseTIF as a
weight rather than a statistic, that is, we use the TIF
scores of all genes.
There is no restriction on the type of statistic that TIF
can modify, although in this work we restrict our analy-
sis to a modification of WKS (that is, GSEA), as
described in Materials and methods. Please note that
the value of TIF in the following context is i n the form
of 1 + TIF, to accommodate to the usage of the weight-
ing scheme in WKS (see Materials and methods). The
general comparison with three other gene set level sta-
tistical tests (that is, mean, medium and Wilcoxon rank
sum test as describ ed by Ackermann and Strimmer
[13]),areshowninTableS4inAdditionalfile1.In
most cases, TIF weighting led to higher sensitivity.
Test with synthetic random input
Rigorous performance evaluation of enrichment meth-
ods is difficult in the absence of a gold standard
[6,9,14]. At a minimum, however, we require that the
likelihood of inferring perturbed pathways from ran-
domly generated data be insignificant, and that the per-
formance of our method be compar able to that of other
methods. In our test, PWEA does not show biased P-
values in a sample generated by 500 random phenotype
shuffles of the small cell lung cancer dataset. The com-
parison with WKS and K-S tests is shown in Figure S3 in
Additional file 1. PWEA yields a unifo rm distribution of
P-values in a randomly generated null background, just as
do other proven approaches. In addition, as explained
below, our analyses of six test sets suggests that PWEA
has substantial sensitivity advantages with no loss of speci-
ficity compared with GSEA (Additional file 2).
Application to cancer datasets
Expression profiles for two human cancer/normal data-
sets - colorectal cancer and small cell lung cancer -
were extracted from NCBI Gene Expression Omnibus
(GEO) [15]. Of the 14 cancer types represented among
the KEGG pathways, these two are among those whose
currently available cancer expression data in the GEO
database have adequate sample size for statistical testing.
Case study I: colon cancer dataset
The dataset [GEO:GDS2 609] [16] consists of 10 normal
and 12 early onset c olorectal cancer samples. Since the
mutual influence (Equation 1) of two genes depends on
the correlation between their expression levels, the TIF
of a particular gene pair will differ from one data set to
the next, even though their topo logical relationship in a
pathway is invariant. For each data set, a TIF score is
assigned to all genes in every pathway. For the colon
cancer pathway dataset, the TIF averaged over all genes
in all 201 KEGG pathways is 1.06 ± 0.008.
In the remainder of this paper, we illustrate how the
use of TIFs can uncover relationships that would other-
wise be missed. As a general observation we note that
although the ten genes with highest TIFs over all KEGG
pathways (Table 1) do not always rank high in terms of
differential expression, the ir functional ann otations in
GO and KEGG – carcinoma, calcium signaling, cell
adherent, cytokine receptor, metabolic system – are
nevertheless consistent with a role in cancer.
A more specific observation is the high TIF but low t-
score for the chemokine receptor CCR7 (Table 1). Its
ligands, CCL19 and CCL21, also have high TIF scores
(1.20 and 1.19, respectively). This finding is reinforced
by the biological relationship among the three in
immune reactions and lung disorders [17]. Indeed, both
receptor-ligand complexes are implicated in colon can-
cer, cell invasion and migration [18].
More generally, by weigh ting genes according to their
differential expression and longer range correlations,
sensitivity for discovering perturbed pathways in colon
cancer increases. In particular, we identified 34 pathways
using a false discovery rate (FDR) below 0.01 (see Mate-
rials and methods). We applied GSEA to the same data-
set and discovered 25 pathways, 24 of which were
among the 34 identified by PWEA (Table S1 in Addi-
tional file 1).
The only pathway identified by GSEA and not by
PWEA is the Adipocytokine signaling pathway. Poly-
morphism of adipokine genes such as LEPR can increase
the risk of colorectal cancer [19]. Although LEPR’s rela-
tively hig h TIF (1.15) indicates that it does perturb the
network, the pathway does not have a high overall sig-
nificance. PWEA may fail to discover this pathway due
to its incompleteness, lacking either edges or nodes,
which leads to many false ‘extrinsic’ genetic buffering
effects (see Discussion and conclusions). Ten additional
pathways found exclusively by PWEA are listed in Table
2, with independent evidence. Below, we discuss two
examples that are especially striking.
Hung et al. Genome Biology 2010, 11:R23
/>Page 3 of 16
Arachidonic acid oxidative metabolism pathway
Briefly, arac hidonic acids (AAs) are essential fatty acids
that are released from membrane phospholipids by
phospholipase A
2
in response to chemical or mechanical
signals at the cell surface. The hydrolyzed AAs initiate a
cascade of three signaling pathways that produce eicosa-
noids, a family of lipid regulatory molecules that
includes prostaglandins and thromboxanes (when AA is
a substrate for cyclooxygenase (COX)), various oxyge-
nated states of the leukotrienes (when AA is a substrate
for lipoxidase), and three types of P450 epoxygenase-
derived eicosanoids.
Each of these pathways - the COX sub-pathway, the
lipo xidase pathway and the epoxygenase pathway - have
Table 1 Ten highest TIF genes in the colorectal cancer dataset
Gene TIF t-score (P-
value)
KEGG annotation GO annotation (evidence code
a
)
SLC25A5 1.34 4.79 (2e-6) Calcium signaling pathway
Parkinson’s disease
Huntington’s disease
Function:
Adenine transmembrane transporter activity (TAS)
Process:
Transport (TAS)
CCR7 1.33 1.90 (0.06) Cytokine-cytokine receptor interaction Function:
G-protein coupled receptor activity (TAS)
Process:
Chemotaxis (TAS)
Elevation of cytosolic calcium ion concentration (TAS)
Inflammatory response (TAS)
VDAC1 1.32 5.82 (6e-9) Calcium signaling pathway
Parkinson’s disease
Huntington’s disease
Function:
Protein binding (IPI)
Voltage-gated anion channel activity (TAS)
Process:
Anion transport (TAS)
TCF7L1 1.32 6.02 (2e-9) Wnt signaling pathway
Adherens junction
Melanogenesis
Pathways in cancer
Colorectal cancer
Endometrial cancer
Prostate cancer
Thyroid cancer
Basal cell carcinoma
Acute myeloid leukemia
Function:
Transcription factor activity (NAS)
Process:
Establishment or maintenance of chromatin architecture
(NAS)
Regulation of Wnt receptor signaling pathway (NAS)
NCAM1 1.32 5.80 (7e-9) Cell adhesion molecules (CAMs) Process:
Cell adhesion (NAS)
SERPING1 1.32 7.60 (3e-14) Complement and coagulation cascades Process:
Blood circulation (TAS)
C1R 1.32 4.70 (3e-6) Complement and coagulation cascades
Systemic lupus erythematosus
Function:
Serine-type endopeptidase activity (TAS)
PPID 1.32 4.04 (5e-5) Calcium signaling pathway
Parkinson’s disease
Huntington’s disease
Function:
Cyclosporin A binding (TAS)
Protein binding (IPI)
HADH 1.32 5.94 (3e-09) Fatty acid elongation in mitochondria
Fatty acid metabolism
Valine, leucine and isoleucine degradation
Geraniol degradation
Lysine degradation
Tryptophan metabolism
Butanoate metabolism
Caprolactam degradation
Function:
3-hydroxyacyl-CoA dehydrogenase activity (EXP, TAS)
GOT1 1.30 3.69 (0.0002) Glutamate metabolism
Alanine and aspartate metabolism
Cysteine metabolism
Arginine and proline metabolism
Tyrosine metabolism
Phenylalanine metabolism
Phenylalanine, tyrosine and tryptophan
biosynthesis
Alkaloid biosynthesis I
Function:
L-aspartate:2-oxoglutarate aminotransferase activity (EXP, IDA)
Process:
Aspartate catabolic process (IDA)
cellular response to insulin stimulus (IEP)
response to glucocorticoid stimulus (IEP)
a
Evidence codes defined by GO: EXP (Inferred from Experiment), IDA (Inferred from Direct Assay), IEP (Inferred from Expression Pattern), IPI (Inferred from Physical
Interaction), NAS (Non-traceable Author Statement), and TAS (Traceable Author Statement).
Hung et al. Genome Biology 2010, 11:R23
/>Page 4 of 16
been implicated in several human cancers, including
colon cancer [20]. The latter pathway is especially inter-
esting because various P450 cytochromes are essential
to it. I n particular, CYP2J2 metabolizes epoxygenase-
derived eicanosoids from AA into four ci s -epoxyeicosa-
trienoic acids (EETs), 5,6-EET, 8,9-EET, 11,12-EET, and
14-15 EET [21]. These molecules have been shown to
be involved in canc er pathogenesis by affecting various
physiological processes, including intracellular signal
transduction, proliferation (likely through the Erk/mito-
gen-activated protein kinase (MAPK ) signaling pathway
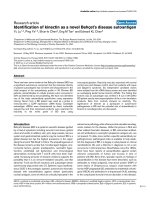
[20]; Figure 1b), inflammation [22], and inhibition o f
apoptosis. CYP2J2 has the highest TIF score (1.17) in
this pathway. Other evidence suggests that CYP2J2 and
EETs, which lead to phosphorylation of the epidermal
growth factor receptor and the subsequent activation of
downstream phosph oinositide 3-kinase (PI3K )/AKT and
MAPK signaling pathways, suppresses apoptosis and up-
regulates proliferation in carcinoma [23].
Genes in the COX pathway also show high TIF scores,
such as PTGS1 (that is, COX1), PTGS1 (COX2), and
PTGIS (1.12, 1.15, and 1.12, respectively). Simil arly,
genes with high TIF scores can also be observed in the
lipoxidase sub-pathway, especially the arachidonate
lipoxygenase family (ALOX), most of whose members
have TI F scores above 1.09. The large number of genes
showing high TIF scores indicates a significant tumor-
associated perturbation.
Axon guidance pathway
There are four categories of axon guidance molecules
(netrins, semaphorine, ephrine and members of the
SLIT family) and their specific signal transduction routes
comprise the axon guidance pathway . Briefly, netrin-1
(NTN1), the DCC family of receptors and the human
UNC5 ortholog comprise part of a signaling pathway
that is involved in the regulation of apoptosis, and
whose dysregulation has been implicated in human can-
cers [24,25]. The SLIT family is involved in cell migra-
tion,soonemightexpectthataberrantoraberrantly
expressed genes could contribute to metast asis, and that
they will in any case affect migration of immune cells,
which could predispose toward, or exacerbate, various
disorders. In fact, the pathway involving SLIT and its
roundabout receptor (ROBO) has been implicated in
cervical cancer [26]. SLIT2 appears to be a candidate for
a colon cancer suppressed gene, since i t is often inacti-
vated b y LoH and hypermethylation [27] and its rece p-
tor, ROBO1, has been implicated in colon cancer [28],
although the underlying mechanism of the SLIT-ROBO
involved tumor growth remains obscure.
The SLIT1, SLIT2 and ROBO1 genes have significantly
high TIFs: 1.18, 1.16 and 1.16, respectively. We also
found that other receptors in axon guidance, such as
PLXNA1,havehighTIF scores (1.21). Our observations
indicate a strong connection between colon c ancer and
axon guidance. Indeed, it has become evident that the
axon guidance pathway reveals the critical roles that
axon guidance molecules play in the regulation of angio-
genesis, cell survival, apoptosis, cell positioning and
migration [29-31 ]. It has been suggested that axon gui-
dance shares a common mechanism with tumorigenesis,
such as p53-dependent apoptosis [24,25].
Finally, the EphA family of axon guidance genes is
known to be associated with the Ras/MAPK signaling
pathway to control cell growth and mobility [32]; this
pathway is also included in KEGG’saxonguidance
Table 2 Pathways from the colon cancer dataset found exclusively by PWEA
Pathway Size DE
fraction
a
Type Possible relation to the cancer Reference.
Arachidonic acid metabolism 50 34% Lipid metabolism Inflammation
Cell growth, related to MAPK signaling
pathway
[20-22,72]
Axon guidance 126 20% Development Cell mobility and cell growth, related to MAPK
signaling pathway
[28,32]
Nicotinate and nicotinamide
metabolism
23 22% Metabolism of cofactors and
vitamins
Stimulate cell growth [73,74]
Drug metabolism - cytochrome
P450
63 30% Xenobiotics biodegradation and
metabolism
Therapeutic target, related to prognosis [75]
Urea cycle and metabolism of
amino groups
28 39% Amino acid metabolic Nutrition intake [76]
Pyruvate metabolism 41 37% Carbohydrate metabolism Nutrition intake [76]
Bile acid biosynthesis 31 39% Lipid metabolism Lead to high concentration of bile acid
Resistance to bile-acid induced apoptosis
[77,78]
Colorectal cancer 84 15% Disease - -
Long-term depression 70 15% Disease Unknown -
Amyotrophic lateral sclerosis 54 15% Disease Inflammation and MAPK signaling pathway -
a
DE fraction is the fraction of genes that show differential expression with P < 0.05 using a two-tailed t-test.
Hung et al. Genome Biology 2010, 11:R23
/>Page 5 of 16
pathway. By examining the genes in the path leading
from EphA to the MAPK sig naling pathway (Figure 1c),
we found that the MAPK signaling-related genes EphA,
RasGAP, Ras,andERK all have significant TIF scores
(1.13, 1.15, 1.10, and 1.20, respectively). This finding
implies that another candidate modulator of the abnor-
mal behavior of colon cancer cell growth and cell mobi-
lity is linked to the MAPK signaling pathway.
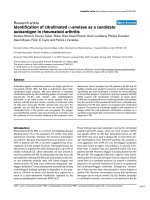
We used KEGG to visualize the flow of physiological
alterations associated with early stage adenoma. As indi-
cated in Figure 2, most of the high TIF genes in the
associated table are clustered in the upstream region of
the MAPK signaling pathway in an apoptosis cluster
(circled in red), and in a set of cell cycle genes (circled
in blue). No gene with a high TIF score occurs in the
late stage of the disease. This observation follows the
Figure 1 Pathways adapted from KEGG. (a) Renal cell carcinoma. (b) MAPK signaling path way. (c) Axon guidance. (d) Amyotrophic lateral
sclerosis. (e) Fcε RI signaling pathway. (f) Gonadotropin-releasing hormone signaling pathway. (g) Jak-STAT signaling pathway. (h) Basal cell
carcinoma. Red indicates an abnormality.
Hung et al. Genome Biology 2010, 11:R23
/>Page 6 of 16
expected behavior of genes from the samples, since they
were collected from colonic mucosa at an early stage
(Dukes A/B) [16]. These physiologically important clus-
ters would not be identifiable by gene expression with-
out the information provided by TIF.
The non-obvious associations of long-term depression
and amyotrophic lateral sclerosis (ALS) with colorectal
cancer are consistent with the idea that a partic ular
aberrant gene or gene set can be implicated in distinctly
different phenotypes [33]. Thus, superoxide dismutase
(SOD1;TIF = 1.13, t-score = 5.04), which converts harm-
ful superoxide radicals to hydrogen peroxide and oxy-
gen, helps prevent DNA damage and is a possible
cancer therapeutic target [34], and also impinges on the
ALS pathway (Figure 1d). Genes related to MAPK sig-
nalin g, particularly p38 kinase, which regulates neurofi-
lament damage, have elevated TIF scores. It may be that
the underlying mechanisms of ALS and early stage col-
orectal carcinoma are similar.
The results also suggest an association between colon
cancer and renal cell carci noma. PWEA and GSEA both
report significant P-values for the KEGG renal cell carci-
noma pathway; however, PWEA provides additional and
more specific information. Genes with high TIF scores
tend to cluster around the paths shown in Figure 1a.
One of the paths influencing proliferation starts at the
well-known oncogene MET (which encodes a Met tyro-
sine kinase and is p resent in both colorectal and renal
cancer), and includes a sequence of genes that all have
significant TIF scores: GAB1, SHP2, ERK, AP1 (TIF =
1.14, 1.23, 1.15, and 1.16, respectively). Similarly,
another pat h from MET (dashed lines in Figure 1a) that
influences survival, migration, and invasion includes
GAB1, PIK3,andAKT, ea ch of which has a significantly
Figure 2 TIF scores f or genes in the KEGG c olor ectal cancer pathway. The regions circled in red and blue are clustered around the early
stages of carcinoma, in accordance with the tissue origin being early stage.
Hung et al. Genome Biology 2010, 11:R23
/>Page 7 of 16
high TIF score (1.14, 1.25, and 1.17, respectively). The
high TIF scores of these genes in these pathways, which
are common to colon and renal cancer, indicate a pre-
viously unrep orted overlap in the genes underlying
changes in proliferation, invasion, and migration for
these two cancers.
Case study II: small cell lung cancer dataset
The small cell lung cancer dataset consists of 19 normal
and 15 prima ry sma ll c ell lung cancer sample s col lected
from [GEO:GSE1037] [35]. The ten genes with highest
TIF scores among 201 pathwa ys are listed in Table 3.
These gene s are associated with cell cycle (growth and
division), apoptosis, immune response and metabolic
pathways. The average TIF score of all genes is 1.07 ±
0.008. For two of the ten genes, SPCS1 and BTD,both
from the biotine metabolism pathway, we found no direct
evidence for association with lung cancer, nor is the bio-
tine metabolism pathway discovered by PWEA (FDR >
0.01). These high TIF scores could be the result of a
small number of neighbors passing the filtering process,
which w ould make the result unreliable (see Materials
and methods). Such an apparently local, false signal is
unlikelytoleadtofalsepositivepathwayssinceasignifi-
cant pathway requires consistent global evidence in order
to be observed with WKS (see Materials and methods).
PWEA reports 33 pathways; GSEA reports 19, all of
which are among those found by PWEA (Table S1 in
Additional file 1). As discussed by Subramanian and col-
leagues [6], the independent eviden ce that the 19 path-
ways are invo lved in small cell lung carcin omas is
strong. The additional pathways uniquely discovered by
PWEA are listed in Table 4 acco mpanied by evidence
from the literature. From among the pathways listed in
Table 4, we discuss three pathways that are especia lly
intriguing.
FcεRI signaling pathway
The FcεRI signaling pathway triggers signaling cascades
of various effector and immunomodulatory funct ions
related to inflammation in mast cells [36]. FcεRI responds
to immunoglobulin E (IgE) activation and signals mast
cells to work as effectors (by releasing histamine, pro-
teases, and proteoglycans) a nd immunomodulators (by
releasing proinflammatory and immunomodulatory cyto-
kines, such as TNFa,IL1,IL2,IL3,IL4,IL6,andIL13
[37]. These cytokines recruit additional leukocytes -
including T cells, B cells, macrophages and granulocytes
- thereby promoting imm une protection, whether against
foreign or transformed self antigens [38]. Recent evidence
suggests that cancer-related inflammation is among the
key physiological changes associated with cancer, pro-
moting proliferation, angiogenesis and metastasis [39].
The intrinsic inflammation pathway of tumor cells
activated by genetic alterations releases chemokines and
cytokines to create an inflammatory microenvironment,
which stimulates leukocyte recruitment [40]. Although
the Fcε RI signaling pathway in KEGG is constructed
based on the immune responses of mast cells, it may be
that this pathway is utilized by tumor cells to promote
inflammation. Genes with high TIF values include the
tyrosine kinases Lyn, Syk, PI3K, PDK1, and AKT, several
of which tend to be specific to hematopoietic cells, and
are components of signaling cascades leading from the
plasma membrane to the nucleus, ultimately regulating
the transcription of various cytokines, including TNFa
(Figure 1e). Genes along another signaling route, includ-
ing Lyn, Syk, LAT, Grb2, Sos, Ras, Raf, MEK and ERK,
also show high TIF scores. Indeed, this Ras-Raf signaling
path has been suggested to be the trigger for the pro-
duction of inflammatory chemokines and cytokines in
cancer cells [41,42], although our TIF scores also impli-
cates the first route.
Gonadotropin-releasing hormone signaling pathway
Gonadotropin-releasing hormones (GnRHs) are develop-
ment and growth related, and the GnRH signaling path-
way has been implicated in several types of cancer [43].
Genes encoding proteins of the signal transduction pat h
originating at the GnRH receptor and proceeding
through LH, FSH, Gq/11, PLCb,PKC,Src,CDC42,
MEKK, MEK4/7, JNK, c-Jun, and other nodes in the
JNK/MAPK signaling pathway (Figure 1f) all have rela-
tively high TIF scores. The same is true of transduction
throughGs,AC,PKA,andCREBtowardLHb and
FSHb , suggesting that bot h routes play a ro le in small
cell carcinoma. Interestingly, although small cell lung
cancer cells are known to secrete peptide hormones
[44], mainly adrenocorticotropic hormone, there are
only a few reports of ectopic productio n of gonadotro-
pinbylungcancercells[45,46].TheroleoftheGnRH
pathway in controlling the production of gonadotropin
in tumor cells remains poorly understood; our results
suggest the possibility that small cell lung cancer cells
hijack this pathway to help achieve autocrine modula-
tion of their own proliferation.
Jak-STAT signaling pathway
The Jak-STAT signaling pathway is related to cell
growth; it has been implic ated in several kinds of can-
cers, so its identification is not surprising. This pathway
is noted here primarily to contrast PWEA’s sensitivity
with that of the WKS test. Signaling proceeds from the
plasma membrane through most of the genes with high
TIF scores, prior to reaching the apoptosis pathway (Fig-
ure 1d), which is also found by PWEA (Table 4). Indeed,
it has been shown that the STAT3-dependant growth
arrest sig nal is inactivated in small cell lung cancer cells,
resulting in growth p romotion [47-49]. The fact that
multiple perturbed pathways are related to cell growth
is precisely what is expected for transformed cells.
Hung et al. Genome Biology 2010, 11:R23
/>Page 8 of 16
Table 3 Ten highest TIF genes in the small cell lung cancer dataset
Gene TIF t-score (P-
value)
KEGG annotation GO annotation (evidence code
a
)
SPCS1 1.33 3.87 (0.0001) Lysine degradation
Biotin metabolism
Function:
Molecular_function (ND)
Process:
Proteolysis (TAS)
BTD 1.33 5.60 (2e-8) Biotin metabolism Function:
Biotin carboxylase activity (TAS)
Process:
Central nervous system development (TAS)
Epidermis development (TAS)
SKP2 1.33 10.60 (3e-26) Cell cycle
Ubiquitin mediated proteolysis
Pathways in cancer
Small cell lung cancer
Function:
Protein binding (IPI)
Process:
G1/S transition of mitotic cell cycle (TAS)
Cell proliferation (TAS)
CKS1B 1.33 5.31 (1e-7) Pathways in cancer
Small cell lung cancer
Process:
Cell adhesion (NAS)
NFKB1 1.29 5.69 (1e-8) MAPK signaling pathway
Apoptosis
Toll-like receptor signaling pathway
T cell receptor signaling pathway
B cell receptor signaling pathway
Adipocytokine signaling pathway
Epithelial cell signaling in Helicobacter pylori
infection
Pathways in cancer
Pancreatic cancer
Prostate cancer
Chronic myeloid leukemia
Acute myeloid leukemia
Small cell lung cancer
Function:
Promoter binding (IDA)
Protein binding (IPI)
Transcription factor activity (TAS)
Process:
Anti-apoptosis (TAS)
Apoptosis (IEA)
Inflammatory response (TAS)
Negative regulation of cellular protein metabolic process (IC)
Negative regulation of cholesterol transport (IC)
Negative regulation of IL-12 biosynthetic process (IEA)
Negative regulation of specific transcription from RNA polymerase II
promoter (IC)
Negative regulation of transcription, DNA-dependent (IEA)
Positive regulation of foam cell differentiation (IC)
Positive regulation of lipid metabolic process (IC)
Positive regulation of transcription (NAS)
IL1R1 1.29 11.07 (2e-28) MAPK signaling pathway
Cytokine-cytokine receptor interaction
Apoptosis
Hematopoietic cell lineage
Function:
Interleukin-1, Type I, activating receptor activity (TAS)
Platelet-derived growth factor receptor binding (IPI)
Protein binding (IPI)
Transmembrane receptor activity (TAS)
Process:
Cell surface receptor linked signal transduction (TAS)
FCGR2B 1.29 7.36 (2e-13) B cell receptor signaling pathway
Systemic lupus erythematosus
Function:
Protein binding (IPI)
Process:
Immune response (TAS)
Signal transduction (TAS)
INPP5D 1.29 12.69 (7e-37) Phosphatidylinositol signaling system
B cell receptor signaling pathway
Fc epsilon RI signaling pathway
Insulin signaling pathway
Function:
Inositol-polyphosphate 5-phosphatase activity (TAS)
Protein binding (IPI)
Process:
Phosphate metabolic process (TAS)
Signal transduction (TAS)
ST3GAL4 1.29 5.07 (4e-7) Glycosphingolipid biosynthesis - lacto and
neolacto series
Function:
Beta-galactoside alpha-2,3-sialyltransferase activity (TAS)
BAAT 1.29 0.52 (0.60) Bile acid biosynthesis
Taurine and hypotaurine metabolism
Biosynthesis of unsaturated fatty acids
Process:
Bile acid metabolic process (TAS)
Digestion (TAS)
Glycine metabolic process (TAS)
a
Evidence codes defined by GO: ND (No biological Data available), EXP (Inferred from Experiment), IC (Inferred by Curator), IDA (Inferred from Direct Assay), IEA
(Inferred from Electronic Annotation), IEP (Inferred from Expression Pattern), IPI (Inferred from Physical Interaction), NAS (Non-trac eable Author Statement), and
TAS (Traceable Author Statement).
Hung et al. Genome Biology 2010, 11:R23
/>Page 9 of 16
Our results also show enrichment of differentia lly
expressed genes in the basal cell carcinoma pathway,
suggesting possible co-morbidity of basal cells and lung
cancer. As this connection is not an intuitiv e one, we
examined the genes with high TIF scores, and found
that they were clustered in the Hedgehog and Wnt sig-
naling pathways – both developmental pathways that,
when inappropriately activated, contribute to tumor pro-
gression. Several of the key in ducers of the Hedgehog
signaling pathway, GLI1, GLI2 and GLI3,haveelevated
TIF scores (1.12, 1.12, and 1.14, respectively). This path-
way is important in proliferation and growth (Figure 1h)
and GLI1 has been implicated in ba sal cell carcinoma in
mice [50]; more generally, abnormal activity of hedge-
hog-GLI is associated with a variety of tumor types [51].
The coexistence of basal cell carcinoma and metastatic
small cell lung cancer has been reported [52], although
without a pathway level connection (Figure 1h).
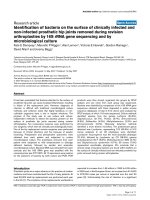
Although the small cell lung cancer pathway can be
identified by either PWEA or the WKS test, the distri-
bution of high TIF genes provides additional informa-
tion. While the samples were primary small cell lung
cancer, the genes with high TIF scores cluster mainly
between the primary and metastatic stages (Figure 3).
Since lung cancer often metastasizes, the possible pre-
sence of tissue suggesting metastasis i s not surprising,
and illustrates the information content in TIF scores.
Application to other datasets
In order to demonstrate the general utility of the
method, we applied PWEA t o four addit ional data sets
that represent diverse biological processes: ovarian
endometriosis [53], rheumatoid arthritis [54], Parkin-
son’s disease [55], and sex [6]. The pathways discov-
ered by PWEA on these additional data sets are listed
in Tables S1 and S3 in Additional file 1. For the ovar-
ian endometriosis dataset, PWEA reported all 33 path-
ways found by GSEA and 9 additional pathways.
Published literature supports some of the newly identi-
fied pathways, including complement and coagulation
cascades [56], purine metabolism [57] and sphingolipid
metabolism [58]. For the rheumatoid arthritis dataset,
GSEA found no pathways, while PWEA found the
antigen p rocessing and presentation pathway, reflecting
the autoimmune nature of rheumatoid arthritis [59].
For the Parkinson’s disease dataset, both PWEA and
GSEA found only the vascular endothelial growth fac-
tor signaling pathway [60], which has been suggested
to mediate mechanisms r elated to neuroprotection in
rats with Parkinson’s disease. In the sex dataset,
PWEA and GSEA correctly report no pathways, indi -
cating no significant difference between males and
females. In general, PWEA discovered all pathways
found by GSEA and uncovered additional biologically
relevant pathways.
Table 4 Pathways from the small cell lung cancer dataset found exclusively by PWEA
Pathway Size DE
fraction
a
Type Possible relation to the cancer Reference
GnRH signaling pathway 78 37% Endocrine system Negative autocrine regulator [43,79]
Complement and coagulation
cascades
56 54% Immune system Inflammation
Metastatic and invasive properties
[80]
MAPK signaling pathway 199 38% Signal transduction Cell growth -
Fc epsilon RI signaling pathway 63 44% Immune system Angiogenesis
Inflammation
[37,41,42]
Apoptosis 67 34% Cell growth and death Apoptosis -
ABC transporters 34 24% Membrane transport Drug resistance [81]
Jak-STAT signaling pathway 93 37% Signal transduction Cell growth [47-49]
Drug metabolism - cytochrome
P450
41 51% Xenobiotics biodegradation and
metabolism
Anticancer drugs topotecan and etoposide [75]
Drug metabolism - other
enzymes
28 46% Xenobiotics biodegradation and
metabolism
Anticancer drug irinotecan [75]
Histidine metabolism 24 42% Amino acid metabolism Nutrition intake.
Small cell lung cancer marker, DDC involved.
[82,83]
Tryptophan metabolism 36 39% Amino acid metabolism As above [82,83]
Phenylalanine metabolism 13 54% Amino acid metabolism As above [82,83]
Fatty acid metabolism 37 38% Lipid metabolism Apoptosis.
Therapeutic target
[84,85]
Basal cell carcinoma 36 17% Disease Proliferation invasion through hedgehog
signaling pathway
-
a
DE fraction is the fraction of genes that show differential expression with P < 0.05 using a two-tailed t-test. DDC: enzymatic neuroendocrine markers L-DOPA
decarboxylase.
Hung et al. Genome Biology 2010, 11:R23
/>Page 10 of 16
Discussion and conclusions
Pathway enrichment analysis has been introduced as a
method to interpret differential expression using not only
a priori defined gene sets, but also the topological proper-
ties of the surrounding network. PWEA uses gene sets
from the KEGG database to compute a TIF that describes
the average mutual influence of neighboring genes within
a pathway, including the effects of genetic buffering.
Because the TIF is c omputed for one pathway at a time,
PWEA cannot detect genetic buffering exerted by genes
from outsi de a give n pathway [6 1]; nor can any existing
gene set analysis method. The calculation of TIF largely
depends on the correlation of the expression levels of
neighboring genes, which can be affected by small sample
size. Moreover, if genes, or topological relationships
between genes, are missing from the a priori defined gene
sets used with PWEA, the method may fail to accurately
assign statistical significance to some pathways. Any
method attempting to interpret microarray data using a
priori defined gene sets, however, faces a similar challenge.
Althoug h genetic buffering relationships are not expli-
citly a nnotated in KEGG gene set topology, as they are
in Figure S1b in Additional file 1, PWEA uses TIF to
approximate their effects. Genes with low TIF values
may have their influence in the network reduced by
genetic buffering effects or by the incompleteness of the
topology. TIF measures the effects of pathway topology
on the biological function of individual genes. Genes
receive a higher TIF if they are connected to other cor-
related differential ly expressed genes nearby, regardless
of the direction of thos e connections. PWEA does not,
at present, take account of directionality. In principal,
PWEAmaybeappliedinavarietyofcontexts:givenas
input a score (r) for each gene with signature (pheno-
type), and the corresponding networks (pathways),
PWEA can determine a significance value. Finally, by
using the WKS framework, PWEA reduces to GSEA
when topological information is absent, which means
that PWEA is also applicable to GO enrichment analysis
or any other predefined gene sets.
Figure 3 TIF scores for genes in the KEGG small cell lung cancer pathway. The identification of genes associated w ith pri mary and
metastatic stages is consistent with the tissue of origin being stage heterogeneous, and not purely primary.
Hung et al. Genome Biology 2010, 11:R23
/>Page 11 of 16
When applied to two cancer datasets, PWEA has
shown a high specificity and ability to discover per-
turbed pathways. Examination of the pathways discov-
ered by PWEA reveals that most are consistent with
previously reported experimental findings. As would be
expected of any method designed to aid in the interpre-
tation of expression data, the pathways reported in
PWEA give insights into the nature of the different
types of cancer that were examined.
One of the potential problems with the method pre-
sented here is the requirement for accurate topology to
calculate TIF scores. Pathways with missing genes or
incomplete gene topology can lead to dramatically
reduced TIF scores; gene set incompleteness can
account for this behavior. Inde ed, this feature of PWEA
might be used in the future to aid in the refinement of
existing pathway topologies.
It has become clear that pathways rather than indivi-
dual genes are essential in understanding carcinoma
[62,63]. PWEA has been shown to be effective at disco-
vering biologically relevan t pathways in cancers, making
it a useful addition to the growing library of techniques
for interpreting molecular profiling data.
Materials and methods
PWEA requires three inputs: the expression profiles of
two p henotypes, a list of gene sets, and their topology.
Inthisstudy,thegenesetsaretakenfromtheKEGG
database [64] as of April 2009: the gene files specify
genes in a pathway and the map files encode topology,
which in this case comprises the molecular interactions
dictated by the pathway. In total, 201 KEGG pathways
were included. Although we use KEGG pathways for
convenient illustration, pathway data from other sources
may also be annotated in the KEGG markup language
(KGML) [65].
We denote the genes in pathway K by ‘P
K
’,andall
genes not in pathway K by ‘Not P
K
’.
The procedure consists of six steps (Figure 4).
Step 1
Transform normalized expression levels into an expres-
sion matrix, and phenotypes into a signature vector,
with genes corresponding to the rows and phenotypes
corresponding to the columns of the e xpression matrix.
Parse gene-set and map-files of KEGG pathways. Some
nodes of KEGG pathways denote protein complexes or
families. The corresponding genes are parsed separately
and each is assigned the same connectivity and topologi-
cal location as the parent node.
Step 2
For a pathway K, compute a TIF score for each gene in
P
K
. TIF is defined as the average of the mutual
influence, Ψ, with all other reachable genes in the path-
way. Ψ
ij
is used to evaluate the influence between the
ith gene and the jth gene in P
K
, according to both the
absolute value of the correlation of their expression pat-
terns and their topological distances. Ψ
ij
is defined as:
ij
f
e
ij
where f
ij
= d
ij
/|c
ij
|, d
ij
is the shortest distance between
gene i and g ene j calculated using the Floyd-Warshall
algorithm [66] (with d
ii
=0),andc
ij
is the Pearson cor-
relation c oefficient between gene i and gene j based on
their expression profiles over both normal and diseased
tissues (also see the Results section). The TIF for a gene
i is defined by the geometric mean of all influence func-
tions Ψ
ij
inagivenpathwaythatinvolvegenei and
satisfy Ψ
ij
> a:
TIF
N
ff
iij
j
ji
n
ij
exp ln
1
1
where:
(ln)
ln
ln ,
f
f
f
ij
ij
ij
1
0
and:
Nf
ij
j
ji
n
ln
1
The significance threshold, a, is used to control the
contribution that gene j makes to TI F
i
.Notethat
shorter d istances make an exponentially greater contri-
bution to the mutual influence (and TIF) than do longer
distances. The parameter a is used to control the sensi-
tivity and selectivity of the TIF. After experimenting
using the datasets studied in this report, the choice of a
= 0.05 was found to represent a good apparent balance
between sensitivity and selectivity. This parameter
remains adjustable for future applications, however.
Step 3
For all other genes from the ‘Not P
K
’ set, their TI F score
is computed. Since topological information of genes from
the ‘Not P
k
’ set is not available in pathway k,weusethe
cent ral limit theorem to impute Ψ and TIF for each gene
i. This procedure is theoretically sound, since the index
of TIF score is actually an average of Ψ, which should fol-
low the t heory. (In practice, the imputations are done
after all TIFs from all pathways are computed; that is,
using the mean and variance from all pathways as the
Hung et al. Genome Biology 2010, 11:R23
/>Page 12 of 16
parameters for the background distribution of Ψ and TIF,
not imputed just from one pathway. This sampling miti-
gates the bias of imputation when the size of the gene set
is too small.) PWEA also measures the possibility of pas-
sing θ (i.e. having f
ij
≤ -ln a in the step function θ defined
in Equation 4), and applies imputation only when a pass
event happens. This is to m aintain the distribution of all
genes from being artificially altered after a pplying TIF,
which is very likely to occur when it is applied only to
genes in P
K
having topology. TIF scores for genes from
the ‘Not P
K
’ set is important for fair ranking to avoid arti-
ficial bias toward genes in P
K
.
Step 4
Calculate the statistical significance according to the
WKS test. First, rank all genes by r
j
1+TIF
,wherer
j
is
the absolute value of the t-score (by t-test) of gene j.
The t-test is performed on each gene to compare the
expression levels between normal and disease samples.
The cumulative distribution functions (CDFs) of P
k
and
Not P
k
at position i in the rank can be written as:
CDF i
N
k
r
Pj
TIF
ji
k
j
()
1
1
and:
CDF i
N
Not
ku
Not P
ki
k
P
()
1
where
Nr
kj
TIF
j
j
1
and j is the index of all genes
belonging to P
k
.
N
Not P
k
is the number of genes belong-
ing to Not P
k
and k is the index of all genes belonging
to Not P
k
. The statistical significance for rejection of the
Figure 4 Algorithmic scheme of PWEA. In step 1, two different colors (yellow and orange) in the signature vector indicate two phenotypes
(for example, normal and cancer). Blue rectangles in the gene list vector indicate genes in a particular pathway P
k
. For a pathway k, the
expression profiles are categorized into two groups: P
k
(blue) and its complement, ‘Not P
k
’ (cyan). In step 2 the TIF scores for genes in P
k
are
calculated. In step 3, TIF scores of the genes in ‘Not P
k
’ set is computed. In step 4, the maximum deviation (MD) between two cumulative
distribution functions is computed. After calculating MD for each of n iterations of phenotype shuffling, the fraction of occurrences of shuffled
MDs ≥ the original MD is the P-value of P
k
. In step 5, after all pathways have been tested, FDR is used to correct for multiple testing. In step 6,
results and a KEGG markup language topology file for visualization in visANT [68] are the final output. CDF, cumulative distribution function.
Hung et al. Genome Biology 2010, 11:R23
/>Page 13 of 16
null hypothesis is determined by comparing the maxi-
mum deviation (MD) of two cumulative distribution
functions following n iterations of phenotype shuffling.
Each randomly generated gene set for which the maxi-
mum deviation is higher than theoriginaldatawillbe
counted, and after n iterations, the P-value is computed.
In this work, n is set at 5,000 times.
Step 5
After the P-values for all pathways are computed and
the pathways have been ranked in ascending order,
PWEA computes the FDR to correct for multiple testing
[67]. Specifically, FDR = P × m/k,wherem is the total
number of pathways and k is the rank of the pathway
under consideration.
Step 6
A plain text file and a map file in KEGG markup lan-
guage are produced. The map file represents the score
of each gene in a color heatmap using the visANT soft-
ware [68] (Figure S4 in Additional file 1).
The number of iterations, n, in step 4 must be suffi-
ciently large, since PWEA simulates the background by
random shuffling and the results may be biased if the
sampling is insufficient. PWEA uses the absolute (that
is, unsigned) metric when ranking genes. Use of an
unsigned metric is important in many cases, especially
KEGG pathways, which consist of multiple regulatory
interactions. The signed metric used in the WKS test is
designed for gene sets, such as chromosome segments
that are expected to be up- or down-regulated under a
given conditio n. Using an absolute metric can improve
the clustering of high scoring genes and increase sensi-
tivity. The parameter a, which appears in the TIF,can
be adjusted by the user. Figure S6 in Additional file 1
demonstrates how the number of exclusively found
pathways - which implies that the sensitivity changes -
depends upon a. It can be seen that when a is large
enough, PWEA reduces to GSEA, since TIF becomes
zero and no weighting is applied.
PWEA has been implemented in a portable C++ pack-
age, and is freely available for download at [69]. The
computing time i s linear in the number of pathways,
genes, and iterations of the permutation test. In this
study, it took approximately 3 hours on one Sun Micro-
systems AMD 64 Opteron processor with 1 GB RAM
for 201 pathways and 1,000 iterations for a dataset with
about 10,000 genes. When a very large number of path-
ways and/or iterations must be carried out, a parallel
version of PWEA, written with MPI [70], is available on
the website above. The CPU time scales approximately
linearly with the number of processors used. The output
from PWEA can be visualized using visANT [71], which
can give additio nal insight in to the distri bution of the
high scoring genes.
Additional file 1: A Word document containing supplementary
materials. Background knowledge of genetic buffering effect; comparison
between different enrich ment approaches; supplementary tables and
figures.
Additional file 2: A zip file containing the simulation output files of six
test sets.
Abbreviations
AA: arachidonic acid; ALS: amyotrophic lateral sclerosis; COX: cyclooxygenase;
EET: cis-epoxyeicosatrienoic acid; FDR: false discovery rate; GEO: Gene
Expression Omnibus; GnRH: gonadotropin-releasing hormone; GO: Gene
Ontology; GSEA: gene set enrichment analysis; IL: interleukin; KEGG: Kyoto
Encyclopaedia of Genes and Genomes; K-S test: Kolmogorov-Smirnov
statistic; MAPK: mitogen-activated protein kinase; PI3K: phosphoinositide 3-
kinase; PWEA: pathway enrichment analysis; ROBO: roundabout receptor; TIF:
topological influence factor; TNF: tumor necrosis factor; WKS: weighted
Kolmogorov-Smirnov statistic.
Acknowledgements
This project was partially funded by NIH grants HG004561, GM080625,
RR022971, and DA19362.
Author details
1
Bioinformatics Program, Boston University, 24 Cummington Street, Boston,
MA 02215, USA.
2
Department of Biochemistry and Molecular Pharmacology
and Program in Bioinformatics and Integrative Biology, University of
Massachusetts Medical School, 364 Plantation Street, Worcester, MA 01605,
USA.
3
Department of Biomedical Engineering, 44 Cummington Street,
Boston University, Boston, MA 02215, USA.
Authors’ contributions
JHH designed and implemented the whole methodology and the
computation framework. TWW provided constructive discussions, refinement
of the formula and revised the manuscript. THY provided considerable
statistical advice. ZH provided constructive discussions. ZW monitored the
whole framework and revised the manuscript. CD directed the whole
project, revised the manuscript, and is Principal Investigator on the NIH
grant that funded the project. All the authors have read and agreed to the
manuscript.
Received: 26 October 2009 Revised: 5 January 2010
Accepted: 26 February 2010 Published: 26 February 2010
References
1. Goeman JJ, Buhlmann P: Analyzing gene expression data in terms of
gene sets: methodological issues. Bioinformatics 2007, 23:980-987.
2. Eichler GS, Reimers M, Kane D, Weinstein JN: The LeFE algorithm:
embracing the complexity of gene expression in the interpretation of
microarray data. Genome Biol 2007, 8:R187.
3. Fujita A, Gomes LR, Sato JR, Yamaguchi R, Thomaz CE, Sogayar MC,
Miyano S: Multivariate gene expression analysis reveals functional
connectivity changes between normal/tumoral prostates. BMC Syst Biol
2008, 2:106.
4. Pavlidis P, Lewis DP, Noble WS: Exploring gene expression data with class
scores. Pac Symp Biocomput 2002, 474-485.
5. Mootha VK, Lindgren CM, Eriksson KF, Subramanian A, Sihag S, Lehar J,
Puigserver P, Carlsson E, Ridderstrale M, Laurila E, Houstis N, Daly MJ,
Patterson N, Mesirov JP, Golub TR, Tamayo P, Spiegelman B, Lander ES,
Hirschhorn JN, Altshuler D, Groop LC: PGC-1alpha-responsive genes
involved in oxidative phosphorylation are coordinately downregulated
in human diabetes. Nat Genet 2003, 34 :267-273.
6. Subramanian A, Tamayo P, Mootha VK, Mukherjee S, Ebert BL, Gillette MA,
Paulovich A, Pomeroy SL, Golub TR, Lander ES, Mesirov JP: Gene set
Hung et al. Genome Biology 2010, 11:R23
/>Page 14 of 16
enrichment analysis: a knowledge-based approach for interpreting
genome-wide expression profiles. Proc Natl Acad Sci USA 2005,
102:15545-15550.
7. Rahnenfuhrer J, Domingues FS, Maydt J, Lengauer T: Calculating the
statistical significance of changes in pathway activity from gene
expression data. Stat Appl Genet Mol Biol 2004, 3:Article16.
8. Liu M, Liberzon A, Kong SW, Lai WR, Park PJ, Kohane IS, Kasif S: Network-
based analysis of affected biological processes in type 2 diabetes
models. PLoS Genet 2007, 3:e96.
9. Draghici S, Khatri P, Tarca AL, Amin K, Done A, Voichita C, Georgescu C,
Romero R: A systems biology approach for pathway level analysis.
Genome Res 2007, 17:1537-1545.
10. Dittrich MT, Klau GW, Rosenwald A, Dandekar T, Muller T: Identifying
functional modules in protein-protein interaction networks: an
integrated exact approach. Bioinformatics 2008, 24:i223-231.
11. Ulitsky I, Shamir R: Detecting pathways transcriptionally correlated with
clinical parameters. Comput Syst Bioinformatics Conf 2008, 7:249-258.
12. Keller A, Backes C, Gerasch A, Kaufmann M, Kohlbacher O, Meese E,
Lenhof HP: A novel algorithm for detecting differentially regulated paths
based on gene set enrichment analysis. Bioinformatics 2009, 25:2787-2794.
13. Ackermann M, Strimmer K: A general modular framework for gene set
enrichment analysis. BMC Bioinformatics 2009, 10:47.
14. Dennis G Jr, Sherman BT, Hosack DA, Yang J, Gao W, Lane HC, Lempicki RA:
DAVID: Database for Annotation, Visualization, and Integrated Discovery.
Genome Biol 2003, 4:P3.
15. Gene Expression Omnibus (GEO). [ />16. Hong Y, Ho KS, Eu KW, Cheah PY: A susceptibility gene set for early onset
colorectal cancer that integrates diverse signaling pathways: implication
for tumorigenesis. Clin Cancer Res 2007, 13:1107-1114.
17. Moxley R, Day E, Brown K, Mahnke M, Zurini M, Schmitz R, Jones CE,
Jarai G: Cloning and pharmacological characterization of CCR7, CCL21
and CCL19 from Macaca fascicularis . Eur J Pharm Sci 2009, 37:264-271.
18. Yu S, Duan J, Zhou Z, Pang Q, Wuyang J, Liu T, He X, Xinfa L, Chen Y: A
critical role of CCR7 in invasiveness and metastasis of SW620 colon
cancer cell in vitro and in vivo. Cancer Biol Ther 2008, 7:1037-1043.
19. Pechlivanis S, Bermejo JL, Pardini B, Naccarati A, Vodickova L, Novotny J,
Hemminki K, Vodicka P, Forsti A: Genetic variation in adipokine genes and
risk of colorectal cancer. Eur J Endocrinol 2009, 160
:933-940.
20. Monjazeb AM, High KP, Connoy A, Hart LS, Koumenis C, Chilton FH:
Arachidonic acid-induced gene expression in colon cancer cells.
Carcinogenesis 2006, 27:1950-1960.
21. Wu S, Moomaw CR, Tomer KB, Falck JR, Zeldin DC: Molecular cloning and
expression of CYP2J2, a human cytochrome P450 arachidonic acid
epoxygenase highly expressed in heart. J Biol Chem 1996, 271:3460-3468.
22. Spector AA, Fang X, Snyder GD, Weintraub NL: Epoxyeicosatrienoic acids
(EETs): metabolism and biochemical function. Prog Lipid Res 2004,
43:55-90.
23. Jiang JG, Chen CL, Card JW, Yang S, Chen JX, Fu XN, Ning YG, Xiao X,
Zeldin DC, Wang DW: Cytochrome P450 2J2 promotes the neoplastic
phenotype of carcinoma cells and is up-regulated in human tumors.
Cancer Res 2005, 65:4707-4715.
24. Arakawa H: Netrin-1 and its receptors in tumorigenesis. Nat Rev Cancer
2004, 4:978-987.
25. Arakawa H: p53, apoptosis and axon-guidance molecules. Cell Death Differ
2005, 12:1057-1065.
26. Narayan G, Goparaju C, Arias-Pulido H, Kaufmann AM, Schneider A, Durst M,
Mansukhani M, Pothuri B, Murty VV: Promoter hypermethylation-mediated
inactivation of multiple Slit-Robo pathway genes in cervical cancer
progression. Mol Cancer 2006, 5:16.
27. Dallol A, Morton D, Maher ER, Latif F: SLIT2 axon guidance molecule is
frequently inactivated in colorectal cancer and suppresses growth of
colorectal carcinoma cells. Cancer Res 2003, 63:1054-1058.
28. Grone J, Doebler O, Loddenkemper C, Hotz B, Buhr HJ, Bhargava S: Robo1/
Robo4: differential expression of angiogenic markers in colorectal
cancer. Oncol Rep 2006, 15:1437-1443.
29. Li VS, Yuen ST, Chan TL, Yan HH, Law WL, Yeung BH, Chan AS, Tsui WY,
So S, Chen X, Leung SY: Frequent inactivation of axon guidance molecule
RGMA in human colon cancer through genetic and epigenetic
mechanisms. Gastroenterology 2009, 137:176-187.
30. Chedotal A, Kerjan G, Moreau-Fauvarque C: The brain within the tumor:
new roles for axon guidance molecules in cancers. Cell Death Differ 2005,
12:1044-1056.
31. Cortina C, Palomo-Ponce S, Iglesias M, Fernandez-Masip JL, Vivancos A,
Whissell G, Huma M, Peiro N, Gallego L, Jonkheer S, Davy A, Lloreta J,
Sancho E, Batlle E: EphB-ephrin-B interactions suppress colorectal cancer
progression by compartmentalizing tumor cells. Nat Genet 2007,
39:1376-1383.
32. Miao H, Wei BR, Peehl DM, Li Q, Alexandrou T, Schelling JR, Rhim JS,
Sedor JR, Burnett E, Wang B: Activation of EphA receptor tyrosine kinase
inhibits the Ras/MAPK pathway. Nat Cell Biol 2001, 3:527-530.
33. Linghu B, Snitkin ES, Hu Z, Xia Y, Delisi C: Genome-wide prioritization of
disease genes and identification of disease-disease associations from an
integrated human functional linkage network. Genome Biol 2009,
10:R91.
34. Hileman EA, Achanta G, Huang P: Superoxide dismutase: an emerging
target for cancer therapeutics. Expert Opin Ther Targets 2001, 5:697-710.
35. Jones MH, Virtanen C, Honjoh D, Miyoshi T, Satoh Y, Okumura S,
Nakagawa K, Nomura H, Ishikawa Y: Two prognostically significant
subtypes of high-grade lung neuroendocrine tumours independent of
small-cell and large-cell neuroendocrine carcinomas identified by gene
expression profiles. Lancet 2004, 363:775-781.
36. Akimoto M, Mishra K, Lim KT, Tani N, Hisanaga SI, Katagiri T, Elson A,
Mizuno K, Yakura H: Protein tyrosine phosphatase epsilon is a negative
regulator of FcepsilonRI-mediated mast cell responses. Scand J Immunol
2009, 69:401-411.
37. Kopec A, Panaszek B, Fal AM: Intracellular signaling pathways in IgE-
dependent mast cell activation. Arch Immunol Ther Exp (Warsz) 2006,
54:393-401.
38. Galli SJ, Grimbaldeston M, Tsai M: Immunomodulatory mast cells:
negative, as well as positive, regulators of immunity. Nat Rev Immunol
2008, 8:478-486.
39. Colotta F, Allavena P, Sica A, Garlanda C, Mantovani A: Cancer-related
inflammation, the seventh hallmark of cancer: links to genetic instability.
Carcinogenesis 2009, 30:1073-1081.
40. Mantovani A, Allavena P, Sica A, Balkwill F: Cancer-related inflammation.
Nature 2008, 454:436-444.
41. Sparmann A, Bar-Sagi D: Ras-induced interleukin-8 expression plays a
critical role in tumor growth and angiogenesis. Cancer Cell 2004,
6:447-458.
42. Sumimoto H, Imabayashi F, Iwata T, Kawakami Y: The BRAF-MAPK
signaling pathway is essential for cancer-immune evasion in human
melanoma cells. J Exp Med 2006, 203:1651-1656.
43. Harrison GS, Wierman ME, Nett TM, Glode LM: Gonadotropin-releasing
hormone and its receptor in normal and malignant cells. Endocr Relat
Cancer 2004, 11:725-748.
44. Gropp C, Luster W, Havemann K: Ectopic hormones in lung cancer. Ergeb
Inn Med Kinderheilkd 1984, 53:133-164.
45. Taggart DP, Gray CE, Bowman A, Faichney A, Davidson KG: Serum
androgens and gonadotrophins in bronchial carcinoma. Respir Med 1993,
87:455-460.
46. Blackman MR, Weintraub BD, Rosen SW, Harman SM: Comparison of the
effects of lung cancer, benign lung disease, and normal aging on
pituitary-gonadal function in men. J Clin Endocrinol Metab 1988, 66:88-95.
47. Park JI, Strock CJ, Ball DW, Nelkin BD: The Ras/Raf/MEK/extracellular signal-
regulated kinase pathway induces autocrine-paracrine growth inhibition
via the leukemia inhibitory factor/JAK/STAT pathway. Mol Cell Biol 2003,
23:543-554.
48. Ravi RK, Weber E, McMahon M, Williams JR, Baylin S, Mal A, Harter ML,
Dillehay LE, Claudio PP, Giordano A, Nelkin BD, Mabry M: Activated Raf-1
causes growth arrest in human small cell lung cancer cells. J Clin Invest
1998, 101:153-159.
49. Ravi RK, Thiagalingam A, Weber E, McMahon M, Nelkin BD, Mabry M: Raf-1
causes growth suppression and alteration of neuroendocrine markers in
DMS53 human small-cell lung cancer cells. Am J Respir Cell Mol Biol 1999,
20:543-549.
50. Nilsson M, Unden AB, Krause D, Malmqwist U, Raza K, Zaphiropoulos PG,
Toftgard R: Induction of basal cell carcinomas and trichoepitheliomas in
mice overexpressing GLI-1. Proc Natl Acad Sci USA 2000, 97:3438-3443.
Hung et al. Genome Biology 2010, 11:R23
/>Page 15 of 16
51. Ruiz i Altaba A, Sanchez P, Dahmane N: Gli and hedgehog in cancer:
tumours, embryos and stem cells. Nat Rev Cancer 2002, 2:361-372.
52. Chikkamuniyappa S: Coexisting basal cell carcinoma and metastatic small
cell carcinoma of lung. Dermatol Online J 2004, 10:18.
53. Hever A, Roth RB, Hevezi P, Marin ME, Acosta JA, Acosta H, Rojas J,
Herrera R, Grigoriadis D, White E, Conlon PJ, Maki RA, Zlotnik A: Human
endometriosis is associated with plasma cells and overexpression of B
lymphocyte stimulator. Proc Natl A cad Sci USA 2007, 104:12451-12456.
54. Ungethuem U, Häupl T, Koczan D, Huber H, von Helversen T, Ruiz P, Witt H,
Drungowski M, Zacher HJ, Seyfert C, Neidel J, Krenn V, Burmester GR,
Thiesen HJ, Lehrach H, Bläß S: RA-specific expression profiles and new
candidate genes. Arthritis Res Ther 2003, 5(Suppl 1):81.
55. Lesnick TG, Papapetropoulos S, Mash DC, Ffrench-Mullen J, Shehadeh L, de
Andrade M, Henley JR, Rocca WA, Ahlskog JE, Maraganore DM: A genomic
pathway approach to a complex disease: axon guidance and Parkinson
disease. PLoS Genet 2007, 3:e98.
56. Lebovic DI, Mueller MD, Taylor RN: Immunobiology of endometriosis. Fertil
Steril 2001, 75:1-10.
57. Kao LC, Germeyer A, Tulac S, Lobo S, Yang JP, Taylor RN, Osteen K,
Lessey BA, Giudice LC: Expression profiling of endometrium from women
with endometriosis reveals candidate genes for disease-based
implantation failure and infertility. Endocrinology 2003, 144:2870-2881.
58. Watterson K, Sankala H, Milstien S, Spiegel S: Pleiotropic actions of
sphingosine-1-phosphate. Prog Lipid Res 2003, 42:344-357.
59. Lebre MC, Tak PP: Dendritic cells in rheumatoid arthritis: Which subset
should be used as a tool to induce tolerance? Hum Immunol 2009,
70:321-324.
60. Yasuhara T, Shingo T, Muraoka K, Kameda M, Agari T, Wen Ji Y, Hayase H,
Hamada H, Borlongan CV, Date I: Neurorescue effects of VEGF on a rat
model of Parkinson’s disease. Brain Res 2005, 1053:10-18.
61. Hartman JLt, Garvik B, Hartwell L: Principles for the buffering of genetic
variation. Science 2001, 291:1001-1004.
62. Wood LD, Parsons DW, Jones S, Lin J, Sjoblom T, Leary RJ, Shen D,
Boca SM, Barber T, Ptak J, Silliman N, Szabo S, Dezso Z, Ustyanksky V,
Nikolskaya T, Nikolsky Y, Karchin R, Wilson PA, Kaminker JS, Zhang Z,
Croshaw R, Willis J, Dawson D, Shipitsin M, Willson JK, Sukumar S, Polyak K,
Park BH, Pethiyagoda CL, Pant PV, et al: The genomic landscapes of
human breast and colorectal cancers. Science 2007, 318:1108-1113.
63. Kinzler BVKW: Cancer genes and the pathways they control. Nature
Medicine 2004, 789-799.
64. Kanehisa M, Araki M, Goto S, Hattori M, Hirakawa M, Itoh M, Katayama T,
Kawashima S, Okuda S, Tokimatsu T, Yamanishi Y:
KEGG for linking
genomes to life and the environment. Nucleic Acids Res 2008, 36:
D480-484.
65. KGML (KEGG Markup Language). [ />66. Floyd RW: Algorithm 97: Shortest path. Commun ACM 1962, 5:345.
67. Benjamini Y, Drai D, Elmer G, Kafkafi N, Golani I: Controlling the false
discovery rate in behavior genetics research. Behav Brain Res 2001,
125:279-284.
68. Hu Z, Ng DM, Yamada T, Chen C, Kawashima S, Mellor J, Linghu B,
Kanehisa M, Stuart JM, DeLisi C: VisANT 3.0: new modules for pathway
visualization, editing, prediction and construction. Nucleic Acids Res 2007,
35:W625-632.
69. PWEA. [ />70. Dongarra JJ, Kacsuk P, Podhorszki N: Recent Advances in Parallel Virtual
Machine and Message Passing Interface: 7th European PVM/MPI Users’ Group
Meeting, Balatonfured, Hungary, September 2000 Proceedings Berlin, New
York: SpringerDongarra J, Kacsuk P, Podhorszki N 2000, [Goos G, Hartmanis
J, van Leeuwen J (Series Editors): Lecture Notes in Computer Science,
volume 1908].
71. visANT. [ />72. Neoptolemos JP, Husband D, Imray C, Rowley S, Lawson N: Arachidonic
acid and docosahexaenoic acid are increased in human colorectal
cancer. Gut 1991, 32:278-281.
73. Ye YN, Wu WK, Shin VY, Cho CH: A mechanistic study of colon cancer
growth promoted by cigarette smoke extract. Eur J Pharmacol 2005,
519:52-57.
74. Wong HP, Yu L, Lam EK, Tai EK, Wu WK, Cho CH: Nicotine promotes colon
tumor growth and angiogenesis through beta-adrenergic activation.
Toxicol Sci 2007, 97:279-287.
75. Rodriguez-Antona C, Ingelman-Sundberg M: Cytochrome P450
pharmacogenetics and cancer. Oncogene 2006, 25:1679-1691.
76. Denkert C, Budczies J, Weichert W, Wohlgemuth G, Scholz M, Kind T,
Niesporek S, Noske A, Buckendahl A, Dietel M, Fiehn O: Metabolite
profiling of human colon carcinoma-deregulation of TCA cycle and
amino acid turnover. Mol Cancer 2008, 7:72.
77. Tocchi A, Basso L, Costa G, Lepre L, Liotta G, Mazzoni G, Sita A,
Tagliacozzo S: Is there a causal connection between bile acids and
colorectal cancer? Surg Today 1996, 26:101-104.
78. Bernstein C, Bernstein H, Garewal H, Dinning P, Jabi R, Sampliner RE,
McCuskey MK, Panda M, Roe DJ, L’Heureux L, Payne C: A bile acid-induced
apoptosis assay for colon cancer risk and associated quality control
studies. Cancer Res 1999, 59
:2353-2357.
79. Emons G, Weiss S, Ortmann O, Grundker C, Schulz KD: LHRH might act as
a negative autocrine regulator of proliferation of human ovarian cancer.
Eur J Endocrinol 2000, 142:665-670.
80. Yonemori K, Kunitoh H, Sekine I: Small-cell lung cancer with
lymphadenopathy in an 18-year-old female nonsmoker. Nat Clin Pract
Oncol 2006, 3:399-403, quiz following 403
81. Boonstra R, Timmer-Bosscha H, van Echten-Arends J, Kolk van der DM,
Berg van den A, de Jong B, Tew KD, Poppema S, de Vries EG:
Mitoxantrone resistance in a small cell lung cancer cell line is associated
with ABCA2 upregulation. Br J Cancer 2004, 90:2411-2417.
82. Carney DN, Gazdar AF, Bepler G, Guccion JG, Marangos PJ, Moody TW,
Zweig MH, Minna JD: Establishment and identification of small cell lung
cancer cell lines having classic and variant features. Cancer Res 1985,
45:2913-2923.
83. Onganer PU, Seckl MJ, Djamgoz MB: Neuronal characteristics of small-cell
lung cancer. Br J Cancer 2005, 93:1197-1201.
84. Cao Y, Pearman AT, Zimmerman GA, McIntyre TM, Prescott SM: Intracellular
unesterified arachidonic acid signals apoptosis. Proc Natl Acad Sci USA
2000, 97:11280-11285.
85. Mashima T, Seimiya H, Tsuruo T: De novo fatty-acid synthesis and related
pathways as molecular targets for cancer therapy. Br J Cancer 2009,
100:1369-1372.
86. Kitami T, Nadeau JH: Biochemical networking contributes more to
genetic buffering inhuman and mouse metabolic pathways than does
gene duplication. Nat Genet 2002, 32:191-194.
doi:10.1186/gb-2010-11-2-r23
Cite this article as: Hung et al.: Identification of functional modules that
correlate with phenotypic difference: the influence of network
topology. Genome Biology 2010 11:R23.
Submit your next manuscript to BioMed Central
and take full advantage of:
• Convenient online submission
• Thorough peer review
• No space constraints or color figure charges
• Immediate publication on acceptance
• Inclusion in PubMed, CAS, Scopus and Google Scholar
• Research which is freely available for redistribution
Submit your manuscript at
www.biomedcentral.com/submit
Hung et al. Genome Biology 2010, 11:R23
/>Page 16 of 16