Báo cáo y học: "olutionary divergence in the fungal response to fluconazole revealed by soft clustering" pptx
Bạn đang xem bản rút gọn của tài liệu. Xem và tải ngay bản đầy đủ của tài liệu tại đây (1.95 MB, 12 trang )
RESEA R C H Open Access
Evolutionary divergence in the fungal response
to fluconazole revealed by soft clustering
Dwight Kuo
1†
, Kai Tan
2†
, Guy Zinman
3†
, Timothy Ravasi
1,4
, Ziv Bar-Joseph
3*
, Trey Ideker
1*
Abstract
Background: Fungal infections are an emerging health risk, especially those involving yeast that are resistant to
antifungal agents. To understand the range of mechanisms by which yeasts can respond to anti-fungals, we
compared gene expression patterns across three evolutionarily distant species - Saccharomyces cerevisiae, Candida
glabrata and Kluyveromyces lactis - over time following fluconazole exposure.
Results: Conserved and diverged expression patterns were identified using a novel soft clustering algo rithm that
concurrently clusters data from all species while incorporating sequence orthology. The analysis suggests
complementary strategies for coping with ergosterol depletion by azoles - Saccharomyc es imports exogenous
ergosterol, Candida exports fluconazole, while Kluyveromyces does neither, leading to extreme sensitivity. In support
of this hypothesis we find that only Saccharomyces becomes more azole resistant in ergosterol-supplemented
media; that this depends on sterol importers Aus1 and Pdr11; and that transgenic expression of sterol importers in
Kluyveromyces alleviates its drug sensitivity.
Conclusions: We have compared the dynamic transcriptional responses of three diverse yeast species to
fluconazole treatment using a novel clustering algorithm. This approach revealed significant divergence among
regulatory programs associated with fluconazole sensitivity. In future, such approaches might be used to survey a
wider range of species, drug concentrations and stimuli to reveal conserved and divergent molecular response
pathways.
Background
Mucosal and invasive mycoses are a major world health
problem leading to morbidity [1,2] and a mortality rate
of up to 70% in immuno compromised hosts [3]. The
most common treatment for fungal infections is the
family of chemical compounds known as the azoles,
which interfere with formation of the cell membrane by
inhibiting s ynthesis of ergoster ol [4]. However, the use
of azoles to treat a broad spectrum of fungal infections
has led to widespread azole resistance [4-9], and resis-
tance is also emerging against the limited number of
secondary compounds that are currently available
[10,11].
Thefungalresponsetoazoleshasbeenmostoften
studied in yeast [5,7,12-17], primarily through analysis
of st andard laboratory strains of Candida [12,13,18] or
Saccharomyces [14,16,17] or their resistant clinical iso-
lates [2,12,15,19]. Other studies have focused on cultures
for which drug resistance has been artificially evolved
in-vitro [15,18,20,21]. This work has revealed a number
of resistance and response mechanisms that can be
invoked to protect cells from drugs, including mutations
to drug efflux pumps or their regulators [2,12,20,21],
mutat ions to ergosterol synthesis enzymes [20], duplica-
tion of the fluconazole target Erg11 [18], and a possible
role for Hsp90 [15,22].
Although these represent a wide array of mechanisms,
it is li kely that the full range of anti-fungal resistance
pathways is even greater, for several reasons. The first
relates to genetic diversity: the number of clinical iso-
lates that have been studied to-date is relatively modest,
and resistant strains produced by artificial evolution are
only a few generations remo ved from the commo n
* Correspondence: ;
† Contributed equally
1
Departments of Bioengineering and Medicine, University of California San
Diego, 9500 Gilman Drive, La Jolla, CA 92093, USA
3
Department of Computer Science, Carnegie Mellon University, 500 Forbes
Avenue, Pittsburgh, PA 15213, USA
Full list of author information is available at the end of the article
Kuo et al. Genome Biology 2010, 11:R77
/>© 2010 Kuo et al.; licensee BioMed Central Ltd. Th is is an open access article distributed under the terms of the Creative Commons
Attribution License ( which permits unrestricted use, distribution, and repro duction in
any medium, prov ided the original work is p roperly cited.
laboratory strains used as starting material. The second
reason relates to the environment: it is very difficult to
mirror in the l aboratory the range of conditions that
must be experienced by yeast in the wild during the
evolution o f stress response pathways. Thus, an impor-
tant goal moving forward is to b etter understand the
entire pool of genotypic variation underl ying fungal
stress responses, particularly as they relate to antifungal
agents.
Towards this goal, we performed a comparative study
of t he transcriptional program activated by fluconazole
in three evolutionarily distinct yeasts: Saccharomyces
cerevisiae (Sc), Candida glabrata (Cg), and Kluyvero-
myces lactis (Kl). These spe cies were selected to provide
a survey of transcriptional networks at intermediate evo-
lutionary distance, that is, at sufficient distance to
observe evolutionary change but sufficiently close to
ensure signif icant conservation. Sc and Cg diverged
approximately 100 mill ion years ago, and both harbor
evidence of an ancient whole-genome duplication event
[23]. Cg is an established human pathogen while Sc has
been occasionally found to cause systemic infection i n
immunocompromised individuals [2]. Kl was selected as
an outgroup since its evolutionary history is clearly dis-
tinct from Sc (having diverged prior to whole-genome
duplication [24]) but its transcriptional network is sub-
stantially closer to Sc than, f or instance, is the network
of Candida albicans [25]. In addition, Sc, Cg,andKl
share functional and phenotypic characteristics (for
example, growth as haploids [26], similar codon usag e
[26]) that make them suitable for comparison.
Earlier efforts to profile e xpression across different
species have been limited to the examination of matched
conditions across two organisms [27-29] or curated
compendia of microarrays across many conditions
[24,30,31]. Such studies have previously identified tran-
scriptional mechanisms leading to large phenotypic
divergence among yeasts, often related to the whole-
genome duplication event [24,30,31]. Accordingly, we
reasoned that match ed expression time courses of three
yeasts might reveal evolutionary differences in the tran -
scriptional stress responseelicitedbyananti-fungal
drug.
Results and discussion
Kl is dramatically more sensitive to fluconazole than
other species
For each of the three species Sc, Cg, and Kl, we obtained
standard laborato ry strains for which genome sequences
were available (Materials and metho ds). We examined
the phenotypic response of these species to a range of
concentrations of fluconazole ( Additional file 1: Testing
Fluconazole Susceptibility), a triazole antifungal drug
commonly used in the trea tment and prevention of
superficial and systemic fungal inf ections [4]. We found
that Kl was approximately 70 times m ore sensitive to
fluconazole than Sc and Cg, with a 50% inhibitory con-
centration of 0.06 μg/ml versus 4.0 μg/ml for bo th Sc
and Cg (Figure S1 in Additional file 1). Cross-species
differences in sensitivity could be due to a variety of fac-
tors, including differences in membrane permeability or
drug tran sport, divergence in sequence or regulation of
the drug target Erg11, or in any of the pathways pre-
viously linked to azole resistance.
Comparative expression profiling of Sc, Cg, and Kl
While it is possible that complementary strategies might
be observed at different fluconazole dosages [20], we
exposed each species to fluconazole at its 50% inhibitory
concentration to facilitate direct comparison of the tran-
scriptional response between spec ies. We the n moni-
toredglobalmRNAexpressionlevelsat1/3,2/3,1,2,
and 4 population doubling times (Figure 1a). We also
found that sampling based on the doubling time of each
species, as opposed to absolute time measurements, led
to greater c oherence in the expression profiles across
species (Figure S2 in Additional file 1; Additional file 1:
Analysis of Doubling Time Points vs. Absolute Time
Points). Selected mRNA measurements were validated
using quantitative RT-PCR against six genes (Figure S3
in Additional file 1). We also found significant overlap
of the Sc differential ly expressed genes with several pre-
vious microarray studies and some overlap with gene
deletions conferring fluconazole sensitivity (Additional
file 1: Microarray Design and Analysis).
To compare expression profiles across species, ortho-
logous genes were defined using MultiParanoid [32]. A s
might be expected based on known phylogenetic dis-
tances [23], Cg shared more differentially expressed
genes with Sc than with Kl (Figure1b).Wealsofound
some overlap with previously published C. albicans
microarray data, especially with the functions of the
responsive genes such as those involved in ergosterol
biosynthesis and oxido-reductase activity (Additional file
1: Microarray Design and Analysis).
Soft clustering: a novel cross-species clustering algorithm
Due to factors such as measurement error and ambigu-
ity of cluster boundaries, we found that the available
clustering methods led to situations in which ortholo-
gous genes with similar expression patterns could be
misplaced into different clusters (Additional file 1: Con-
strained Clustering Algorithm). Accordingly, we devel-
oped a ‘ soft’ clustering approach that integrates
expression profiles with gene sequence orthology in a
modified k-means model. This algorithm includes an
adjustable weight that rewards ortholog co-cluste ring
(Figures 2a, b; Materials and methods; Additional file 1:
Kuo et al. Genome Biology 2010, 11:R77
/>Page 2 of 12
Cons trained Clustering Algo rithm). The term ‘soft clus-
tering’ has also previously been used in other clustering
methods to define cases in which a gene can belong to
more than one cluster rather than any constraint used
to identify clusters [12,13]. Unlike standard clustering
methods, which focus solely on cluster coherence, the
soft clustering method can simultaneously detect both
similar and divergent behavior between orthologs. For
instance, when orthologs are not co-clustered despite
the addition of a reward, onecanbeassuredthattheir
dynamic profiles truly differ. The weight W and the
number of clusters k were scanned over a range of
values (Figure 2c). We selected W=0.75 and k =17as
choices that approximately optimized the enrichment
for Gene Ontology (GO) terms (Additional file 1: Con-
strained Clus tering Algorithm; Additional file 1: Select-
ing Parameters for the Constrained Clustering Method).
We compared our soft clustering approach to addi-
tional standard clustering methods ( Figure S4a in Addi-
tional file 1). In comparison to classical k-means
(equivalent to W = 0), the fraction of co-clustered
orthologs increased from approximately 35% to 70%,
with a negligible increase in within-cluster variance (Fig-
ure 2d). For W > 0.75, we saw no improvement in the
number of enriched GO terms, a marked increase in
total cluster variance, and little improvement in the frac-
tion of co-clustered orthologs (Additional file 1:
Constrained Clustering Algorithm). Since k-means is
non-deterministic, to ensure robustness the results of 50
runs of the algorithm were used to populate a matrix
recording the fraction of times each gene pair was co-
clustered. This matrix was used as a similarity matrix
for subsequent hierarchical clustering (Figure 2e; Addi-
tional file 1: Co-clustering Matrix). The resulting 17
cross-species gene expression clusters are shown in Fig-
ure 3a, b, Figure S7 in Additional file 1, and Table S1 in
Additional file 2.
Conservation of cis-regulatory motifs across clusters
We found that two cross-species clusters (13 and 14)
were highly enriched for ergosterol biosynthetic genes
(P ≤ 10
-8
) and were coherently up- regu lated in all three
species - likely in response to ergosterol depletion.
Both clusters were also enriched for the upstream DNA-
binding motif of the sterol biosynthesis regulators
Ecm22 and Upc2 [33]. Interesti ngly, Upc2 has also been
implicated in increased fluconazole resistance in the
fungal pathogen C. albicans [34]. Rox1 motifs were
enriched in Sc and Cg but not Kl. A likely explanation
forthisdivergenceisthatRox1isarepressorof
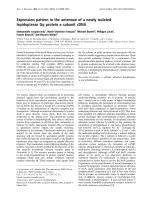
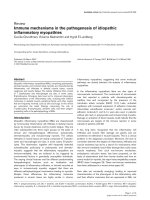
Figure 1 Differentially expressed genes. (a) Number of differentially expressed (up- and down-regulated) genes by species versus the number
of cell doublings. (b) Venn diagram showing the overlap in the sets of differentially expressed genes selected in each species at a false discovery
rate of q ≤ 0.1. The number of differentially expressed genes in each region of the Venn diagram is not identical across species, since the
number of genes that a species contributes to an orthologous group (that is, number of paralogs) can vary. Ratios in parentheses indicate the
number of differentially expressed orthologs by the total number of differentially expressed genes (not all genes possess orthologs).
Kuo et al. Genome Biology 2010, 11:R77
/>Page 3 of 12
hypoxia-induced genes, and Kl both lacks a Rox1 ortho-
log and the capacity for anaerobic growth.
Beyond the clusters representing ergosterol biosynth-
esis, we found two additional clusters (9 and 16) in which
high conservation of expression patterns, sequence
orthology, and cis-motif conservation were observed
across species. Cluster 9 was regulated by the general
stress-response transcription factors Msn2p and Msn4p
(q <10
-5
; Additional file 1: Expression Conservation of
the General Stress Response) and showed GO enrich-
men t for oxido-reductase activity (q<10
-8
) and carbohy-
drate metabolism ( q<10
-7
). Cluster 16 was enriched for
ribosomal biogenesis and assembly (q<10
-13
)with
upstream PAC [35] and RRPE motifs previously impli-
cated in regulating gene s involved in th e general stress
response and ribosomal regulation (Addit ional fil e 1:
Expression Conservation of the General Stress Response)
[28,31,35,36].
For other clusters, conserved motifs were absent, sug-
gesting divergence acro ss species. This lack of motif
conservation was particularly surprising for clusters 3, 4,
7, and 11, which contained large numbers of co-
expressed orthologous genes. On the other hand, this
finding is consistent with previous studies finding low
motif conservation [24,28,30,31]. We also found no sig-
nificant enrichment for binding sites of orthologous
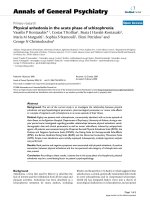
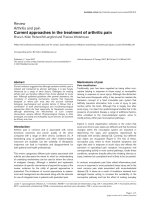
Figure 2 Soft clustering method. (a) Standard clustering based on expression only: two sets of orthologs are depicted (color represents
orthology, shape represents species) where orthologs are split between clusters 1 and 2. For illustrative purposes, only two time points (t and t
+ 1) are shown. (b) Soft clustering based on expression and orthology: dashed circles denote regions where orthologs will be co-clustered. Since
the purple square has no orthologs in cluster 1, it remains assigned to cluster 2. (c) Effect of number of clusters k and orthology weight W on
GO term enrichment. (d) The number of enriched GO terms, variance, and fraction of co-clustered orthologs for k=17 as a function of W in
comparison to randomized paralogs/orthologs. Randomization was performed as described in Additional file 1: Randomizing the Orthology
Mapping. (e) Since k-means is non-deterministic, to ensure robustness we performed 50 runs of the algorithm recording the fraction of times
each gene pair was co-clustered (including all genes from all species). This matrix was hierarchically clustered.
Kuo et al. Genome Biology 2010, 11:R77
/>Page 4 of 12
transcription facto rs (Tac1, Mrr1, Crz1) known to med-
iate fluconazole-resistance in the evolutionarily diverged
pathogen C. albicans [37].
Despite application of the soft-clust ering algorithm,
some clusters nevertheless shared significant gene
orthology (but not expression) with other clusters, such
as clusters 10 an d 15 in Figure 3a. In these cases, we
also found no conserved motifs between these clusters,
indicating both promoter and expression divergence
among orthologs in addition to species-specific motifs
(Additional file 1: Species-specific Motifs).
Co-clustering implicates both highly conserved and
divergent pathways
Next, we analyzed t he soft clusters to identify pathways
for which the fluconazole response is either highly con-
served or strikingly divergent. For this purpose, differen-
tially expressed pa thways were identified using the GO
Biological Process database [38] (Materials and meth-
ods). For each pathway, we computed the number of
orthologous gene groups for which: 1, all three species
were in the same cluster (full co-clus tering); 2, two spe-
cies were in the same cluster (partial co-clustering);
or 3, no two species were in the same cluster (no co-
clustering). The pathways with the highest percentage of
orthologs with full co-clustering are shown in Figure 4a.
The pathways with the highest percentage of orthologs
that do not co-cluster are shown in Figure 4b. Cluster-
ing results for all pathways are given in Table S2 in
Additional file 3.
By this analysi s, the most conserved pathway was
ergosterol biosynthesis, which is consist ent with our
study of conserved motifs (above). Fluconazole directly
inhibits ergosterol synthesis by targeting of Erg11, and
all species appear to respond strongly to this reduction
in ergosterol by up-regulating the enzymes required for
its novel biosynthesis. ERG11 was up-regulated early in
both Sc and Cg and lat er in Kl.SinceERG11 over-
expression is one mechanism by which yeast can over-
come fluconazole-induced growth inhibition [18], delays
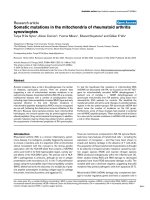
Figure 3 Cluster structure and dynamics. (a) Each of the 17 clusters appears as a bubble containing up to three colored nodes whose sizes
represent the number of genes contributed by each species. Edge thickness denotes the percent of gene orthology shared within or between
clusters, measured using the size of the intersection divided by the size of the union of the sample sets. Only significant edges (P < 0.01) are
shown. Several clusters show conserved orthology but not dynamics (for example, cluster 10 Sc, Cg with cluster 15 Kl). Note that clusters were
ordered to minimize orthology edge crossings. (b) Expression dynamics of the 17 soft clusters over time following fluconazole exposure.
Separate plots for each species can be found in Additional file 1. The width of each band corresponds to ± one standard deviation about the
mean. A selection of enriched GO terms are shown for different clusters; see Figure S11 in Additional file 1 for full GO enrichment results. The
number of genes for each species in each cluster is also shown.
Kuo et al. Genome Biology 2010, 11:R77
/>Page 5 of 12
in its induction could contribute to Kl’s greater flucona-
zole sensitivity.
The first stages of ergosterol biosynthesis are carried
out by a subset of enzymes of the isoprenoid pathway.
While most ergosterol genes were coordinately up-regu-
lated in all three species, the expression levels of isopre-
noid biosynthesis genes were strikingly divergent
(Figures 4b, d). In all eukaryotes, regulation of isopre-
noid biosynthesis is known to be complex with multiple
levels of feed back inhibition [39]. Thus, the extensive
divergence in isoprenoid biosynthesis expression sug-
gests that the regulation of this pathway has also
diverged between species.
Extensive e xpression divergence was also observed in
methionine biosynthesis and amino acid transport (Fig-
ure 4b). Curiously, many Cg methionine biosynthesis
orthologs were strongly down-regulated early in the
time-course (Figure 4e). This strong down-regulation
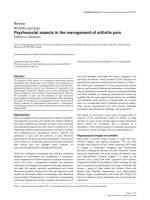
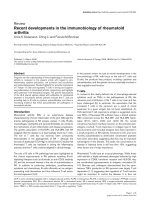
Figure 4 Pathway expression conservation and divergence. (a) Top conserved and (b) diverged pathway responses as revealed by the soft
clustering approach. Each pathway is represented by a pie with four slices - green, yellow, red, and black - denoting the percentage of
orthologs in that pathway for which all three species co-clustered, two species co-clustered, no two species co-clustered, and no species’
orthologs were differentially expressed, respectively. Pathways were defined using GO biological process annotations. (c) Schematic of ergosterol
biosynthesis, the most conserved pathway response. Interestingly, this pathway includes isoprenoid biosynthesis, for which the response was one
of the most divergent. (d) mRNA expression responses of ergosterol pathway genes are shown in order of occurrence in the pathway.
Expression levels of genes 3 to 8 (boxed, and red) corresponding to isoprenoid biosynthesis are strikingly divergent. The fluconazole target Erg11
is boxed. (e) Hierarchically clustered mRNA expression responses of methionine biosynthesis genes show extensive divergence across species.
Grey expression values denote a gene for which the species lacks an ortholog.
Kuo et al. Genome Biology 2010, 11:R77
/>Page 6 of 12
was not mirrored in Sc and Kl, which displayed diver-
gent expression responses that were not co-clustered.
Interestingly, it has been previously suggested that dif-
ferences in methionine b iosynthesis may alter azole sus-
ceptibility in C. neoformans [40] and C. albicans [41].
Major divergence in mRNA expression of transporters
A final pathway for which we observed striking expres-
sion divergence was multi-drug transport ( Figure 4b;
Additional file 1: Transport). Most genes in this pathway
were cov ered by clusters 8, 11, 16 (Figure 5a, b). Multi-
drug transporters are divided into two c lasses: ATP-
binding cassette (ABC) and major facilitator su perfamily
(MFS) transporters [5]. We e xamined the expression
patterns of these t ransporters and found at least two
types of divergent behaviors. Fi rst, the fraction of di ffer-
entially expressed Sc MFS transporters was low com-
pared to Cg and Kl (Fisher exact test, one-tailed P=
0.025 and 0.020, respectively). Second, the timing of
MFS gene expressi on differed, with Sc up-regulated late
and Cg up-regulated early (Figure 5b). In SC, several
ABC and MFS transporters have been shown to bind
Figure 5 Divergence in transporter usage. Cross-species expression profiles of (a) ATP-binding cassette (ABC) and (b) major facilitator
superfamily (MFS) transporters are shown. Grey expression values denote a gene for which the species lacks an ortholog. (c) Change in cell
density with addition of exogenous ergosterol at the fluconazole 50% inhibitory concentration across different mutant backgrounds. Sc.bpt1Δ is a
gene knockout unrelated to fluconazole response and is included as a control. Error bars indicate one standard deviation. (d) Model for
differential usage of transporters among Sc, Cg, and Kl.
Kuo et al. Genome Biology 2010, 11:R77
/>Page 7 of 12
fluconazole as a substrate [20,42,43]. Of these, we found
that the PDR5/10/15 family of ABC transporters was
up-regulated in Cg and Sc but not Kl.Anotherflucona-
zole transporter, SNQ2, was up-regulated in Cg only.
We also found strong differences in the expression of
other multi-drug transporters that have not been pre-
viously linked to fluconazole: PDR12 was strongly
down-regulated in Sc and Cg but up-regulated in Kl;
ATR1 and YOR378W were up-regulated in Cg and Kl
but not Sc; HOL1 was up-regulated in Sc and Kl but not
Cg. Some transporters also showed differences in
expression timing (YOR1, PDR12).
Additionally, two ABC transporters, AUS1 and PDR11,
which uptake sterol under anaerobic conditions [44],
were up-regulated in Sc but were not differentiall y
expressed in Cg (Cg does not possess a PDR11 ortho-
log). This suggests that Sc but not Cg increases sterol
transport during fluconazole exposure. Intriguingly,
since the direct effect of fluconazole is to inhibit sterol
synthesis, increased sterol transport could be a mechan-
ism for increased fluconazole tolerance. In support of
this hypothesis, we found that the normally repressed
cell wall mannopr otein DAN1, whose expression is
required for sterol uptake [45], was up-regulated in Sc
but not Cg.SinceKl lacks sterol transporters, it cannot
import ste rol and only grows aerobically [46,47] (Addi-
tional file 1: Analysis of Sterol Import Machinery in
Fungal Genomes). As a possible explanation for this
divergent behavior, we found that the promoter regions
of ScAUS1, ScPDR11,andScDAN1 contain binding
motifs for ergosterol biosynthesis and/or sterol transport
regulators Ecm22p, Rox1p and Sut1p, all of which were
absent upstream of CgAUS1 and CgDAN1.
Therefore, the striking divergence in expression of
fluconazole export and sterol import pathways suggest s
differing strategies in the azole response: following flu-
conazole exposure, Sc
appears to activate sterol influx
through up-regulation of PDR11 and AUS1;incon-
trast, Cg may activate fluconazole efflux through strong
up-regulation of SNQ2 and a PDR5/10/15 ortholog
(Figure 5a).
Sterol import increases fluconazole tolerance in Sc, but
not Cg or Kl
To investigate these hypotheses, we grew wild-type Sc
and Cg along with deletion mutants Sc.aus1Δ and Sc.
pdr11Δ under fluconazole tre atment in the presence or
absence of exogenous ergosterol (4 μg/ml). As shown in
Figure 5c, we found that addition of ergosterol had no
effect on growth of Cg but led to an increase in growth
of Sc (P = 0.018). This increase was attenuated in Sc.
aus1Δ and Sc.pdr11Δ (P = 0.033), which lack sterol
import genes, but not in an unrelated control knockout,
Sc.bpt1Δ. Thus, Sc but not Cg is aided by adding
ergosterol to the e nvironment, and this process is likely
dependent on AUS1 and/or PDR11.
Three additional lines of evidence support the hypoth-
esis that Sc prefers sterol import while Cg prefers fluco-
nazole export in response to fluconazole treatment. A
retrospective analysis of deletion mutant fitness in Sc
[48] revealed that a greater p roportion of gene deletions
involved in the sterol pathway lead to fluconazole sensi-
tivity than deletion of fluconazole transporters them-
selves (Fisher exact test, one-tailed P=0.043). This
suggests a role for sterol transporters in the Sc flucona-
zole response. Second, fluconazole tolerance in Cg has
been shown to be unaffected when constitutively expres-
sing CgAUS1 inthepresenceofexogenousfreecholes-
terol (though not in the presence of serum) [49]. Third,
deletion of the Cg orthologs of fluconazole transporters
PDR5 (CgCDR1)[50]orSNQ2 [51] both resulted in
increased fluconazole sensitivity.
Expression of sterol importers in Kl increases fluconazole
tolerance
Since Kl neither up-regulates drug exporters nor
encodes sterol importers, we considered that this lack of
a transport response might be re sponsible for the higher
drug sensitivity we observed for Kl in relation to the
other species. Consi stent with this hypothesis, we found
that Kl growth was unaffected b y addition of exogenous
ergosterol (Figure 5c), similar to Cg but in sharp con-
trast to Sc. We also predicted that transgenic expression
of ster ol importers ScAus1 or ScPdr11 in Kl might
increase fluconazole tolerance in the presence of exo-
genous ergosterol. To test this prediction, we chromoso-
mally integrated ScAUS1 and ScPDR11 into Kl
non-disruptively at the KlLAC4 locus under control of
the strong constitutive Kl P
LAC4-PBI
promoter (Mater ials
and methods). Transformed Kl strains were grown
under fluconazole treatment with and without exogen-
ous ergosterol (4 μg/ml).Weobservedthattransgenic
expression of sterol importer AUS1 in Kl significantly
increased fluconazole tolerance (P =0.012;Figure5c)in
an ergosterol-de pendent manner. Thus, it appears t hat
differences in sterol import and drug export are respon-
sible for a component of the anti-fungal response, and
of the observed functional divergence across the three
yeast species.
Conclusions
In this s tudy, we have compared the dynami c transcrip-
tional responses of three diverse yeast species to fluco -
nazole treatment, revealing significant divergence in
their regulatory programs. The data suggest several dif-
ferent mechanisms of azole tolerance, depending on the
species (Figure 5d). The Sc response depends on sterol
influx, through up-regulation of PDR11 and AUS1.In
Kuo et al. Genome Biology 2010, 11:R77
/>Page 8 of 12
contrast, the Cg response relies on fluconazole efflux
through strong up-regulation of SNQ2 and a PDR5/10/
15 ortholog. Neither of these responses have evolved in
Kl, leading to its severe drug sensitivity. These conclu-
sions a re supported by follow-up experiments demon-
strating that growth in ergosterol increases the
fluconazole tolerance of Sc, but not other species, in a
PDR11-andAUS1-dependent fashion. They are also
supported b y the finding that transgenic expression of
AUS1 in Kl increases the fluconazole tolerance of this
species.
To arrive at these conclusions, we employed a novel
‘soft clustering’ approach that is of general use in the
fields of comparative and systems biology. This
approach is distinct from other methods for cross-spe-
cies expression analysis [27,28,30,52] in several impor-
tant ways. Chief among these, it integrates sequence
orthology with gene expression patterns to pr oduce
accurate orthologous clusters. This integration is accom-
plished by a symmetric process that does not require the
designation of one species as a reference. In addition,
soft clustering handles data from more than t wo species
and can, in principle, analyze any number of species
simultaneously. In future, such approaches might be
used to survey a wider range of species, drug concentra-
tions and stimuli to reveal conserved and divergent
molecular response pathways.
Materials and methods
Strains and growth conditions
Standard laboratory strains with known genomic
sequence [53] were used: Sc BY4741, Cg CBS138
(ATCC 2001), and Kl NRRL Y-1140 (ATCC 8585). Cul-
tures were grown in rich media (YPD) from OD
600
of
0.05 to 0.2 at 30°C and 225 rpm. Cells were treated with
fluconazole at species-specific sub-inhibitory concentra-
tions (Figure S1 in Add itional file 1), and harvested at 0,
1/3, 2/3, 1, 2 or 4 doubling times as measured for
untreated cells.
Microarray expression profiling
RNA was isolated by hot phenol/chloroform extrac-
tion and enriched for mRNA via poly-A selection
(Ambion 1916, Austin, TX, USA). mRNA from
untreated cells was combined in equal amounts from
all time points to form a species-specific reference
sample. Six replicates per time point were dUTP
labeled (three biological replicates by two technical
replicates) with Cy3 and Cy5 dyes (Invitrogen
SKU11904-018, Carlsbad, CA, USA) creating a dye-
swapped reference design. Samples were hybridized to
Agilent expression arrays using the protocol recom-
mended by Agilent. Differential expression was called
using the VERA error model [54] and false discovery
rate multiple-test correction [55]. Additional descrip-
tion of both the microarray platform and analysis can
be found in Additional f ile 1.
Soft clustering algorithm
We developed a constrained clustering method based on
the k-means algorithm, but using a revised objective
function (Additional file 1). Like regular k-means, the
objective function considers the similarity of each gene’s
expression profile to the center of its assigned class.
However, it also rewards class assignments in which
orthologs are co-clustered. The reward (W)isauser-
defined parameter that serves as a tradeoff between
cluster expression coherence and percentage of co-clus-
tered orthologs: each gene, x Î X, is assigned to cluster
h* such as to minimize the objective function:
hDxCW
h
h
*
arg min( ( ( , ) ))=−
∑
where ∑(D(x, C
h
)-W) refers to a ll possible partitions
of genes in the same orthology group, D() refers to a
use r defined dista nce function, and C
h
denotes the cen-
ter of cluster h. As discussed in the main text and in
Additional file 1, the appropriate value of the reward,
W, can be determined using complementary informa-
tion. Here, it was tuned to maximize the GO enrich-
ment of the clusters.
The new obj ective function also leads to changes in
the search algorithm for determining the opt imal cluster
assignments: for each group of orthologs across the
three species, we search for the partitions that result in
the minimum total distance between all pairs of group
members. Since there are 2
m
possible subgroups, where
m is the size of the orthology group (here, most orthol-
ogy groups are of size m = 3), and each subgroup is
checked for all possible k clusters, the search complexity
for e ach group is O(2
m
* k). Since m is small, the run-
ning time of the algorithm is typically very fast. Detailed
methods, including algorithm pseudo-code, are pre-
sented in Additional file 1.
Identifying highly conserved and divergent pathways
We first ranked G O processes categories [38] based on
their significance of overlap with differenti ally expressed
orthologous groups [32]. An orthologous group was
considered differentially expressed if at least one mem-
ber was differentially expressed. We used the top 20
ranked GO processes for identifying conserv ed and
divergent pathways. Conserved pathways were defined
as thos e with the highest ‘full co-clustering’ fraction of
genes known to be involved in the process and diver-
gent pathways were defined as those with the highest
‘no co-clustering’ fractions.
Kuo et al. Genome Biology 2010, 11:R77
/>Page 9 of 12
Insertion of ScAUS1/ScPDR11 into Kl
To facilitate insertion of ScAUS1 and ScPDR 11 into Kl,
open reading frames were placed under control of the
strong P
LAC4-PBI
promoter by cloning into plasmid
pKLAC2 (NEB N3742S), which possesses approximately
2-kb homology to the Kl.LAC4 locus. Open reading
frames were amplified with a SacI restriction site (3’
end), which was u sed to ligate a kanamycin marker
from pCR-Blunt (Invitrogen K-2800-20). XhoI(5’ end)
and SbfI(3’ end) restriction sites were added by PCR for
ligation into pKLAC2. Modified plasmids were trans-
formed into Escherichia coli and screened on Luria-Ber-
tani media containing ampicill in and kanamycin.
Plasmids were mini-prepped (GE Healthcare #US79220 -
50RXNS, P iscataway, NJ, USA ) and v erified by PCR and
SacII digestion. All restriction e nzymes were obtained
from New England Biolabs (Ipswich, MA, USA).
SacII-linearized plasmids were transformed into Kl
NRRL Y-1140 by electroporation, thereby inserting
ScAUS1 and ScPDR11 non-disruptively at the Kl.LAC4
locus. Colonies were selected on YCB + 5 mM aceta-
mide (New England B iolabs N3742 S and verified by
PCR. mRNA expression of ScAUS1 and ScPDR11 was
validated by quantitative RT-PCR.
Data
The da ta reported in this paper have been deposited in
the Gen e Expression Omni bus database, accession num-
ber [GEO:GSE15710].
Additional material
Additional file 1: Supplementary Methods, Results, and Discussion.
Additional file 2: Supplementary Table S1.
Additional file 3: Supplementary Table S2.
Abbreviations
ABC: ATP-binding cassette; CG: Candida glabrata; GO: Gene Ontology; Kl:
Kluyveromyces lactis; MFS: major facilitator superfamily; SC: Saccharomyces
cerevisiae.
Competing interests
The authors declare that they have no competing interests.
Authors’ contributions
DK, KT, TR and TI designed the study. DK performed all experimental work.
ZBJ and GZ developed the soft-constraint clustering approach. DK, KT, and
GZ analyzed the data. DK and TI wrote the manuscript. ZBJ and TI
supervised the work.
Acknowledgements
We thank Katherine Licon, Justin Catalana and Kevin Thai for technical
assistance. DK was supported by the National Science and Engineering
Research Council of Canada. KT and TI were supported by a David and
Lucille Packard Foundation Award and NIH Grant #R01 ES014811 to TI. GZ
and ZBJ were supported by NIH grant #RO1 GM085022 and NSF CAREER
award 0448453 to ZBJ.
Author details
1
Departments of Bioengineering and Medicine, University of California San
Diego, 9500 Gilman Drive, La Jolla, CA 92093, USA.
2
Departments of Internal
Medicine and Biomedical Engineering, University of Iowa, 200 Hawkins Drive,
Iowa City, IA 52242, USA.
3
Department of Computer Science, Carnegie
Mellon University, 500 Forbes Avenue, Pittsburgh, PA 15213, USA.
4
Red Sea
Laboratory of Integrative Systems Biology, Division of Chemical and Life
Sciences and Engineering, Computational Bioscience Research Center, King
Abdullah University of Science and Technology, Thuwal 23955-6900,
Kingdom of Saudi Arabia.
Received: 22 April 2010 Revised: 9 July 2010 Accepted: 23 July 2010
Published: 23 July 2010
References
1. Paulitsch A, Weger W, Ginter-Hanselmayer G, Marth E, Buzina W: A 5-year
(2000-2004) epidemiological survey of Candida and non-Candida yeast
species causing vulvovaginal candidiasis in Graz, Austria. Mycoses 2006,
49:471-475.
2. Sanguinetti M, Posteraro B, Fiori B, Ranno S, Torelli R, Fadda G: Mechanisms
of azole resistance in clinical isolates of Candida glabrata collected
during a hospital survey of antifungal resistance. Antimicrob Agents
Chemother 2005, 49:668-679.
3. Wilson LS, Reyes CM, Stolpman M, Speckman J, Allen K, Beney J: The direct
cost and incidence of systemic fungal infections. Value Health 2002,
5:26-34.
4. Maertens JA: History of the development of azole derivatives. Clin
Microbiol Infect 2004, 10(Suppl 1):1-10.
5. Anderson JB: Evolution of antifungal-drug resistance: mechanisms and
pathogen fitness. Nat Rev Microbiol 2005, 3:547-556.
6. Carrillo-Munoz AJ, Giusiano G, Ezkurra PA, Quindos G: Antifungal agents:
mode of action in yeast cells. Rev Esp Quimioter 2006, 19:130-139.
7. Lupetti A, Danesi R, Campa M, Del Tacca M, Kelly S: Molecular basis of
resistance to azole antifungals. Trends Mol Med 2002, 8:76-81.
8. Sanglard D: Resistance of human fungal pathogens to antifungal drugs.
Curr Opin Microbiol 2002, 5:379-385.
9. Cowen LE: The evolution of fungal drug resistance: modulating the
trajectory from genotype to phenotype. Nat Rev Microbiol 2008, 6:187-198.
10. Cowen LE, Steinbach WJ: Stress, drugs, and evolution: the role of cellular
signaling in fungal drug resistance. Eukaryot Cell 2008, 7:747-764.
11. Jansen G, Lee AY, Epp E, Fredette A, Surprenant J, Harcus D, Scott M, Tan E,
Nishimura T, Whiteway M, Hallett M, Thomas DY: Chemogenomic profiling
predicts antifungal synergies. Mol Syst Biol 2009, 5:338.
12. Vermitsky JP, Earhart KD, Smith WL, Homayouni R, Edlind TD, Rogers PD:
Pdr1 regulates multidrug resistance in Candida glabrata: gene disruption
and genome-wide expression studies. Mol Microbiol 2006, 61:704-722.
13. Lepak A, Nett J, Lincoln L, Marchillo K, Andes D: Time course of
microbiologic outcome and gene expression in Candida albicans during
and following
in vitro and in vivo exposure to fluconazole. Antimicrob
Agents Chemother 2006, 50:1311-1319.
14. Bammert GF, Fostel JM: Genome-wide expression patterns in
Saccharomyces cerevisiae: comparison of drug treatments and genetic
alterations affecting biosynthesis of ergosterol. Antimicrob Agents
Chemother 2000, 44:1255-1265.
15. Cowen LE, Carpenter AE, Matangkasombut O, Fink GR, Lindquist S: Genetic
architecture of Hsp90-dependent drug resistance. Eukaryot Cell 2006,
5:2184-2188.
16. Kontoyiannis DP: Efflux-mediated resistance to fluconazole could be
modulated by sterol homeostasis in Saccharomyces cerevisiae. J
Antimicrob Chemother 2000, 46:199-203.
17. Agarwal AK, Rogers PD, Baerson SR, Jacob MR, Barker KS, Cleary JD,
Walker LA, Nagle DG, Clark AM: Genome-wide expression profiling of the
response to polyene, pyrimidine, azole, and echinocandin antifungal
agents in Saccharomyces cerevisiae. J Biol Chem 2003, 278:34998-35015.
18. Selmecki A, Forche A, Berman J: Aneuploidy and isochromosome
formation in drug-resistant Candida albicans. Science 2006, 313:367-370.
19. Pfaller MA, Diekema DJ: Twelve years of fluconazole in clinical practice:
global trends in species distribution and fluconazole susceptibility of
bloodstream isolates of Candida. Clin Microbiol Infect 2004, 10(Suppl
1):11-23.
Kuo et al. Genome Biology 2010, 11:R77
/>Page 10 of 12
20. Anderson JB, Sirjusingh C, Parsons AB, Boone C, Wickens C, Cowen LE,
Kohn LM: Mode of selection and experimental evolution of antifungal
drug resistance in Saccharomyces cerevisiae. Genetics 2003, 163:1287-1298.
21. Vermitsky JP, Edlind TD: Azole resistance in Candida glabrata: coordinate
upregulation of multidrug transporters and evidence for a Pdr1-like
transcription factor. Antimicrob Agents Chemother 2004, 48:3773-3781.
22. Cowen LE, Lindquist S: Hsp90 potentiates the rapid evolution of new
traits: drug resistance in diverse fungi. Science 2005, 309:2185-2189.
23. Wolfe KH, Shields DC: Molecular evidence for an ancient duplication of
the entire yeast genome. Nature 1997, 387:708-713.
24. Ihmels J, Bergmann S, Gerami-Nejad M, Yanai I, McClellan M, Berman J,
Barkai N: Rewiring of the yeast transcriptional network through the
evolution of motif usage. Science 2005, 309:938-940.
25. Tuch BB, Galgoczy DJ, Hernday AD, Li H, Johnson AD: The evolution of
combinatorial gene regulation in fungi. PLoS Biol 2008, 6:e38.
26. Dujon B, Sherman D, Fischer G, Durrens P, Casaregola S, Lafontaine I, De
Montigny J, Marck C, Neuvéglise C, Talla E, Goffard N, Frangeul L, Aigle M,
Anthouard V, Babour A, Barbe V, Barnay S, Blanchin S, Beckerich JM,
Beyne E, Bleykasten C, Boisramé A, Boyer J, Cattolico L, Confanioleri F, De
Daruvar A, Despons L, Fabre E, Fairhead C, Ferry-Dumazet H: Genome
evolution in yeasts. Nature 2004, 430:35-44.
27. Banerjee D, Lelandais G, Shukla S, Mukhopadhyay G, Jacq C, Devaux F,
Prasad R: Responses of pathogenic and nonpathogenic yeast species to
steroids reveal the functioning and evolution of multidrug resistance
transcriptional networks. Eukaryot Cell 2008, 7:68-77.
28. Lelandais G, Tanty V, Geneix C, Etchebest C, Jacq C, Devaux F: Genome
adaptation to chemical stress: clues from comparative transcriptomics in
Saccharomyces cerevisiae and Candida glabrata. Genome Biol 2008, 9:R164.
29. Cai J, Xie D, Fan Z, Chipperfield H, Marden J, Wong WH, Zhong S:
Modeling co-expression across species for complex traits: insights to the
difference of human and mouse embryonic stem cells. PLoS Comput Biol
2010, 6:e1000707.
30. Ihmels J, Bergmann S, Berman J, Barkai N: Comparative gene expression
analysis by differential clustering approach: application to the Candida
albicans transcription program. PLoS Genet 2005, 1:e39.
31. Tanay A, Regev A, Shamir R: Conservation and evolvability in regulatory
networks: the evolution of ribosomal regulation in yeast. Proc Natl Acad
Sci USA 2005,
102:7203-7208.
32. Alexeyenko A, Tamas I, Liu G, Sonnhammer ELL: Automatic clustering of
orthologs and inparalogs shared by multiple proteomes. Bioinformatics
2006, 22:e9-15.
33. Davies BS, Rine J: A role for sterol levels in oxygen sensing in
Saccharomyces cerevisiae. Genetics 2006, 174:191-201.
34. Silver PM, Oliver BG, White TC: Role of Candida albicans transcription
factor Upc2p in drug resistance and sterol metabolism. Eukaryot Cell
2004, 3:1391-1397.
35. Zhu C, Byers KJ, McCord RP, Shi Z, Berger MF, Newburger DE, Saulrieta K,
Smith Z, Shah MV, Radhakrishnan M, Philippakis AA, Hu Y, De Masi F,
Pacek M, Rolfs A, Murthy T, Labaer J, Bulyk ML: High-resolution DNA
binding specificity analysis of yeast transcription factors. Genome Res
2009, 19:556-566.
36. Nguyen DH, D’Haeseleer P: Deciphering principles of transcription
regulation in eukaryotic genomes. Mol Syst Biol 2006, 2:2006.0012.
37. Morschhauser J: Regulation of multidrug resistance in pathogenic fungi.
Fungal Genet Biol 2009, 47:94-106.
38. Consortium GO: The Gene Ontology project in 2008. Nucleic Acids Res
2008, 36:D440-444.
39. Dimster-Denk D, Rine J, Phillips J, Scherer S, Cundiff P, DeBord K, Gilliland D,
Hickman S, Jarvis A, Tong L, Ashby M: Comprehensive evaluation of
isoprenoid biosynthesis regulation in Saccharomyces cerevisiae utilizing
the Genome Reporter Matrix(TM). J Lipid Res 1999, 40:850-860.
40. Pascon RC, Ganous TM, Kingsbury JM, Cox GM, McCusker JH: Cryptococcus
neoformans methionine synthase: expression analysis and requirement
for virulence. Microbiology 2004, 150:3013-3023.
41. Ha KC, White TC: Effects of azole antifungal drugs on the transition from
yeast cells to hyphae in susceptible and resistant isolates of the
pathogenic yeast Candida albicans. Antimicrob Agents Chemother 1999,
43:763-768.
42. Tenreiro S, Rosa PC, Viegas CA, Sa-Correia I: Expression of the AZR1 gene
(ORF YGR224w), encoding a plasma membrane transporter of the major
facilitator superfamily, is required for adaptation to acetic acid and
resistance to azoles in Saccharomyces cerevisiae. Yeast 2000, 16:1469-1481.
43. Broco N, Tenreiro S, Viegas CA, Sa-Correia I: FLR1 gene (ORF YBR008c) is
required for benomyl and methotrexate resistance in Saccharomyces
cerevisiae and its benomyl-induced expression is dependent on pdr3
transcriptional regulator. Yeast 1999, 15:1595-1608.
44. Wilcox LJ, Balderes DA, Wharton B, Tinkelenberg AH, Rao G, Sturley SL:
Transcriptional profiling identifies two members of the ATP-binding
cassette transporter superfamily required for sterol uptake in yeast. J Biol
Chem 2002, 277:32466-32472.
45. Alimardani P, Regnacq M, Moreau-Vauzelle C, Ferreira T, Rossignol T,
Blondin B, Berges T: SUT1-promoted sterol uptake involves the ABC
transporter Aus1 and the mannoprotein Dan1 whose synergistic action
is sufficient for this process. Biochem J 2004, 381:195-202.
46. Bussereau F, Casaregola S, Lafay JF, Bolotin-Fukuhara M: The Kluyveromyces
lactis repertoire of transcriptional regulators. FEMS Yeast Res 2006,
6:325-335.
47. Snoek IS, Steensma HY: Why does Kluyveromyces lactis not grow under
anaerobic conditions? Comparison of essential anaerobic genes of
Saccharomyces cerevisiae with the Kluyveromyces lactis genome. FEMS
Yeast Res 2006, 6:393-403.
48. Parsons AB, Lopez A, Givoni IE, Williams DE, Gray CA, Porter J, Chua G,
Sopko R, Brost RL, Ho CH, Wang J, Ketela T, Brenner C, Brill JA,
Fernandez GE, Lorenz TC, Payne GS, Ishihara S, Ohya Y, Andrews B,
Hughes TR, Frey BJ, Graham TR, Andersen RJ, Boone C: Exploring the
mode-of-action of bioactive compounds by chemical-genetic profiling in
yeast. Cell 2006, 126:611-625.
49. Nakayama H, Tanabe K, Bard M, Hodgson W, Wu S, Takemori D, Aoyama T,
Kumaraswami NS, Metzler L, Takano Y, Chibana H, Niimi M: The Candida
glabrata putative sterol transporter gene CgAUS1 protects cells against
azoles in the presence of serum. J Antimicrob Chemother 2007,
60:1264-1272.
50. Sanglard D, Ischer F, Calabrese D, Majcherczyk PA, Bille J: The ATP binding
cassette transporter gene CgCDR1 from Candida glabrata is involved in
the resistance of clinical isolates to azole antifungal agents. Antimicrob
Agents Chemother 1999, 43:2753-2765.
51. Torelli R, Posteraro B, Ferrari S, La Sorda M, Fadda G, Sanglard D,
Sanguinetti M: The ATP-binding cassette transporter-encoding gene
CgSNQ2 is contributing to the CgPDR1-dependent azole resistance of
Candida glabrata. Mol Microbiol 2008, 68:186-201.
52. Alter O, Brown PO, Botstein D: Generalized singular value decomposition
for comparative analysis of genome-scale expression data sets of two
different organisms. Proc Natl Acad Sci USA 2003, 100:3351-3356.
53. Sherman DJ, Martin T, Nikolski M, Cayla C, Souciet JL, Durrens P:
Genolevures: protein families and synteny among complete
hemiascomycetous yeast proteomes and genomes. Nucleic Acids Res
2009, 37:D550-554.
54. Kelley R, Feizi H, Ideker T: Correcting for gene-specific dye bias in DNA
microarrays using the method of maximum likelihood. Bioinformatics
2008, 24
:71-77.
55. Storey JD, Tibshirani R: Statistical significance for genomewide studies.
Proc Natl Acad Sci USA 2003, 100:9440-9445.
56. Wapinski I, Pfeffer A, Friedman N, Regev A: Natural history and
evolutionary principles of gene duplication in fungi. Nature 2007,
449:54-61.
57. Troyanskaya O, Cantor M, Sherlock G, Brown P, Hastie T, Tibshirani R,
Botstein D, Altman RB: Missing value estimation methods for DNA
microarrays. Bioinformatics 2001, 17:520-525.
58. Birrell GW, Brown JA, Wu HI, Giaever G, Chu AM, Davis RW, Brown JM:
Transcriptional response of Saccharomyces cerevisiae to DNA-damaging
agents does not identify the genes that protect against these agents.
Proc Natl Acad Sci USA 2002, 99:8778-8783.
59. Begley TJ, Rosenbach AS, Ideker T, Samson LD: Damage recovery
pathways in Saccharomyces cerevisiae revealed by genomic phenotyping
and interactome mapping. Mol Cancer Res 2002, 1:103-112.
60. Barker KS, Pearson MM, Rogers PD: Identification of genes differentially
expressed in association with reduced azole susceptibility in
Saccharomyces cerevisiae. J Antimicrob Chemother 2003, 51:1131-1140.
61. Ernst J, Nau GJ, Bar-Joseph Z: Clustering short time series gene
expression data. Bioinformatics 2005, 21(Suppl 1):i159-168.
Kuo et al. Genome Biology 2010, 11:R77
/>Page 11 of 12
62. Lu Y, Huggins P, Bar-Joseph Z: Cross species analysis of microarray
expression data. Bioinformatics 2009, 25:1476-1483.
63. Basu S, Banerjee A, Mooney RJ: Active semi-supervision for pairwise
constrained clustering. Proceedings of the 2004 SIAM International
Conference on Data Mining, (SDM-2004); June 13-16, 2004: Nashville, TN 2004,
333-344.
64. Wagstaff KL: Value, cost, and sharing: issues in constrained clustering.
Knowledge Discovery in Inductive Databases: 5th International Workshop, KDID
2006; Berlin, Germany: September 18th, 2006 SpringerDzeroski S, Struyf J
2007, 1-10, [Lecture Notes in Computer Science, volume 4747.].
65. Futschik ME, Carlisle B: Noise-robust soft clustering of gene expression
time-course data. J Bioinform Comput Biol 2005, 3:965-988.
66. Gasch AP, Eisen MB: Exploring the conditional coregulation of yeast gene
expression through fuzzy k-means clustering. Genome Biol 2002, 3:
RESEARCH0059.
67. Hughes JD, Estep PW, Tavazoie S, Church GM: Computational
identification of cis-regulatory elements associated with groups of
functionally related genes in Saccharomyces cerevisiae. J Mol Biol 2000,
296:1205-1214.
68. Bailey TL, Williams N, Misleh C, Li WW: MEME: discovering and analyzing
DNA and protein sequence motifs. Nucleic Acids Res 2006, 34:W369-373.
69. Pavesi G, Mauri G, Pesole G: An algorithm for finding signals of unknown
length in DNA sequences. Bioinformatics 2001, 17(Suppl 1):S207-214.
70. Hertz GZ, Stormo GD: Identifying DNA and protein patterns with
statistically significant alignments of multiple sequences. Bioinformatics
1999, 15:563-577.
71. MacIsaac KD, Wang T, Gordon DB, Gifford DK, Stormo GD, Fraenkel E: An
improved map of conserved regulatory sites for Saccharomyces
cerevisiae. BMC Bioinformatics 2006, 7:113.
72. Matys V, Fricke E, Geffers R, Gossling E, Haubrock M, Hehl R, Hornischer K,
Karas D, Kel AE, Kel-Margoulis OV, Kloos DU, Land S, Lewicki-Potapov B,
Michael H, Münch R, Reuter I, Rotert S, Saxel H, Scheer M, Thiele S,
Wingender E: TRANSFAC: transcriptional regulation, from patterns to
profiles. Nucleic Acids Res 2003, 31:374-378.
73. Mahony S, Hendrix D, Golden A, Smith TJ, Rokhsar DS: Transcription factor
binding site identification using the self-organizing map. Bioinformatics
2005, 21:1807-1814.
74. Merico A, Sulo P, Piskur J, Compagno C: Fermentative lifestyle in yeasts
belonging to the Saccharomyces complex. Febs J 2007, 274:976-989.
75. Bolotin-Fukuhara M:
Genomics and biodiversity in yeasts. Biodiversity and
Ecophysiology of Yeasts SpringerRosa C, Péter G 2006.
76. Butler G, Rasmussen MD, Lin MF, Santos MA, Sakthikumar S, Munro CA,
Rheinbay E, Grabherr M, Forche A, Reedy JL, Agrafioti I, Arnaud MB, Bates S,
Brown AJ, Brunke S, Costanzo MC, Fitzpatrick DA, de Groot PW, Harris D,
Hoyer LL, Hube B, Klis FM, Kodira C, Lennard N, Logue ME, Martin R,
Neiman AM, Nikolaou E, Quail MA, Quinn J, Santos MC: Evolution of
pathogenicity and sexual reproduction in eight Candida genomes.
Nature 2009, 459:657-662.
doi:10.1186/gb-2010-11-7-r77
Cite this article as: Kuo et al.: Evolutionary divergence in the fungal
response to fluconazole revealed by soft clustering. Genome Biology
2010 11:R77.
Submit your next manuscript to BioMed Central
and take full advantage of:
• Convenient online submission
• Thorough peer review
• No space constraints or color figure charges
• Immediate publication on acceptance
• Inclusion in PubMed, CAS, Scopus and Google Scholar
• Research which is freely available for redistribution
Submit your manuscript at
www.biomedcentral.com/submit
Kuo et al. Genome Biology 2010, 11:R77
/>Page 12 of 12