Báo cáo y học: "Comprehensive modeling of microRNA targets predicts functional non-conserved and non-canonical sites" potx
Bạn đang xem bản rút gọn của tài liệu. Xem và tải ngay bản đầy đủ của tài liệu tại đây (1.09 MB, 14 trang )
MET H O D Open Access
Comprehensive modeling of microRNA targets
predicts functional non-conserved and
non-canonical sites
Doron Betel
1
, Anjali Koppal
2
, Phaedra Agius
1
, Chris Sander
1
, Christina Leslie
1*
Abstract
mirSVR is a new machine learning method for ranking microRNA target sites by a down-regulation score. The algo-
rithm trains a regression model on sequence and contextual features extracted from miRanda-predicted target
sites. In a large-scale evaluation, miRanda-mirSVR is competitive with other target prediction methods in identifying
target genes and predicting the extent of their downregulation at the mRNA or protein levels. Importantly, the
method identifies a significant number of experimentally determined non-canonical and non-conserved sites.
Background
microRNAs are a class of small regulatory RNAs that
are involved in post-transcriptional gene silencing.
These small (approximately 22 nucleotide) single-strand
RNAs guide a gene silencing complex to an mRNA by
complementary base pairing, mostly at the 3′ untrans-
lated region (3′ UTR). The association of the RNA-
induced silencing complex (RISC) to the conjugate
mRNAresultsinsilencingthegeneeitherbytransla-
tional repression or by degradation of the mRNA [1].
Reliable microRNA target prediction is an important
and still unsolved computational challenge, hampered
both by insufficient knowledge of microRNA biology as
well as the limited number of experimentally validated
targets.
Early studies of target recognition revealed that nea r-
perfect complementarity at the 5′ end of the microRNA,
the so-called “ seed region” at positions 2 to 7, is a pri-
mary determinant of target specificity [2]. However, a
perfect seed match by itself is a poor predictor for
microRNA regulation due to the large number of ran-
dom occurrences of any given hexamer in 3′ UTRs.
Conversely, a number of studies have shown that
some target sites with a mismatch or a G:U wobble in
the seed region confer a noticeable regulatory effect
[3-5], and a recent study using a cross-linking and
immunoprecipitation (CLIP) method to study in vivo
microRNA targets found a significant number of non-
canonical sites [6,7]. Therefore, perfect seed comple-
mentarity is nei ther necessary nor sufficient for mic ro-
RNA regulation.
Most computational methods require sites to have
perfect seed complementarity ("canonical” sites) [8-10],
with only a few methods allowing for G:U wobbles or
mismatches in the seed region [11,12] ("non-canonical”
sites). Other approaches consider predicted mRNA sec-
ondary structure and require energetically favorable
hybridization between microRNA and target mRNA
[13-15]. However, for the most part, all these target pre-
diction methods generate a large number of predictions,
many of which are presumed to be false. To address this
problem, virtually all c omputational methods filter pre-
dictions by conservation, which eliminates poorly con-
served candidate sites from consideration.
Several studies have used genome-wide mRNA expres-
sion changes following microRNA transfection to eluci-
date microRNA target specificity rules [8, 9,16]. Grimson
et al. defined a four-class hierarchy of canonical seed
types of di ffering efficiencies and identified additional
“context” features of target sites that correlate (but only
weakly) with reduced express ion levels, in particular the
AU content flanking the target site. Using univariate
regression between feature scores and expression
change, they developed a seed-class-dependent scoring
system called “context score”, which has been incorpo-
rated into the TargetScan prediction program. Nielsen
* Correspondence:
1
Computational Biology Program, Memorial Sloan-Kettering Cancer Center,
1275 York Avenue, New York, 10065, NY, USA
Full list of author information is available at the end of the article
Betel et al. Genome Biology 2010, 11:R90
/>© 201 0 Betel et al; licensee BioMed Central Ltd. This is an open access article distributed under the terms of the Creative Commons
Attribution License ( nses/by/2.0), which permits unrestricted use, distribution, and reproduction in
any medium, provided the original work is properly cited.
et al. assessed the significance of similar features by the
shift in the cumulative distribution of log expression
ratios using the same four-class seed hierarchy. Recently,
proteomics studies of protein expression changes in
response to microRNA transfection and knockdown
[17,18] corroborated a number of these specificity fea-
tures. Importantly, these studies showed that most tar-
gets with significantly reduced protein levels also
experienced detectable reduction in mRNA levels, indi-
cating that changes in mRNA expression are reasonable
indicators for microRNA regulation.
Here we present a new algorithm called mirSVR for
scoring and ranking the efficiency of miRanda-predicted
microRNA target sites by using supervised learning on
mRNA expression changes following microRNA trans-
fections. mirSVR incorporates target site information
and contextual features into a single integrate d model,
without the need to define seed subclasses. We use sup-
port vector regression (SVR) to train on a wide range of
features, including secondary structure accessibility of
the site and conservation.
We first compared mirSVR against a number of exist-
ing target prediction algorithms using a large panel of
independent micro RNA transfection and inhibition
experiments as test data. For a fair comparison, we lim-
ited consideration to sites with canonical seed pairing in
this analysis. mirSVR performs as well as, and often bet-
ter than, existing methods for the task of predicting the
extent of downregulation of genes at the mRNA or pro-
tein level. The m iRanda-mirSVR approach effectively
broadens target prediction beyond the standard notion
of seed hierarchy and strict conservation without intro-
ducing a large number of spurious predictions. In parti-
cular, we found that the mirSVR scoring model
correctly identified functional but poorly conserved tar-
get sites, and that imposing a conversation filter results
in a reduced rate of detection of true targets.
mirSVR downregulation scores are calibrated to corre-
late linearly with the extent of downregulation and
therefore enable accurate scoring of genes with multiple
target sites by simple addition of the individual target
scores. Furthermore, the scores can be inte rpreted as an
empirical probability of downregulation, which provides
a meaningful guide for selecting a s core cutoff. We
found that the model can correctly identify genes that
are regulated by multiple endogenous microRNAs -
rather than transfected microRNAs whose concentra-
tions are above physiological levels - by analyzing targets
bound to human Argonaute (AGO) proteins as identi-
fied by AGO immunoprecipitation [19]. We also revis-
ited the idea of the seed hierarchy, and found that
different seed types had wide a nd overlapping ranges of
efficiencies. Finally, we tested the usefulness of including
non-canonical sites in the model by evaluating
performance on biochemically determined sites from
recent Photo Activ atable Ribonucleoside enhanced CLIP
experiments (PAR-CLIP). In t his data set ap proximately
7% of the detected sites do not contain perfect micro-
RNA seed match to the expressed microRNAs [7]. We
found that miRanda-mirSVR indeed correctly identified
a significant number of these experimentally verified
non-canonical sites. miRanda target sites and mirSVR
scores are available at .
Results and discussion
mirSVR performance: efficiency of canonical sites and the
role of conservation
Training the mirSVR scoring model
The mirSVR algorithm learns to predict target site effi-
ciency by training on mRNA expression data from a
panel of microRNA transfection experiments. Training
examples consist of genes containing a single candidate
target site for the transfected microR NA in the 3′ UTR.
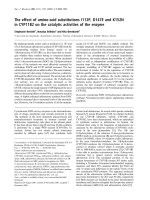
Target sites are represented by a set of binary features
of the predicted miRNA::site duplex as well as local and
global contextual features (Figure 1), toget her with its
output label, given by the log expression change after
microRNA transfection. The local contextual features
include the AU co ntent flan king the target site and pre-
dicted secondary structure accessibility at positions
flanking the site, while global contextual features include
the relative position in the 3′ UTR, UTR length, and
conservation (see Methods). Different seed types, includ-
ing non-canonical sites, are therefore represented in a
unifiedmanner,andconservationisusedasafeature
rather than a filter. mirSVR learns the features weights
using t he support vector regression (SVR) algorithm, a
variant of the well-known SVM algorithm [20] that uses
real-valued outputs rather than discrete class labels.
For all results reported below, we trained mirSVR on a
set of nine microRNA transfection experiments per-
formed on HeLa cells from Grimson et al. [8]. We eval-
uated two different training modes for our model: (1)
training only on genes containing a single ca nonical site
in the 3′ UTR, called the “canonical-only” model; (2)
training on genes containing a single canonical or non-
canonical site in the 3′ UTR, where we allow non-cano-
nical sites with exactly one G:U wobble or mismatch in
the 6-mer seed region, called the “all-sites” model. The
first mode produces a model that is r eadily compared
with most existing target prediction methods, which lar-
gely assume at least a 6-mer seed match, while the sec-
ond mode allows us to assess whether we can achieve
statistically significant prediction results on non-canoni-
cal sites. Consistent with previous studies [8,9], the most
significant features are base-pairings at the seed region
and the sequence composition flanking to the seed
region (Additional file 1, Figure S1). Additional features
Betel et al. Genome Biology 2010, 11:R90
/>Page 2 of 14
such as conservation, position in the UTR, and UTR
length are weakly correlated with the extent of
downregulation.
mirSVR scores improve ranking of canonical sites over
existing target prediction methods
We first tested the canonical-only mirSVR prediction
model, where we restricted consideration to genes with
single canonical target sites, that is, sites with perfect
complementarity to p ositions 2 to 7 of the microRNA.
The test data consists of 17 independent microRNA
transfection experiments followed by mRNA expression
profiling from Linsley et al. [21], five microRNA trans-
fection experiments followed by protein expression mea-
surements from Selbach et al. [17], and three
microRNA inhibition experiments followed by mRNA
expression profiling [21-23].
We compared the performance of the mirSVR model
against well-known existing target prediction metho ds
that were representative of the different methodologies,
namely: TargetScan’ s context score [8], which incorpo-
rates contextual feature scores estimated from expression
data from transfection experiments and, like mirSVR,
was optimized to predict the expression changes of the
target g enes; miRand a’s alignment score [11,24], which
was designed to score the quality of the miRNA::site
duplex using dynamic programming and was the first
method to incorporate binding at the 3′ end of the
microRNA; and PITA’s energy score [15], derived from a
secondary structure based method which computes the
difference between the free energy of the predicted
microRNA-targe t duplex and the energetic cost of
unpairing the local secondary structure of the target site.
For a general performance measure, we computed the
Spearman rank correlation between the observed log
expression change and the prediction score, which gives
a general measure of the overall ranking performance of
the algorithm. It is important to note that for this analy-
sis, we did not filter the potential canonical target sites
for conserv ation: mirSVR and comparison methods were
required to rank all sites with seed matches, whether or
not the sites are conserved. In this sense, we are not per-
forming a typical method comparison of existing target
prediction pro grams as they are implemented through
various web servers. Instead, we are assessing the intrin-
sic value of different target site scoring systems to predict
the extent of microRNA regulation.
Our results show that when traine d on ca nonical seed
sites and using our full feature set, mirSVR strongly out-
performs the alignment-based (miRanda) and energy-
based (PITA) scores for the task of r anking single-site
Figure 1 Features used in the mirSVR model. mirSVR uses features derived from the miRanda-predicted miRNA::site duplex, the lo cal context
of the candidate site, and the global context of the site in the 3’ UTR. Duplex features include a bit representation of base-pairing at the seed
region and the extent of 3’ binding. Local features include AU composition flanking the target site and secondary structure accessibility score.
Global features include length of UTR, relative position of target site from UTR ends, and conservation level of the block containing the target
site.
Betel et al. Genome Biology 2010, 11:R90
/>Page 3 of 14
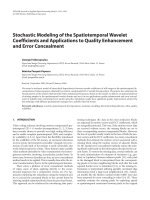
Figure 2 Comparison of mirSVR to other methods. (a) Spearman rank correlation (vertical bars) between prediction and observation for
canonical seed targets as ranked by mirSVR score, context score, alignment score from miRanda and energy score from PITA. Rank correlations
were computed between prediction scores and observed log expression changes for 17 test sets measuring mRNA expression changes
following microRNA transfection in different cell lines and genetic backgrounds [21] (brown), five test sets measuring protein expression changes
following microRNA transfection [17] (red), and three test sets measuring mRNA expression changes following microRNA inhibition [21,23,41]
(orange). Ranking by mirSVR scores outperforms that by context scores in 21 out of the 25 test sets. (b) ROC curves (receiver operating
characteristic) for mirSVR score versus context score for ranking the top 20% most downregulated targets (defined as true positives) and 20% of
least downregulated targets (defined as true negatives) for the miR-192 transfection [21]. Shown here are the ROC curves up to 30% false
positive detection. In this example, in the range shown, for a given false positive rate, mirSVR ranking yields an advantage of up to 10
percentage points in the rate of true positive prediction. (c) A summary of this ROC analysis over the 25 test sets, computing the area under the
ROC curve (AUC) for mirSVR and context score and reporting the difference in performance (mirSVR AUC - context score AUC) for each test set.
Overall, mirSVR score shows a statistically significant improvement over context score with a mean AUC of 0.80 as compared to 0.78 and
outperforming context score in 19 (bars above the zero line) out of the 25 test sets (P-value < 0.006, signed rank test).
Betel et al. Genome Biology 2010, 11:R90
/>Page 4 of 14
genes by their downregulation (upregulation) in
response to microRNA transfection (inhibition), as
shown in Figure 2a. We note that the miRanda and
PITA alignment scoring systems were not trained on
genome-wide ex pression data and in particular were not
optimized for the task of ranking expression changes, as
assessed here. Therefore, we would not expect these
methods to perform as well as supervised approaches
such as mirSVR. The c ontex t score method is the only
other approach in our main comparison that exploits
training data from microRNA transfection experiments.
mirSVR performs better than context score i n 21 out of
the 25 test sets, which constitutes a statistically signifi-
cant improvement (P < 0.002, signed rank test). The
inclusion of a conservation measure into the mirSVR
model does not account for the entire performance
gain. After removing the conservation feature, mirSVR
still outperforms context score in 18 o ut of the 25 test
cases, suggesting that the learning algorithm - not just
the inclusion of additional features - contributes to the
performance gain.
In addition to the Spearman rank correlation, we com-
pared the performance of mirSVR and context score by
anROCanalysiswherethetruepositiveandtruenega-
tive sets are defined as the top and bottom 20% of can-
didate target genes based on their expression changes
following microRNA transfection (or inhibition) (Figure
2b). Consistent with the rank correlation results,
mirSVR has a larger AUC (area under the ROC curve)
than context score in 19 out of the 25 test cases (P <
0.006, Figure 2c). The result s from both the rank corre-
lation and ROC analysis indicate that mirSVR imp roves
target ranking over the context score method for both
reduction of mRNA levels and reduction of protein
levels.
We also did a more limited comparison of mirSVR
against context score, miRanda, PITA and two addi-
tional methods for which we could obtain published tar-
get site predictions but had no access to source code:
PicTar [10] and Diana-microT [25]. In contrast to our
main method comparison (Figure 2), here we were
restricted to a limited number of target sites that were
predicted by both additional algorithms, and in particu-
lar all sites were required to pass the conservation filter
imposed by PicTar. For statistically meaningful results,
we considered only experiments for which ≥ 50 targets
were scored by all methods. Even when limited to a
small set of conserved targets, mirSVR improves over all
other methods in 8 ou t of 11 experiments in the Linsley
et al. data set when evaluated in terms of r ank correla-
tion with extent of downregulation (Additional file 1,
Figure S2a); for the other test sets, no experiments con-
tained enough scored targets to make a comparison.
Moreover, when assessing the mean log expression
change of the top 50 predictions of each method,
mirSVR’s top predic tions exhibit greater downregulation
than those of any other method (Additional file 1, Fig-
ure S2b).
mirSVR detects genes with effective but non-conserved sites
Previous reports have shown that the most downregu-
lated microRNA targets in transfection experiments are
enriched for conserved target sites and more generall y
that target site conservation correlates with the extent
of downregulation [8,9,26]. Many target prediction
methods therefore use a conservation filter to remove
what are assumed to be spurious predictions. We also
found that increased conservation of the target site is
correlated with increased suppression of the target
genes by observing (i) a downward shift i n the cumula-
tive distribution of the log expression changes of more
conserved targets (Figure 3a) and (ii) a negative weight
for the conservation feature in the mirSVR model
(Additional file 1, Figure S1).
However, for the task of detecting the most downre-
gulated targets with single canonical sites in the Linsley
et al. and Selbach et al. test sets, we found that the
detection rate as a function of the number of predictions
did not improve at any point by imposing a more strin-
gent conservation filter (Figure 3b). If it were a good
idea to filter mirSVR results for conservation, we would
expect to see the detection curve for more conserved
sites to climb more steeply than the detection curve for
less conserved sites; instead, the detection curves for
conservation filters all initiallyclimbatthesamerate.
Eventually, a s we run out of conserved sites that are in
the 5% most downregulated set, the more conserved
detection curves plateau at a lower detection rate, show-
ing that a substantial number of downregulated targets
are missed. We note that this effect is not restricted t o
our particular choice of conservation measure or even
to the mirSVR scoring system. We rep eated the analysis
with context scores downloaded from TargetScan and
using their assoc iated conservation scores (P
CT
) [26]
and similarly found no improvement in d etection rates
of the most downregulated targets with increased P
CT
threshold (Additional file 1, Figure S3). These results,
which are consistent with previous work [14], suggest
that conservation should be used in combination with
other informative features to score target sites and not
as hard filter, which leads to a substantial loss of bona
fide targets.
A unified scoring model for microRNA target sites
Interpreting mirSVR scores in terms of downregulation
The analysis so far has focused on gen es with single
canonical microRNA target sites for a straightforward
comparison to existing methods. To obtain a unified
model for a wider range of sites, we retrained mirSVR on
Betel et al. Genome Biology 2010, 11:R90
/>Page 5 of 14
all genes in the Grimson et al. data set containing either
asinglecanonicaltargetsiteorasinglenon-canonical
site with at most a single G:U wobble or mismatch in the
seed region. We confirmed that the “ all-sites” mirSVR
model performed similarly to our “ canonical-only”
mirSVR mo del fo r the task of predicting downregulation
of canonical target genes (Additional file 1, Figure S4).
We then scored genes in the test data with either sin-
gle canonical or non-canonical sites and assessed the
correspondence between mirSVR scores and observed
log expression changes over mirSVR score percentiles.
The correlation between the mirSVR scores and the
observed log expression change is non-linear (Figure
4a): a small improvement in score corresponds to a
largeincreaseinactualinhibition near the top of the
mirSVR score range but little change near the bottom of
the score range. This non-linearity is problematic for
modeling genes with multiple candidate sites: in order
to score multi-site genes by summing target site scores,
individual site scores must contribute additively to target
inhibition, which will only hold if individual scores cor-
relate linearly with downregulation (Additional file 1,
Figure S5). To correct for this effect, we fit a sigmoid
transfer function between mirSVR scores and observed
log expression changes (see Methods) that results in
transformed scores that are linearly c orrelated with log
expression change on both training and test data
(Figure 4b) and thus can serve as a proxy for the ex tent
of target downregulation. To better understand the cor-
respondence between mirSVR scores and the efficiency
of downregulation, we used the Linsley data set t o esti-
mate a gene’s empirical probability of downregulation,
which provides an estimate of the amount of downregu-
lation given a mirSVR score. More precisely, for a given
(Z-transformed) log expression reduction a <0and
mirSVR score threshold S, we compute the empirical
probability that a gene’s expression change y is below or
equal to a given that its score f(x) is smaller than or
equal to S (Figure 5a). For example, genes that have a
score of -1.0 or lower, cor responding to the top 7% of
pred ictions, have more than a 35% probability of having
a(Z-transformed) log expression change of at least -1
(downregulation by at least a standard deviation in
terms of log expression changes) an d better than 50%
probability of a log expression change of at least -0.5
(Figure 5a green and blue curves). Thus, mirSVR score s
can be converted to a probability of downregulation,
which can be used as guide for selecting a meaningful
cutoff for repo rting target sites. The empirical distribu-
tions suggest an intuitive score cutoff of -0.1 or lower,
since for scores closer to zero the probability of
meaningful downregulation drops while the number of
predictions rises sharply.
Seed classes have broad ranges of efficiencies
Previous reports identified four seed types that roughly
correlate with extent of downregulati on (8 mer > 7(m8)
Figure 3 Role of conservation in target prediction. (a) Empirical cumulative distribution of log expression changes of genes with single
canonical sites for miR-15a, filtered by increasing conservation thresholds. Distributions of more conserved sites display a subtle shift towards
negative values indicating a slight increase in downregulation of target genes. (b) Detection rate of miR-15a targets defined as genes with a
single canonical miR-15a site that are in the top 5% most downregulated genes (443 genes). Under increasing conservation thresholds, the
detection rate of the most downregulated miR-15a targets drops substantially, showing loss of detection of genes with effective but non-
conserved sites. Detection rates were scaled by the maximum number of miR-15a targets identified in the top 5% most downregulated genes
without conservation filtering (red line).
Betel et al. Genome Biology 2010, 11:R90
/>Page 6 of 14
> 7(A1) > 6 mer) [27]. A fter rescaling mirSVR scores to
correlate linearly with downregulation, we reexamined
the notion of seed hiera rchy in terms of mirSVR scores.
Consistent with previous observations, we found that
the mean mirSVR score by seed ty pe generally agreed
with the reported class hierarchy, namely, that longer
seed matches correlate with extent of downregulation.
However, each seed type had a broad distribution of
scores, with considerable overlap between the different
seed types (Figure 5b). In particular, there is a large
overlap between score ranges for 8-mer sites and the 7
(m8) sites and only a subtle difference between the 7
(A1) and 6-mer distributions. Therefore, the distinction
between seed classes and the subsequent rules used to
rank their efficiency do n ot correctly capture the range
of regulatory effect, and the assumption that longer
complementarity in the seed region gives stronger inhi-
bition does not always hold. We propose that our score-
based method, w hich is independent of seed classifica-
tion, provides a more meaningful ranking of target sites
efficiency.
Predicting the targets of endogenous microRNAs
mirSVR correctly extends to genes regulated by multiple
endogenous microRNAs
So far we have measured mirSVR performance using
expression data from microRNA transfection
experiments. However, overexpression of microRNAs by
transfection experiments may lead to stronger or more
widespread downregulation than observed under physio-
logical conditions and also appears to perturb endogen-
ous microRNA regulation in the cell by out-competing
the endogenous microRNAs for the silencing machinery
[28]. In addition, the majority of cells express multiple
microRNAsatsignificantlevels[29]andmost3′ UTRs
have multiple predicted target sites for d ifferent micro-
RNAs. It is therefore likely that under physiological con-
ditions many genes are subjected to concurrent
regulation by multiple microRNAs, and several target
prediction methods model regulation by multiple micro-
RNA sites [10,25]. To test the performance of the
mirSVR all-site model on more physiological relevant
targets, we generated another test set from published
microarray data from AGO IP experiments [19]. RNA
extracted f rom AGO1-4 immunoprecipitation was ana-
lyzed on a microarray platform and compared to RNA
extracted from the washed lysate. The endogenous
microRNA targets are identified as the set of genes that
are enriched in the AGO-IP relative to the cleared lysate
and contained a predicted microRNA target site for the
endogenously expressed microRNAs.
We included in our prediction set genes with target
sites for any or all of the top six endogenously expressed
microRNAs (miR-16, miR-19b, miR-30e-5p, miR-32,
Figure 4 Correlation of mirSVR scores with log expression change for genes with single canonical (green) and non-canonical sites
(blue). mirSVR scores are divided into equal size bins (percentile) and the mean and standard deviation of the corresponding log expression
changes are plotted for each bin. (a) Before sigmoid transformation, the mirSVR scores have non-linear correlation with the mean (Z-
transformed) observed log expression change of the genes. Canonical target sites are generally more effective sites than non-canonical sites as
shown by their more negative mirSVR scores and corresponding log expression change. Where scores for non-canonical sites fall in the same
range as canonical sites, the corresponding mean expression change also fall in the same range, indicating that non-canonical and canonical
sites with comparable scores inhibit their targets with similar efficiency. (b) After transforming with a sigmoid transfer function (fitted on the
training data), mirSVR scores correlate linearly with log expression change and therefore can be used for analysis of target site efficiency;
moreover, transformed site scores can be added to score genes with multiple sites.
Betel et al. Genome Biology 2010, 11:R90
/>Page 7 of 14
Figure 5 Probability of dow nregulation and seed class distributions derived from mirSVR score analysis. (a) Empirical probabilities of
microRNA-mediated downregulation for different mirSVR scores. Using mirSVR prediction scores on the Linsley et al. data, we compute the
empirical probability that a gene’s Z-transformed log expression change is below a (a = -0.1, -0.5, -1.0, -1.5), conditioned that its (sigmoid-
transformed) mirSVR score is less than a threshold S (x-axis). Points on the plot represent mirSVR score cutoffs S and their corresponding
probability P(y ≤ a|x ≤ S). The black curve represents the fraction of predictions with scores equal to or less than the cutoff scores. For example,
10% of predicted targets have a score of ≤ -0.8 and their expected probability of observing a log expression change of ≤ -0.5 is approximately
40%. (b) The proportion of the four seed classes: 8-mers, 7m8, 7A1 and 6-mer in equal-size mirSVR score bins. The canonical sites from Linsley et
al. were divided into equal size bins and the proportion of the four seed classes is shown by color. As expected the score distribution correlates
with seed type hierarchy (for example, 8-mers have generally more negative mirSVR scores than 7m8 sites). However, inspection of the top 30%
predicted target sites (mirSVR score ≤ -0.1) highlights the broad overlapping distributions of the four seed types, suggesting that the
classification of target sites to seed classes is inadequate to represent their relative efficiency.
Betel et al. Genome Biology 2010, 11:R90
/>Page 8 of 14
miR-20a, miR-21). An ROC analysis where the true sites
are the 20% most AGO-IP enriched genes and false pre-
dictions are the top 20% most enriched in the washed
lysate achieved an AUC of 0.72. Moreover, of the top
20% most enriched genes in the AGO-IP, mirS VR cor-
rectly detected approximately 85% of these genes as tar-
gets of one or more of the endogenous microRNAs
using a gene-leve l mirSVR score threshold of -0.1. In
addition, we comp ared the mirSVR canonical-only
model to context score using this AGO IP test set. Simi-
larly to the transfection experiments, we found that
mirSVR improves over context score both when com-
paring the rank correlation of the prediction scores with
the enrichment in the AGO IP and by ROC analysis
(Additional file 1, Figure S6). Therefore, although
mirSVR was trained on data from microRNA overex-
pression experiments, which may include non-physiolo-
gical targets, it makes meaningful target predictions for
endogenous microRNAs expressed at regular cellular
concentrations.
mirSVR identifies functional non-canonical sites
A number of studies have shown that non-canonical
sites can lead to downregulation of target genes
[3,30-32], although it is unclear whether these examples
represent a widespread pattern of microRNA regulation.
Recent large-scale biochemical identification of mamma-
lian microRNA targets have shown that approximately
7% of the target sites are non-canonical [6,7] confirming
that non-canoni cal sites account for an appreciable part
of microRNA-mediated silencing. The correlation
between mir SVR scores and downregulat ion shows that
while canonical sites are generally more effective than
non-canonical sites, canonical and non-canonical sites
with similar mirSVR scores exert a similar regulatory
effect on genes (Figure 4a). However, we still need to
assess whether inclusion of non-canonical sites improves
detection of m icroRNA-regulated genes or simply
increases the fraction of false predictions.
To investigate this question, we first performed an
ROC analysis on the Linsley et al. and Selbach et al.
test sets (inhibition data sets are too small for this ana-
lysis). In each of the transfection experiments we used
the mirS VR all-site model to score three sets of predic-
tions: i) only canonical t argets, ii) only non-canonical
targets and iii) all target sites. True positives for all sets
are defined as targets with a log expression change (Z-
score) ≤-1 and false predictions are targets with log
expression change ≥ 1. The results show that when con-
sidering only non-canonical sites, the AUC values are
significantly above random (average AUC 0.63, Figure
6a), indicating that mirSVR is able to discriminate
between effective and ineffective non-canonical sites.
Although the inclusion of non-canonical sites incurs
some loss of performance, as measured by the average
AUC for genes with only canonical sites versus all sites
(AUC 0.76, 0.72 respectively), it enables detection of
additional downregulated targets wi thout greatly inflat-
ing false positives.
To further evaluate the performance of mirSVR o n
non-canonical sites, we used a new data set of bio-
chemically verified microRNA target sites from PAR-
CLIP experiments [7]. In this assay, the targeted
mRNAs a re covalently linked to AGO proteins and are
identified by high-throughput sequencing after immuno-
precipitation of the AGO protein. We focused the analy-
sis on the approximately 7% of CLIP-identified sites that
had no perfect 6-mer seed matches to any of the endo-
genous microRNAs, thus constituting a set of bioc hemi-
cally identified non-canonical sites. These sites were
found both in coding regions and UTRs. To be consis-
tent with how our model was trained, we further
restricted the analysis to CLIP-identified non-canonical
sites in the 3′ UTRs that contained exactly one mis-
match or G:U wobble in the 6-mer s eed. We compared
the mirSVR scores of the non-canonical ca ndidate sites
detected by CLIP (true sites) to those of non-canonical
candidates in the sam e 3′ UTRs that were not detected
(false sites, see Methods). The distribution of mirSVR
scores of the true non-canonical sites is shifted signifi-
cantly downwards (indicating more confident predic-
tions) relative to the false sites ( P < 1.7e-36, one-sided
KS test, Figure 6b). In addition, at a score cutoff of -0.1,
mirSVR precision is 0.24 and the sensitivity is 0.09, sig-
nificantly better than random prediction (P <1.0e-4,
Additional file 1, Figure S7), indicating that mirSVR
scores are meaningful in discriminating non-canonical
sites. However, the low sensitivity indicates that many of
the functional non-canonical sites are not identified at
this threshold. Future progress in id entifying functional
non-canonic al sites is likely t o require a more focused
approach that includes training on additional experi-
mental data.
Taken together, these results sugg est that certain non-
canonical sites are bona fide microR NA target sites that
contribute, either in addition to canoni cal sites or inde-
pendently, to gene silencing and that careful inclusion
of such sites in the prediction model results in a more
comprehensive target identification.
Conclusions
We have presented a comprehensive microRNA target
prediction and ranking algorithm that accurately pre-
dicts target site efficiency as measured by gene expres-
sion arrays, mass spectroscopy, enrichment in AGO-IP,
and CLIP-based experiments. Evaluation by a variety o f
measures shows that miRanda-mirSVR is competitive
with other methods when tested on mRNA and pro-
tein expression changes. We reexamined the use of
Betel et al. Genome Biology 2010, 11:R90
/>Page 9 of 14
conservation as a s election criteria for effective target
sites to establis h that s ite conservation is best used as
a feature, not a filter. mirSVR scores are calibrated to
correlate with downregulation and can be interpreted
as an empirical probability of target inhibition, leading
to an intuitive choice of score threshold. Finally, we
have shown that non-canonical sites, as determined by
the miRanda weighted alignment algorithm, can be
judiciously included into the prediction method with-
out inflating the number of false predictions, leading
to detection of functional non-canonical sites as
assessed on data from microRNA transfe ctions and
from CLIP experiments. mirSVR’ s improved perfor-
mance can be attributed to a number of modeling
choices and careful statistical analysis: using a repre-
sentation that allows variability in seed region binding,
including non-canonical seed base pairing; incorporat-
ing a wide range of m icroRNA::site duplex and contex-
tual features; training with an algorithm that avoids
overfitting; and correctly calibrating the contributions
of individual sites in order to properly score multi-site
targets. Our statistical analysis raises some questions
regarding the common notion that extent of seed com-
plementarity and conservation are primary determi-
nants of func tional sites and suggests that multiple
features, some of which exert subtle effects, determine
the efficacy of target sites.
Future directions for microRNA target prediction
Although mirSVR scores incorporate many features
important for microRNA-mediated inhibition, other
potential aspects of target specificity are not included in
the model. N ew data from high-throughput microRNA
target identification experiments, such as cross-linking
methods (HITS-CLIP [6], PAR-CLIP [7]) and Ago-IP
pulldowns [19,33], reveals that, contrary to common
belief, a significant portion of target sites are found in
coding regions of mRNAs, which are not considered by
most current target prediction methods. Predicting and
scoring target sites in the coding region will likely
require a specific model that accounts for features that
are unique to these regions, such as polyribosome occu-
panc y and translation rates. microRNA target specificity
may vary substantially between organisms, given the
diversity of RNAi pathways and the different constitu-
ents of RISC complexes. Moreover, it is entirely plausi-
ble that target specificity for a given microRNA could
change substantially between different cell types. Like-
wise, additional non-specific sequence de terminants that
are currently unknown could influence microRNA-
mediated regulation. For example, the inhibition of cog-
1 by the nematode-specific lsy-6 m icroRNA is mediated
by two target sites that are dependent on additional
non-sequence-specific context features [4]. While it
remains to be seen if such mechanisms are common, it
Figure 6 mirSVR performance on non-canonical sites. (a) A summary of the AUC scores for the Linsley et al. (brown) and Selbach et al.
(orange) data sets. ROC analysis was performed on the most downregulated targets with log expression change of Z-score ≤ -1 (true positive)
and the least regulated targets with Z-score ≥ 1 (true negative) for all sites, canonical sites only and non-canonical sites only. Note that two
experiments were excluded due to low number of false positive and false negative examples. In all but one experiment the AUC values for non-
canonical sites are above 0.5, indicating better than random detection. (b) A cumulative distribution function (CDF) plot of the mirSVR scores of
the CLIP-identified non-canonical sites (true sites) and all other non-canonical sites predicted in the same 3’ UTRs (false sites). The significant shift
in the CDF for targets identified by the CLIP method indicates that mirSVR scores can identify a subset of the efficient non-canonical sites.
Betel et al. Genome Biology 2010, 11:R90
/>Page 10 of 14
is clear that one model may not account for all types of
microRNA regulation. A number of RNA-binding pro-
teins are known to be important post-transcriptional
regulators that may have substantial effect on micro-
RNA regulation, either through cis acting mechanisms,
for example, by blocking target sites [34], or in trans,
for example, by changing the secondary structure in the
vicinity of the target site. In addition, a number of
RNA-binding motifs have been linked to modulating
microRNA-med iated regulation [35]. Finally, the balance
between the abundance of microRNAs and of RISC is
likely a critical determinant in microRNA-mediated reg-
ulation. Our recent study has shown that offsetting the
balance between microRNA levels and RISCs by exogen-
ous transfection of small RNAs can lead to a noticeable
loss on endo genous microRNA regulations, presumably
by out-competing the endogenous microRNAs for the
limited RISC [28].
Therefore, integrating both microRNA and RISC
expression levels into target p rediction is an important
goal towards more accurate modeling of microRNA reg-
ulation in a physiological context.
Materials and methods
Training and test data sets
Training data
The mRNA expression training data was taken from the
Grimson et al. [8] [GEO:GSE8501] data set, containing
expression arrays from HeLa cells transfected by miR-
122a, miR-128a, miR-132, miR-133a, miR-142, miR-
148b, miR-181a, miR-7, miR-9. Although mRNA expres-
sionwasmeasuredat12hand24hpost-transfection,
we used o nly the 24 h measurements since they gave
stronger enrichment for downregulated targets with
cano nical seed matches (data not shown). Similar to the
Grimson et al. study, we restricted our analysis to
probes with signal intensities above median in the con-
trol transfection experime nts. This filter is motivated by
the fact t hat genes must be endogenously expressed at a
reasonable level in order to be able to observe micro-
RNA-induced silencing; moreover, this reduces the
number of genes whose expression changes are induced
by the introduction of the transfection vector. For train-
ing the mirSVR model, we included only genes that con-
tained a single target site for the transfected microRNA,
allowing only canonical sites for the canonical-only
model and including restricted kinds of non-canonical
sites for the all-sites model, as described below. We did
not exclude single-site genes whose log expression
change after transfection was positive.
Test data of microRNA transfection with mRNA expression
measurements
The mRNA expression test data set was taken from the
Linsley et al. study [21] [GEO:GSE6838], which
comprised e xpression data from let-7c, miR-103, miR-
106b, miR-141, miR-15a, miR-16, miR-17-5p, miR-192,
miR-20, miR-200a, and miR-215 transfection experi-
ments (all measured after 24 h), and was processed in a
similar fashion to training set.
Test data of microRNA transfection with proteomics
expression measurements
Protein expression test data set consisting of let-7b,
miR-155, miR-16, miR-1, and miR-30a transfection
experiments was taken from the Selbach et al. study
[17]. Protein expression changes were computed as the
median of the log 2 expres sion changes of its meas ured
peptides between transf ection and control experiments.
Only proteins with unique peptide count ≥ 10 were
used to ensure unique protein identification.
Test data of microRNA inhibition with mRNA expression
measurements
Inhibition test sets were collected from three sources:
the first is miR- 106b 2′-O-methyl inhibition from [GEO:
GSM155605] [21], the second is A172 glioma cells trea-
ted with anti-miR-21 [GEO:GSM298113] [23] and the
third is LNA inhibition of miR-122 [22], where expres-
sion levels from multiple probes per genes were
averaged.
AGO IP test data
To generate a test set of mRNA targets for endogen-
ously e xpressed microRNAs, we used a rece nt study by
Landthaler et al. [19] that identified the mRNA profiles
of immunoprecipitates (IP) of the four AGO1-4 proteins
in HEK293 cells. To identify the genes a ssociated with
FLAG/HA-tagged AGO proteins complexes, the t ran-
scriptsisolatedfromtheIPswereanalyzedbymicroar-
rays and compared to the mRNA from the cleared
lysate. The gene set that is enriched in the IP samples in
comparison the lysate defines the complement of gene
targets of the endogenously expressed microRNAs. The
microRNA profile in HEK293 cells includes a number of
microRNAs which can be grouped by their se ed
sequence similarity. To generate the test set, we selected
the most abundant microRNAs from the six most com-
mon seed families (hsa-miR-16, hsa-miR-30e-5p, hsa-
miR-19b, hsa-miR-32, hsa-miR-20a and hsa-miR-21)
and searched for their target sites in genes that are
enriched in the AGO1-4 IPs. Microarray data from the
IP experiments was downloaded from [36] and normal-
ized using the GCRMA R package; log enrichment
values were computed using the limma package.
CLIP data
Data was provided by private communication from the
authors. Non-canonical sites were def ined as sequence
traces determined by the CLIP method that did not con-
tain perfect seed matches to any of the top 100 endo-
genous microRNAs expressed in HEK293 cells.
Sequence traces that matched coding regions or 5′
Betel et al. Genome Biology 2010, 11:R90
/>Page 11 of 14
UTRs were discarded and those that matched 3′ UTRs
were used to predict non-canonical target sites; in the
latter case, the endogenously expressed microRNA with
closest seed to the sequence trace was assigned to the
site. Within each identified 3′ UTR, non-canonical sites
that overlap with the CLIP-bound sequences were con-
sidered as true sites and all other non-canonical candi-
date sites for the same microRNAs were labeled as false
predictions. This procedure generated a data set of
4,692 negative sites and 883 positive sites for 54
microRNAs.
Predicting target sites
In order to search for canonical seed matches and
restricted non-canonical sites and to obtain predicted
miRNA::target duplexes, we used a modified version of
the miRan da algorithm [11], miRanda 2.0, using a score
cutoff (-sc) of 120, gap opening and gap extension (-go
-ge) of -9 and -4 respectively. The modified versi on
excludes the first 5′ base and last two 3′ bases of the
microRNA from the ali gnment and allows for only a
single G:U or mismatch in the seed region (po sitions 2
to 7). The algori thm computes an op timal sequence
complementarity alignment between the microRNA and
mRNA using a weighted dynamic programming
approach where matches in the seed regions have higher
position-specific weights, res ulting in alignment s that
strongly favor 5′ base-pairing. 3′ UTR seq uences were
downloaded from UCSC genome browser, with the
longest UTR chosen from afilternative isoforms. “ Cano-
nical target” sites are defined as sites that contain mini-
mally a 6-mer perfect match at positions 2 to 7 of the
microRNA.
Target site features
Each target site is represented by a feature vector that
encodes binary descriptors of the microRNA::mRNA
duplex, extracted from miRanda alignment outputs, and
additional contextual information such as the UTR
length, AU composition, conservation and secondary
structure accessibility scores. The predicted miRNA::site
is repre sented by a seed bit vector denoting matches at
positions 2 t o 8 of the microRNA and presence of
nucleotide ‘ A′ across from posit ion 1; an additional bit
for a match at microRNA position 9; and a feature for
binding at the 3′ end of the microRNA. The seed bit
vector represents different types of canonical seeds as
well as non-canonical seeds in a uniform manner.
AU composition scores and 3′ binding were computed
as previously described [8]. Briefly, AU scores are
defined as the sum of the adenosine or uridine bases
over a window of 30 bases flanking the target sites,
invers ely weighted by their distance from the target site.
3′ binding is defined as the number of perfect base pairs
between positions 12 to 17.
Accessibility scores were computed using RNAplfold
[37] with the following parameters: w = 80, L =40and
u = 8 on a window of 160 bases around the target site.
In practice, the accessibility scores for positions -20 to
+20 averaged over a window of two bases were used for
the SVR model. We used phastCons scores [38] for tar-
get site conservation, which measures the conservation
of nucleotide positions across multiple vertebrates. The
features and expression values (that is, log expres sion
changes for t raining data and Linsley et al. test set, pro-
teomics expression for Selbach et al. test set, and IP
enrichment for Landthaler et al. test set) were Z-score
transformed.
Context score and PITA scores
Context scores values were computed using the source
code downloaded from [39] that implements the regres-
sion model described in Grimson et al. 2007. Briefly,
context score is composed of three r egression values,
which are specific to each seed class, that model the
correlation between the AU composition, 3′-binding and
distance from the nearer end of the UTR with mRNA
downregulation. T arget sites are first classified into one
of the four seed c lasses: 6-mer, T1A 7-mer, m8 7-mer
and 8-mer; the context score is computed as the sum of
the three regression values specific to the seed class.
The computed context scores are hi ghly correlated with
the scores downloade d from TargetScan release 5.0
(0.96 average Pearson correlation, see Additional file 1,
Table S1). PITA scores were computed with code down-
loaded from [40] using default parameters. Target sites
that did not match the po sition of our miRanda pre-
dicted sites (up to three bases) were discarded.
Support vector regression
We adopted a support vector regression (SVR) approach
to mod el the degree of microRNA regulation given a set
of numerical features representing the microRNA bind-
ing site and additional contextual information. SVR uses
labeled training data {(x
i
, y
i
)}
i = 1 m
to learn a linear
function
fb() ,xwx=〈 〉+
that estimates the real-valued output y for an example
from its feature vector x. As in support vector machine,
w is called the weight vector and b the bias term. In
contrast to ordinary least squares regression, SVR uses
an epsilon-insensitive loss function,
Lf f yxx
()
()
=
()
−−
()
,max, ,y 0
Betel et al. Genome Biology 2010, 11:R90
/>Page 12 of 14
so that the optimization problem only penalizes exam-
ples whose outputs fall outside an “epsilon tube” around
the prediction function; here is a parameter chosen
prior to training. SVR training was performed using the
libsvm package with the following parameters: -s 4
-t 0 -c 1.0e-1 -n 5e-1 (that is, v SVR with a linear
kernel).
Non-linear transformation of prediction scores
mirSVR scores were transformed using the sigmoid
function
t
abc
x
c
axb
,,
()
exp
=
−
+⋅−
()
+
()
1
. To learn the a, b, c
parameters we performed five-fold cross-validation on
the training data (single-site genes from Grimson et al.
data set) and assembled the mirSVR prediction score s
computed on each of the held-out sets. We then fit the
parameters of the sigmoid function using MATLAB
nlinfit function which performs a non-line ar regres-
sion of mirSVR scores from the five-fold cross validation
against their ( Z-transformed) log expression changes.
Finally, we retrained mirSVR on all the Grimson et al.
data and t ra nsformed mirSVR prediction scores on test
data using the sigmoid transfer function.
Additional material
Additional file 1: Supplementary material and figures. Supplementary
data and figures.
Abbreviations
3′UTR: 3′ untranslated region; AGO: Argonaute protein; AGO-IP: AGO
immunoprecipitation; AUC: area under the curve; CLIP: cross-linking and
immunoprecipitation; PAR-CLIP: Photo Activatable Ribonucleoside enhanced
CLIP; RISC: RNA-induced silencing complex; ROC: receiver operating
characteristic; SVM: support vector machine; SVR: support vector regression.
Acknowledgements
We thank Debora Marks for helpful discussions; Aly Khan for technical
assistance; Rob Sheridan, Manda Wilson and Aaron Gabow for adaptation of
mirSVR scores to miRanda sites at the target
prediction resource; and Markus Hafner and Tom Tuschl for providing the
PAR-CLIP data. This work was supported by NIH grants PO1GM073047 and
1U24CA143840.
Author details
1
Computational Biology Program, Memorial Sloan-Kettering Cancer Center,
1275 York Avenue, New York, 10065, NY, USA.
2
Department of Computer
Science, Columbia University, 1214 Amsterdam Avenue, New York, 10027,
NY, USA.
Authors’ contributions
DB, CS and CL conceived the project. DB designed and implemented the
algorithm and performed the analysis. AK and PA contributed to the
computational analysis. DB and CL wrote the paper. CL helped to develop
the algorithmic approach and supervised the research. All authors read and
approved the final manuscript.
Received: 26 April 2010 Accepted: 27 August 2010
Published: 27 August 2010
References
1. Filipowicz W, Bhattacharyya SN, Sonenberg N: Mechanisms of post-
transcriptional regulation by microRNAs: are the answers in sight? Nat
Rev Genet 2008, 9:102-14.
2. Lai EC: MicroRNAs are complementary to 3′ UTR sequence motifs that
mediate negative post-transcriptional regulation. Nat Genet 2002,
30:363-4.
3. Didiano D, Hobert O: Perfect seed pairing is not a generally reliable
predictor for miRNA-target interactions. Nat Struct Mol Biol 2006,
13:849-51.
4. Didiano D, Hobert O: Molecular architecture of a miRNA-regulated 3′
UTR. RNA 2008, 14:1297-317.
5. Lal A, Navarro F, Maher CA, Maliszewski LE, Yan N, O’Day E, Chowdhury D,
Dykxhoorn DM, Tsai P, Hofmann O, Becker KG, Gorospe M, Hide W,
Lieberman J: miR-24 Inhibits cell proliferation by targeting E2F2, MYC,
and other cell-cycle genes via binding to “seedless” 3′ UTR microRNA
recognition elements. Mol Cell 2009, 35:610-25.
6. Chi SW, Zang JB, Mele A, Darnell RB: Argonaute HITS-CLIP decodes
microRNA-mRNA interaction maps. Nature 2009, 460:479-486.
7. Hafner M, Landthaler M, Burger L, Khorshid M, Hausser J, Berninger P,
Rothballer A, Ascano M Jr, Jungkamp AC, Munschauer M, Ulrich A,
Wardle GS, Dewell S, Zavolan M, Tuschl T: Transcriptome-wide
identification of RNA-binding protein and microRNA target sites by PAR-
CLIP. Cell 2010, 141:129-41.
8. Grimson A, Farh KK, Johnston WK, Garrett-Engele P, Lim LP, Bartel DP:
MicroRNA targeting specificity in mammals: determinants beyond seed
pairing. Mol Cell 2007, 27:91-105.
9. Nielsen CB, Shomron N, Sandberg R, Hornstein E, Kitzman J, Burge CB:
Determinants of targeting by endogenous and exogenous microRNAs
and siRNAs. RNA 2007, 13:1894-910.
10. Krek A, Grün D, Poy MN, Wolf R, Rosenberg L, Epstein EJ, MacMenamin P,
da Piedade I, Gunsalus KC, Stoffel M, Rajewsky N: Combinatorial microRNA
target predictions. Nat Genet 2005, 37:495-500.
11. John B, Enright AJ, Aravin A, Tuschl T, Sander C, Marks DS: Human
MicroRNA targets. PLoS Biol 2004, 2:e363.
12. Lall S, Grun D, Krek A, Chen K, Wang YL, Dewey CN, Sood P, Colombo T,
Bray N, Macmenamin P, Kao HL, Gunsalus KC, Pachter L, Piano F,
Rajewsky N: A genome-wide map of conserved microRNA targets in C.
elegans. Curr Biol 2006, 16:460-71.
13. Kruger J, Rehmsmeier M:
RNAhybrid: microRNA target prediction easy,
fast and flexible. Nucleic Acids Res 2006, 34:W451-4.
14. Hammell M, Long D, Zhang L, Lee A, Carmack CS, Han M, Ding Y,
Ambros V: mirWIP: microRNA target prediction based on microRNA-
containing ribonucleoprotein-enriched transcripts. Nat Methods 2008,
5:813-9.
15. Kertesz M, Iovino N, Unnerstall U, Gaul U, Segal E: The role of site
accessibility in microRNA target recognition. Nat Genet 2007, 39:1278-84.
16. Hausser J, Landthaler M, Jaskiewicz L, Gaidatzis D, Zavolan M: Relative
contribution of sequence and structure features to the mRNA binding of
Argonaute/EIF2C-miRNA complexes and the degradation of miRNA
targets. Genome Res 2009, 19:2009-20.
17. Selbach M, Schwanhausser B, Thierfelder N, Fang Z, Khanin R, Rajewsky N:
Widespread changes in protein synthesis induced by microRNAs. Nature
2008, 455:58-63.
18. Baek D, Villén J, Shin C, Camargo FD, Gygi SP, Bartel DP: The impact of
microRNAs on protein output. Nature 2008, 455:64-71.
19. Landthaler M, Gaidatzis D, Rothballer A, Chen PY, Soll SJ, Dinic L, Ojo T,
Hafner M, Zavolan M, Tuschl T: Molecular characterization of human
Argonaute-containing ribonucleoprotein complexes and their bound
target mRNAs. RNA 2008, 14:2580-96.
20. Smola A, Scholkopf B: A tutorial on support vector regression. Statistics
and Computing 2004, 14:199-222.
21. Linsley PS, Schelter J, Burchard J, Kibukawa M, Martin MM, Bartz SR,
Johnson JM, Cummins JM, Raymond CK, Dai H, Chau N, Cleary M,
Jackson AL, Carleton M, Lim L: Transcripts targeted by the microRNA-16
family cooperatively regulate cell cycle progression. Mol Cell Biol 2007,
27:2240-52.
22. Elmén J, Lindow M, Silahtaroglu A, Bak M, Christensen M, Lind-Thomsen A,
Hedtjärn M, Hansen JB, Hansen HF, Straarup EM, McCullagh K, Kearney P,
Kauppinen S: Antagonism of microRNA-122 in mice by systemically
Betel et al. Genome Biology 2010, 11:R90
/>Page 13 of 14
administered LNA-antimiR leads to up-regulation of a large set of
predicted target mRNAs in the liver. Nucleic Acids Res 2008, 36:1153-62.
23. Gabriely G, Wurdinger T, Kesari S, Esau CC, Burchard J, Linsley PS,
Krichevsky AM: MicroRNA 21 promotes glioma invasion by targeting
matrix metalloproteinase regulators. Mol Cell Biol 2008, 28:5369-80.
24. Enright AJ, John B, Gaul U, Tuschl T, Sander C, Marks DS: MicroRNA targets
in Drosophila. Genome Biol 2003, 5:R1.
25. Maragkakis M, Alexiou P, Papadopoulos GL, Reczko M, Dalamagas T,
Giannopoulos G, Goumas G, Koukis E, Kourtis K, Simossis VA, Sethupathy P,
Vergoulis T, Koziris N, Sellis T, Tsanakas P, Hatzigeorgiou AG: Accurate
microRNA target prediction correlates with protein repression levels.
BMC Bioinformatics 2009, 10:295.
26. Friedman RC, Farh KK, Burge CB, Bartel DP: Most mammalian mRNAs are
conserved targets of microRNAs. Genome Res 2009, 19:92-105.
27. Bartel DP: MicroRNAs: target recognition and regulatory functions. Cell
2009, 136:215-33.
28. Khan AA, Betel D, Miller ML, Sander C, Leslie CS, Marks DS: Transfection of
small RNAs globally perturbs gene regulation by endogenous
microRNAs. Nat Biotechnol 2009, 27:549-55.
29. Landgraf P, Rusu M, Sheridan R, Sewer A, Iovino N, Aravin A, Pfeffer S,
Rice A, Kamphofirst AO, Landthaler M, Lin C, Socci ND, Hermida L, Fulci V,
Chiaretti S, Foà R, Schliwka J, Fuchs U, Novosel A, Müller RU, Schermer B,
Bissels U, Inman J, Phan Q, Chien M, Weir DB, Choksi R, De Vita G,
Frezzetti D, Trompeter HI, et al: A Mammalian microRNA Expression Atlas
Based on Small RNA Library Sequencing. Cell 2007, 129:1401-1414.
30. Vella MC, Choi EY, Lin SY, Reinert K, Slack FJ: The C. elegans microRNA let-
7 binds to imperfect let-7 complementary sites from the lin-41 3′ UTR.
Genes Dev 2004, 18:132-7.
31. Wu L, Belasco JG: Micro-RNA regulation of the mammalian lin-28 gene
during neuronal differentiation of embryonal carcinoma cells. Mol Cell
Biol 2005, 25:9198-208.
32. Yekta S, Shih IH, Bartel DP: MicroRNA-directed cleavage of HOXB8 mRNA.
Science 2004, 304:594-6.
33. Hendrickson DG, Hogan DJ, Herschlag D, Ferrell JE, Brown PO: Systematic
identification of mRNAs recruited to argonaute 2 by specific microRNAs
and corresponding changes in transcript abundance. PLoS One 2008, 3:
e2126.
34. Kedde M, Strasser MJ, Boldajipour B, Oude Vrielink JAF, Slanchev K, le
Sage C, Nagel R, Voorhoeve PM, van Duijse J, Ørom UA, Lund AH,
Perrakis A, Raz E, Agami R: RNA-binding protein Dnd1 inhibits microRNA
access to target mRNA. Cell 2007, 131:1273-86.
35. Jacobsen A, Wen J, Marks DS, Krogh A: Signatures of RNA binding
proteins globally coupled to effective microRNA target sites. Genome Res
2010, 20:1010-9.
36. RNA regulatory networks, Zavolan Lab. [ />37. Tafer H, Ameres SL, Obernosterer G, Gebeshuber CA, Schroeder R,
Martinez J, Hofacker IL: The impact of target site accessibility on the
design of effective siRNAs. Nat Biotechnol 2008, 26:578-83.
38. Siepel A, Bejerano G, Pedersen JS, Hinrichs AS, Hou M, Rosenbloom K,
Clawson H, Spieth J, Hillier LW, Richards S, Weinstock GM, Wilson RK,
Gibbs RA, Kent WJ, Miller W, Haussler D: Evolutionarily conserved
elements in vertebrate, insect, worm, and yeast genomes. Genome Res
2005, 15:1034-50.
39. TargetScan. [].
40. PITA source code. [ />41. Elmén J, Lindow M, Schütz S, Lawrence M, Petri A, Obad S, Lindholm M,
Hedtjärn M, Hansen HF, Berger U, Gullans S, Kearney P, Sarnow P,
Straarup EM, Kauppinen S: LNA-mediated microRNA silencing in non-
human primates. Nature 2008, 452:896-9.
doi:10.1186/gb-2010-11-8-r90
Cite this article as: Betel et al.: Comprehensive modeling of microRNA
targets predicts functional non-conserved and non-canonical sites.
Genome Biology 2010 11:R90.
Submit your next manuscript to BioMed Central
and take full advantage of:
• Convenient online submission
• Thorough peer review
• No space constraints or color figure charges
• Immediate publication on acceptance
• Inclusion in PubMed, CAS, Scopus and Google Scholar
• Research which is freely available for redistribution
Submit your manuscript at
www.biomedcentral.com/submit
Betel et al. Genome Biology 2010, 11:R90
/>Page 14 of 14