Báo cáo y học: " Patient-oriented gene set analysis for cancer mutation data" pps
Bạn đang xem bản rút gọn của tài liệu. Xem và tải ngay bản đầy đủ của tài liệu tại đây (458.21 KB, 10 trang )
MET H O D Open Access
Patient-oriented gene set analysis for cancer
mutation data
Simina M Boca
1
, Kenneth W Kinzler
2
, Victor E Velculescu
2
, Bert Vogelstein
2
, Giovanni Parmigiani
3*
Abstract
Recent research has revealed complex heterogeneous genomic landscapes in human cancers. However, mutations
tend to occur within a core group of pathways and biological processes that can be grouped into gene sets.
To better understand the significance of these pathways, we have developed an approach that initially scores each
gene set at the patient rather than the gene level. In mutation analysis, these patient-oriented methods are more
transparent, interpretable, and statistically powerful than traditional gene-oriented methods.
Background
To date, the sequences of all coding exons (the exome)
have been determined in 74 cancers [1-8]. These studies
have reve aled that advanced cancers each generally
harbor between 30 and 80 point m utations or small
insertions or deletions. Other genetic alterations, such as
amplifications and homozygous deletions, contribute
another ten genes per tumor. These alterations can be
categorized into two classes: ‘drivers’ ,whichbestowa
growth advantage on the cancer cell, inhibiting cell death
or promoting cell birth and ‘passengers’ which coinciden-
tally occurred in a cell that later or concurrently devel-
oped a driver mutation, but had no effect on cell
proliferation. These same studies have defined a land-
scape consisting of both ‘mountains’ - drivers which are
mutated at high frequency in t umors of the sam e type -
and ‘hills’ - drivers which are mutated at low frequency
in these tumors. Most driver genes appear to be hills,
making it difficult or impossible to distinguish them from
passenger mutations on the basis of frequency alone.
A variety of bioinformatic studies based on these data
have suggested that the mountains and hills, though het-
erogeneous among tumors, can be grouped into a much
smaller set of pathways and biologic processes called
‘ gene sets.’ This has led to the idea that an analysis of
gene sets constituting these pathways and b iologic
processes may provide more info rmation about the path-
ways altered in cancers than an analysis of individual
genes.
Sequencing studies completed prior to those involving
large scale sequencing have additionally revealed an
‘exclusivity principle’. Within a single pathway, it is rare
for multiple genes to be al tered in a single tumor. Thus a
tumor with a KRAS mutation generally does not also har-
bor a BRAF mutation, as KRAS is upstream of BRAF in
the same pathway [9]. Similarly, PIK3CA and PTEN
mutations do no t generally occur in the same tumor, and
other genes in the same pathway are also mutually exclu-
sive [10]. The explanation for this principle is that once a
mutation alters a pathway, the selective growth advantage
incurredbyasecondmutationinthesamepathwayis
minimal. Larg e scale seque ncing studies of cancers
[4,11,12] have provided additional support for the exclu-
sivity principle.
Recent cancer genome projects have therefore evalu-
ated gene sets in addition to scoring genes based on the
number and types of alterations observed. Many methods
have been proposed for this statistical task, beginning
with [13] and [14] and reviewed in [15]. Most of these
methods are gene-oriented, in that they first calculate a
score for each gene while assigning each gene to a parti-
cular gene set. The next step is to determine which gene
sets carry better scores than predicted by chance. In
mutation analysis this also involves normalizing for the
number of genes in each gene set and the sizes and
nucleotide compositions of each gene in each gene set.
Gene set analysis was originally devised to evaluate
expression data and when applied to mutational data,
* Correspondence:
3
Department of Biostatistics, Harvard School of Public Health and
Department of Biostatistics and Computational Biology, Dana-Farber Cancer
Institute, 44 Binney Street, Boston, MA 02115, USA
Full list of author information is available at the end of the article
Boca et al. Genome Biology 2010, 11:R112
/>© 2010 Boca et al.; licensee BioMed Central Ltd. This is an open access article distributed under the terms of the Creative Commons
Attribution Lice nse (http://c reativecommons.org/licenses/by/2.0), which permits unrestricted use, distribution, and reproduction in
any medium, provided the original work is properly cited.
has not yet taken into account the exclusivity principle.
By summarizing the data across patients one gene at the
time, conventional gene set approaches are not able to
differentiate between two very different scenarios. For
example, consider a gene set including ten genes, and
suppose ten different mutations are found among ten
cancers of the same type. In one scenario, each of the
ten genes might have a single mutation and, consistently
with the exclusivity principle, one mutation may occur
in each of the ten patients. In another scenario, one can-
cer might have mutations in all ten genes in the path-
way, and the other nine cancers might each have no
mutations. Conventional gene s et analysis methods,
which focus only on the number of alterations in a gene
among the ten patients, cannot distinguish between
these two scenarios. However, from a biological stand-
point, in the former case, all patients have the relevant
pathway altered while in the latter, only one patient has
any mutations in this pathway.
We here describe a patient-oriented approach that fac-
tors in the principles noted above. Basically, we comput e
a patient-based score for each gene set. In its simplest
version, this score can only have two values - one or zero
(that is i t is binary): the score is one if any gene within
the gene set is altered in the individual patient’stumor
and zero if no gene is altered. Though a strict interpreta-
tion of the exclusivity principle should preclude two
genes in th e same gene set fr om being altered i n the
same tumor, the present state of genome annotation is
imperfect and also many genes are components of more
than one gene set. Our approach allows us to cope with
this imperfection while maintaining statistical rigor. We
believe that this new analytic method more accurately
reflects the selective pressures that drive mutation acqui-
sition in naturally occurring cancers. Our assumption
provides a unifying theme for organizing the mutations
but there are exceptions, such as PIK3CA and PTEN in
endometrial cancers. These exceptions are currently a
weakness in our patient-centric model, but we believe
they are uncommon. We note that other alterations, such
as differences in copy number or epigenetic silencing,
will be importan t to tumor growth, but our study is con-
cerned only with the interpretation of the significance of
genes that are altered through point mutations.
Results and disc ussion
Gene set analysis tools
We developed a number of patient-oriented te chniques
and compared them to each other as well as to a stan-
dard gene-oriented approach for analysis of the same
data and gene sets.
For the gene-oriented approach, we started out with
gene-specific scores. For each gene, the total number of
mutations across all tumor samples was compared to that
predicted from the passenger mutation rate, providing a
score. The genes were then ranked ac cording to these
scores, with the most muta ted genes ranked highest. For
each gene set, we then determined whether the ranks of
the scores for the genes within that gene set were higher
than predicted by chance. The details of the scoring we
used for this analysis are described in the Methods section.
For the main patient-oriented approa ch, we calculated
ascore(T
s
) for each gene set, defining this score in the
simplest way possible ( [3,11] and [12]): the score is the
number of patients in which the gene set is altered. We
then considered randomly assigned mutations for
the null hypothesis. For example, suppose that one of
the tumors contained 60 mutations. The 60 mutations
were randomly assigned to 60 different genes. A similar
permutation was performed for each tumor. We then
determined the scores for each gene set, that is, the
number of patients in which the gene set was altered by
one or more of the randomly assigned mutations.
Finally, we assessed whether the scores of gene sets con-
taining the randomly assigned genes was statistically dif-
ferent from the scores calculated from the actual
experimental data. We also considered three other varia-
tions on this method (one where the null hypothesis
considers mutations obtained from estimated passenger
probabilities and two where tumor heterogeneity i s
included in the T
s
score, using either a permutation or a
passenger null). Mo re detailed descriptions of the statis-
tical m ethods, as well as mathe matical proofs, are
described in Methods and expanded in the Additional
file 1.
Experimental results
We analyzed the mutation data on glioblastoma multi-
forme (GBM) patients in [4] using the patient-oriented
and gene-oriented methods. The gene set annotations
came from the MetaCore database [16]. We considered
3,071 sets, having between 3 and 2,096 genes. There was
substantial o verlap between the set annotations (mean:
33 genes; median : 9 genes; interquartile range: 5 to
29 genes).
In the GBM experimental dataset, 1,454 of the 3,071
genesetswerealteredinatleastonesample.Ofthe
1,454 gene sets with at least one alte red gene, the gre at
majority (1,131, representing 78%) had only one altera-
tion per sample, in accordance with the exclusivity prin-
ciple. The composition of these 1,131 gene sets was
somewhat similar to those of the total 3,071 gene sets
(mean: 17 genes; median: 8 genes; interquartile range:
4 to 20 genes). In contrast, there were 323 gene sets
which had two or more alterations and these tended to
be considerably larger than the average gene set (mean:
167 genes; median 116 genes; interquartile range: 61 to
197 genes). Note that the exclusivity principle is
Boca et al. Genome Biology 2010, 11:R112
/>Page 2 of 10
incompatible with passenger mutations occurring in the
same gene set as driver mutations; passenger mutations
are more likely to occur in bigger genes and in larger
gene sets by chance alone. It is also possible that some of
the gene sets fail to obey the exclusivity principle because
they encompass parts of multiple pathways or processes,
or because of faulty annotations. Information gained
from gene set analysis, whether it be patient-oriented or
gene-oriented, will improve as biologic knowledge of the
relevant processes and pathways continually improves.
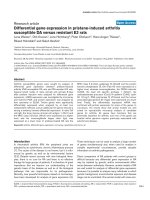
In Figure 1, a s catter plot of the number of GBM
mutations per gene set (T
s
) v s the size of each gene set
provides an overall sense of the variation. The exp ected
number of mutations for each gene set under one of the
null hypotheses (see Methods), as well as the values
within two standard deviations of the expected number,
are overlaid on these experimental data. These results
show that mutati ons tend to cluster within gene sets far
more than one would expect by chance. In particular,
the re were a large number of sets whose T
s
scor es were
more than two standar d deviations away from the
expected mean under the null hypothesis. Though this
GBM study had only 21 subjects, it was still possible to
get useful information at the gene set level for sets
including as many as a few hundred genes; a larger
number of tumors would have to be evaluated to get a
statistically significant result f or the largest gene sets.
A more in-depth view of the dependence between the
null distribution of T
s
and the size of the gene set is
presented in Additional file 2. We developed and stu-
died four implementations of the patient-oriented meth-
ods, differing only by the nature of the assumptions
used to generate the null distributions and the normali-
zation methods (see Methods). The patient-oriented
methods and the gene-oriented method are further
compared in Figure 2, which shows (using the CAT plot
introduced in [17]) that t he same gene set s are com-
monly identified by any two of t he patient-oriented
methods but that differ ent gene sets are often identified
by the gene- orien ted method. (The plot shows only two
of the patient-oriented methods being compared to the
gene-oriented method, for the sake of clarity, but the
remaining two display a similar behavior.)
Which approach is superior at identifying the ‘ true’
gene sets involved in GBM? One way to address this
question is through the evaluation of pathways known
to be involved in this tumor type. Among the gene sets
evaluated were those containing the PI3K or RB1 path-
ways, which are known to be altered in GBM. We
would therefore expect that many of the gene sets con-
taining the PI3K or RB1 pathways would be ranked high
in any robust analysis of GBM mutational data. With
the patient-oriented approach, we found all but one of
the 15 gene sets containing PI3K or RB1 to be ranked at
a high and statistically significant level (Additional
file 3). In contrast, many gene sets containing the PI3K
or RB1 pathways were not highly ranke d with the gene-
oriented method.
Another example of the superiority of th e patient-
oriented approach was provided by an analysis of the
106 gene sets containing TP53, the gene most frequently
mutated in GBMs (10 of 21 sampl es). The presence of a
mutat ion in a specific gene in a large fraction of tumors
should implicate virtually any gene set containing that
gene in the tumorigenic process. A gene set analysis
with the patient-oriented method was in accord with
this expectation, while an equivalent analysis with the
gene-orientedmethodwasnot(allofthegenesets
ranked among the top 50 contained TP53 when using
the patient-oriented approach, with the exception of a
single set in one of the four methods, whereas only four
of the gene sets ranked among the top 50 contained
TP53 when using the gene-oriented method). In the
tumor subset in which TP53 was mutant, each of the
top52sets(havingranksofatmost50,duetoties)
included TP53, when analyzed with the main patient-
oriented method. With the gene-oriented method, only
ten of t he top 50 gene sets included TP53 in those
tumors in which TP53 was itself mutant.
We also looked at the sets which contained other can-
didate cancer genes (CAN-genes), as defined in [4],
except for CDKN2A and CDK4,whichwerenot
mutated in any of the samples we considered. There
0 500 1000 1500 2000
0 5 10 15 20
Number of genes in gene sets
T
s
(Number of samples gene sets are altered in)
T
s
E(T
s
|H
s0
)+2SD(T
s
|H
s0
)
E(T
s
|H
s0
)
E(T
s
|H
s0
)−2SD(T
s
|H
s0
)
Figure 1 Observed (blue) and expected number of altered
samples (T
s
) across the gene sets in the dataset from [4],asa
function of the size of the gene set. The expected numbers are
computed using the permutation null and denoted by E(T
s
|H
s0
). The
values within two standard deviations of the E(T
s
|H
s0
) are also
shown.
Boca et al. Genome Biology 2010, 11:R112
/>Page 3 of 10
were 411 se ts in which at least one of these genes was
present, but TP53 wasnot.Theirmedianrankswere
between 334 and 348 in each of the four patient-
oriented methods.
Our methods permits sample size estimations for
future studies which would draw from the same or a
similar sample of tumors via simulation. We note that
the number of patients required for significant results
will vary from set to set, depending on the size of the
gene set and the frequency with which it is altered. Con-
sider for example the response to retinoic acid, which
has the lowest P-value u nder the main patient-oriented
method we consider, and is composed of only seven
genes, of which TP53 and LRP2,bothCAN-genes,are
altered i n a total of 12 samples. Out of 100 simulations
performed in which 5 of the 21 patients were considered
each time, 65 assign it a q-value of 0.1 or lower, which
would often be considered significant. However, if we
consider the set of genes i nvolved in PLAU signaling in
cell adhesion, which consists of 42 genes (three of
which are CAN-genes) altered in seven samples, the
simulation results would look very different. In the
actual dataset, this gene set has a rank of 154.5, but
nonethel ess, is significant (q-value of 0.007). Out of 100
simulations with 5 samples, it only had a q-value less
than or equal to 0.1 se ven times; for 10 and 15 samples,
this number went up to 42, respectively 76.
We also analyzed (see Additional file 4) data from
three additional studies that comprehensively examined
somatic mutations in breast, colorectal, and pancreatic
tumors, reaching qualitatively similar conclusions.
Controlled simulation results
To systematically examine t he value of our method, we
performed 100 simulations with the exi sting (3,071) gene
sets presenting data consistent with a null distribution
and other gene sets ‘ spiked-in,’ that is having a high
probability of being altered in varying proportions of the
samples considered. These sets each have sizes of 25,
100, and 250 genes, with probabilities of being altered in
a given patient of 0.25, 0.50, 0.75 and 0.90, resulting in 12
artificially generated sets. They were chosen to cover a
005100010050
0.0 0.2 0.4 0.6 0.8 1.0
List size
Common fraction
Comparisons
Permutation null without heterogeneity vs. permutation null with heterogeneity
Passenger null without heterogeneity vs. passenger null with heterogeneity
Permutation null without heterogeneity vs. passenger null without heterogeneity
Permutation null without heterogeneity vs. gene−oriented method
Passenger null without heterogeneity vs. gene−oriented method
Figure 2 CAT plot comparing the patient-oriented methods to the gene-oriented method for the glioblastoma data from [4]. Each
graph represents a pairwise comparison of two methods: The gene sets are ranked according to the P-value, a list of top gene sets is created at
each rank, then the fraction of gene sets in the list common to both methods is graphed.
Boca et al. Genome Biology 2010, 11:R112
/>Page 4 of 10
wide range of gene set sizes and probabilities: For exam-
ple, there were 260 sets containing between 20 and
30 genes, 124 sets containing betw een 75 and 125 genes ,
and 23 sets containing between 225 and 275 genes.
We considered two ways of generating null distribu-
tionsinoursimulations:onewherethedataonthe
genes present in the ‘nul l’ gene sets were obtained by
permutation, and one where they were generated
according to pre-specified mutation rates; further details
are given in the Methods section. Using these simulated
datasets, the patient-oriented approaches and the gene-
oriented methods were compared with respect to sensi-
tivity and specificity . In the analyses below, the spiked-
in sets represent the biological signal, and if, discovered,
are ‘true positives.’ The remaining gene sets represent
the background noise, and if discovered, are ‘ false
positives.’
Sensitivity (power)
We compared the patient-oriented methods to the gene-
oriented method in terms of the ranks of the spiked-in
sets. The simulation results for the permutation null are
presented in the top panel of Figure 3, showing how
many spiked-in gene sets are identified within the top
scoring sets. For example, for the primary patient-
oriented approach, eight of the 12 spiked-in gene sets
were among the top ten-scoring gene sets. Ideally, the
plot would show a straight line for ranks between one
and twelve, as indicated by the red segment. On average,
the four patient-oriented methods identified more true
positives for a given list size than the gene-oriented
method.
Among the spiked-in gene sets considered, five are
generally given good ranks by both the patient-oriented
methods and the gene-oriented one. The se gene sets
tend to have bo th a relatively small number of genes
and a high probability of being altered in any given
patient, that is those with 25 genes and probabilities of
being altered of 0.50, 0.75, and 0.90 and those with
100 genes and probabilities of being altered of 0.75 and
0.90. However, when the gene set size increases or the
probability of being altered decreases, the patient-
oriented methods perform better. For example, the gene
set with 100 genes and a probability of being altered of
0.50 had median ranks of eight or nine across the
100 simulations for each of the patient-oriented meth-
ods, while for the gene-oriented method, the median
rank was 2 8.5. Similar results were obtained with the
gene set with 25 genes and probability 0.25 (the median
rank of the patient-oriented approaches was between
nine and ten, while for the gene-oriented approach it is
14), the gene sets with 250 genes and probabilities
0.90 (median ranks of five or six with the patient-
oriented approaches versus 35 with the gene-oriented
approach) and 0.75 (median ranks of seven or eight
versus 201). The remaining three spiked-in gene sets
generally did not achieve good ranks in either approach,
due to the combination of the large number of genes
and low pr obability of being altered; but again, the
patient-oriented methods generally ranked them higher
than the gene-oriented method.
An analogous graph for a second set of simulations
which uses the pre-specified mutation rates to obtain
the ‘ null’ gene sets is presented in Figure 3, bottom
panel. Results were qualita tively similar. For example,
the gene set of size 250 and probability 0.75 got good
median ranks with the patient-oriented methods (seven
across the board), but a poor median rank with the
gene-oriented approach (91).
We conclude that i n simulation scenarios reflecting
the exclusivity principle, patient-oriented methods have
better power, especially for larger gene set sizes and
lower probabilities of being altered.
Specificity
We also considered how well the patient-oriented and
gene-oriented approaches performed in terms of the
number of false positives. Figure 4 shows plots of the
actual true fraction of false positives versus the q-value
for the 100 controlled simulations, employing the two
different ways of generating null distributions (see
above and Methods). In the ideal scenario the q-value s
would fall below the identity line, meaning that the
q-values accurately control the false discovery rate
(FDR). The patient-oriented approaches generally show
appropriate behavior in both sets of simulations, as the
true fraction of false discoveries is generally close to or
much lower than the q-value. This is generally what is
desired with an analytic method, as it lends confidence
to the highest ranking gen e sets. In contrast, t he gene-
oriented methods are anti-conservative: they identify a
relatively large number of false positive gene sets, and
are overly confident about the presence of false positives
in the lists they generate. The two patient-oriented
approaches that employ the passenger null are some-
what anti-conservative (though much less so than
the gene-oriented approach) for the permutation null
data-generating mechanism. This is due to the data-
generatin g mechanism implying a higher rate of pass en-
ger mutations than is given by the actual estimated
passenger rate, sinc e the events being permuted include
those in CAN-genes.
Conclusions
We have developed and evaluated a patient-oriented
approach for the gene set analysis of mutation data in
cancer genome studies.
We performed simulations with spiked-in gene sets
and applied the patient-oriented methods as well as the
gene-oriented methods to their analysis. We found that
Boca et al. Genome Biology 2010, 11:R112
/>Page 5 of 10
the patient-oriented methods tended to outperform the
gene-oriented methods in terms of power, especially
when considering gene sets of a large size o r low prob-
abilities for alteration. We also appear to be gaining
power when considering the r eal mutation data in [4],
as many gene sets which had prior evidence of being
altered received better scores/ranks with our approach
than with the gene-oriented approach. Our new patient-
oriented methods also performed better in terms of spe-
cificity (Figure 4).
Our results validate t he analyses presented in [3] and
[4] i n three important ways: They provide a formal sta-
tistical evaluation of the properties and performance of
patient-oriented gene set methods; they quantify the
value added of patient-centered analyses over commonly
used gene-centered analyses; and they confirm that in
2 4 6 8 10 12 14
0 2 4 6 8 10 12
Permutation null
List size
Number of true discoveries
2 4 6 8 10 12 14
024681012
Passenger null
List size
Number of true discoveries
Patient−oriented methods
Permutation null without heterogeneity
Permutation null with heterogeneity
Passenger null without heterogeneity
Passenger null with heterogeneity
Gene−oriented method
Figure 3 Power analysis. Plot of the average number of truly positive (spiked-in) gene sets included in the top X gene sets, as X varies. The red
line indicates the ideal scenario over 100 simulation runs. Simulations use the permutation null (top panel) or the passenger null (bottom panel)
data-generating mechanisms. The four patient-oriented methods return more true positives than the gene-oriented method, except when one
focuses on short lists, which include sets that are relatively easy to detect. (Note that the overlap of the two methods which use the passenger
null looks like a star (*).)
Boca et al. Genome Biology 2010, 11:R112
/>Page 6 of 10
tumor studies including as few as 21 patients, there is
significant power to detect relatively subtle signals as
long as the analysis is carried out at the level of gene
sets. This c onclusion still applies to gene sets of rela-
tively large size. The availability of complete exo mic
data from larger numbers of patients will make this
approach even more valuable and accurate.
While we focused on mutation analysis, extensions of
our methodology to consideration of other types of
alterations measured on a genome-wide scale are
possible. For example, it is straightforward to simply
replace ‘mutation’ with ‘any alteration’ and proceed with
the ana lysis approach pro posed here. However, some of
the null distributions required for statistical analysis
would be more complex to generate with other types of
alterations, such as copy number alterations (see Meth-
ods for a more detailed discussion). An important find-
ing of our study was that the different patient-oriented
methods we used generally yielded similar results, both
for the controlled simulations and for the data in [4].
0.0 0.2 0.4 0.6 0.8 1.0
0.0 0.2 0.4 0.6 0.8 1.0
Permutation null
q−value
True fraction of false discoveries
0.0 0.2 0.4 0.6 0.8 1.0
0.0 0.2 0.4 0.6 0.8 1.0
Passenger null
q
−value
True fraction of false discoveries
Patient−oriented methods
Permutation null without heterogeneity
Permutation null with heterogeneity
Passenger null without heterogeneity
Passenger null with heterogeneity
Gene−oriented method
Figure 4 Calibration analysis. Plot of the average true fraction of false discoveries versus the average q-value over 100 simulation runs. The
identity line indicates the ideal scenario of a perfect FDR-control rate; being above the identity line indicates anti-conservative behavior, and
being below the identity line indicates conservative behavior. Simulations use the permutation null (top panel) or the passenger null (bottom
panel). The gene-oriented method shows very anti-conservative behavior while the patient-oriented methods are generally calibrated or
conservative.
Boca et al. Genome Biology 2010, 11:R112
/>Page 7 of 10
However, we recommend that the main method we con-
sidered(calledthe‘permutation null method without
heterogeneity’) is optimal, as it requires the least amount
of data; in particular, it does not make use of gene cov-
erages or of passenger rates. This is particularly impor-
tant because passen ger rates are extremely difficult to
deter mine and may well vary fr om tumor type to tumor
type and from patient to patient with the same tumor
type. Compared to other gene set analysis techniques,
we believe that the patient-oriented approaches are
more transparent, more interpretable, and ultimately,
ask questions of greater scientific interest.
Materials and methods
Gene set analysis
Our patient-oriented approach relies on starting with a
statistic for each gene in each patient, which is either
one or zero, depending on whether or not the gene is
altered in the patient. (A poss ible extension may involve
a gene-lev el statistic which represents a p robability, and
is thus between zero and one.) For each patient, we
combine the statistics corresponding to all the genes in
a specific gene set to get a binary gene set statistic,
which is one if the gene set is altered in the patient and
zero if it is no t. We then obtain a statistic for each ge ne
set by taking a weighted sum of the patient-base d gene
set statistics. We consider two possible types of weights,
depending on whether or not the decision is made to
incorporate tumor heterogeneity. In the case which does
not account for h eterogeneity, the gene set statistic is
simply the number of patients in which the gene set is
altered. We also consider two possible null hypotheses:
either the events are permuted randomly within eac h
patient, or they come f rom a ‘ passenger mutation r ate’
that is computed for each patient individually. Thus, we
consider four different patient-oriented methods: per-
mutation null without heterogeneity, permut ation null
with heterogeneity, passenger null without heterogene-
ity, and passenger null with heterogeneity. We are able
to derive novel and explicit mathematical expressions
for the P-values associated with the gene set test we
propose. Formal definitions and proofs are given in the
Additional file 1.
In gene expression applications, [18] and [15] advo-
cated phenotype permutations as opposed to gene per-
mutations, but a large part of their argument was based
on the fact that microarra y gene expression data is cor-
related. As we make use of mutation data, we do not
expect this to be as important a consideration. We also
note that we hav e only matched tumor-normal samples,
so we cannot permute on the phenotypes.
For comparison, we use a gene-oriented method
implemented in the limma package [19] and previously
used in [3] (accessed through an interface developed for
[20]). This implementation of the method first ranks
genes according to a likelihood ratio test (LRT) using
the null hypothesis that the genes are mutated according
to the passenger rates, as detailed in [21] and [2]. For
each gene set, the ranking of the genes within it is com-
pared to the ranking of the genes outside it using the
Wilcoxon test.
This method is similar to the GSEA metho d of [22],
though it is much faster. It is possible to use other
gene-specific scores in the Wilcoxon test besides the
LRT score, such as the CaMP score, developed in [1].
There are also other statistical tests which can be
applied to obtain a P-value for the gene sets. For exam-
ple, a t-test m ay be used to compare the scores of the
genes within a gene set to those of the genes outside it.
We tried each of these variations on the glioblastoma
dataset described in the next section, and the CAT plots
comparing the patient-oriented to the gene-oriented
methods were similar. Another approach could be to set
a threshold, either on the number of mutations in a
gene, or on another gene-specific score, then to create a
contingency table for each gene set, comparing the
number genes within and outside the set with the
threshold. A test like the chi-squared test or Fisher’ s
exact test could then be employed. This approach is
often used in gene set analysis for expression data [15].
However, given that less than 5% of the genes are
mutated in our dataset, any threshold would invariably
result in over 95% of the gene-specific scores being
below it, thus invalidating this approach.
In both our simulated and real data analysis we compute
P-values for each approach considered. Starting from these
P-values, we use the Benjamini-Hochberg approach for
obtaining q-values [23] for FDR control. We note that this
is not the ideal scenario for the application of this
approach, since the null hypotheses are correlated and the
test statistics for the different gene sets are discrete and
not identically distributed. However, it is likely that these
factors lead to q-values that are conservative.
Experimental data
We consider the somatic nonsynonymous point muta-
tions from the glioblastoma dataset in [4] which were
present in the Discovery Screen. In this screen, tumor
samples from 22 patients were initially analyzed, one of
them being excluded from subsequent analysis due to
treatment with temozolomide, which led to a very differ-
ent m utation profile from the other tumors. Thus, only
21 samples were considered for further analysis in [4],
as well as in the present study, with sequence and muta-
tion data from 20,661 genes, from the CCDS, RefSeq,
and Ensembl databases. We do not consider the copy-
number alterations or the expression profiles, detected
via microarrays, respectively serial analysis of gene
Boca et al. Genome Biology 2010, 11:R112
/>Page 8 of 10
expression (SAGE) on these samples in [4]. We note
that the candidate cancer genes (CAN-genes) given in
[4] were established using additional data from the
examination of 21 of the genes mutated in the Discovery
Screen in 83 additional glioblastoma tumors, compris ing
the Prevalence Screen; this data was also not considered
in the current study. In the dataset considered in the
current study, a total of 748 mutational events were pre-
sent in 685 genes in 21 tumor samples. The gene with
the most events was TP53, with 12 mutations in ten
samples. The total number of events per tumor varied
between 12 and 63 (median is 35), indicating some
degree of heterogeneity between patients.
We use functional gene groups and pathways con-
tained within the well-annotated MetaCore database
[16], which includes metabolic pathways and signaling
pathways, as well as other cellular functions and
processes.
Controlled simulations
We considered two kinds of data-generating mechan-
isms for the null distributions in our simulations: One
where the data on genes present in the ‘null’ gene sets
were obtained by a permutation, and one where they
were generated according to prespecified mutation rates
representing likely scenarios for passenger mutations. In
the case of the permutation null, we started with the
events in [4], excluded those fro m the known ‘moun-
tains’ (TP53, PTEN, RB1, EGFR), and permuted the
remaining mutations among genes, while choosing the
context of mutations by using weights cor responding to
the expected number of mutations given by the passe n-
ger rate.
After the null dataset was obtained by one of these
twomethods,wespikedin12genesets,ofsizes25,
100, and 250 genes, with probabilities of being altered in
a given patient of 0.25, 0.50, 0.75 and 0.90. We artifi-
cially created these gene sets using hypothetical genes.
To generate realistic genes we sampled nucleotide com-
positions and sequencing coverage from the real genes
in [4]. For each of the spiked-in sets and each sample,
we generated a number from the Uniform (0,1) distribu-
tion to decide whether or not the gene set was altered
in the respective sample (depending on whether the ran-
dom number was larger or smaller than the probability
of being altered). In both simulation scenarios, the
mutated genes and their contexts were chosen so that
on average, the proportions of mutations of different
types are the same as they are among passengers.
Additional material
Additional file 1: Notations, derivations, and theorems used for the
patient-oriented methods.
Additional file 2: Cumulative distribution functions (cdf) of P-values
for the patient-oriented method with the permutation null without
heterogeneity, for 10,000 null samples, using the number of events
in the 21 glioblastoma samples from [4].
Additional file 3: Comparison of the main patient-oriented methods
(passenger null without heterogeneity) to the gene-oriented
method on the dataset in [4].
Additional file 4: Analyses on three more datasets.
Abbreviations
CaMP score: cancer mutation prevalence score; CAN-gene: candidate cancer
gene; CAT plot: ‘correspondence at the top’ plot; FDR: false discovery rate;
GBM: glioblastoma multiforme; LRT: likelihood ratio test.
Acknowledgements
This work was supported by the Virginia and D.K. Ludwig Fund for Cancer
Research, NIH grants CA43460, CA62924, CA121113, T32GM074906, and
T32MH019901, NSF grant DMS 1041698, and the Johns Hopkins Sommer
Scholar Program. The authors also acknowledge code generously provided
by M.A. Newton.
Author details
1
Department of Biostatistics, Johns Hopkins Bloomberg School of Public
Health, 615 N. Wolfe Street, Baltimore, MD 21205, USA.
2
Ludwig Center for
Cancer Genetics and Therapeutics and Howard Hughes Medical Institute,
Johns Hopkins Kimmel Cancer Center, 1650 Orleans Street, Baltimore, MD
21231, USA.
3
Department of Biostatistics, Harvard School of Public Health
and Department of Biostatistics and Computational Biology, Dana-Farber
Cancer Institute, 44 Binney Street, Boston, MA 02115, USA.
Authors’ contributions
SMB and GP designed the research; BV conceived of the idea; SMB
performed the analysis and drafted the manuscript, with input from GP; SMB
derived the theorems; SMB, KWK, VEV, BV, and GP interpreted the results and
edited the manuscript. All authors read and approved the final manuscript.
Received: 9 May 2010 Revised: 26 August 2010
Accepted: 23 November 2010 Published: 23 November 2010
References
1. Sjoblom T, Jones S, Wood LD, Parsons DW, Lin J, Barber TD, Mandelker D,
Leary RJ, Ptak J, Silliman N, Szabo S, Buckhaults P, Farrell C, Meeh P,
Markowitz SD, Willis J, Dawson D, Willson JK, Gazdar AF, Hartigan J, Wu L,
Liu C, Parmigiani G, Park BH, Bachman KE, Papadopoulos N, Vogelstein B,
Kinzler KW, Velculescu VE: The consensus coding sequences of human
breast and colorectal cancers. Science 2006, 314:268-274.
2. Wood LD, Parsons DW, Jones S, Lin J, Sjoblom T, Leary RJ, Shen D,
Boca SM, Barber T, Ptak J, Silliman N, Szabo S, Dezso Z, Ustyanksky V,
Nikolskaya T, Nikolsky Y, Karchin R, Wilson PA, Kaminker JS, Zhang Z,
Croshaw R, Willis J, Dawson D, Shipitsin M, Willson JK, Sukumar S, Polyak K,
Park BH, Pethiyagoda CL, Pant PV, et al: The genomic landscapes of
human breast and colorectal cancers. Science 2007, 318:1108-1113.
3. Jones S, Zhang X, Parsons DW, Lin JC, Leary RJ, Angenendt P, Mankoo P,
Carter H, Kamiyama H, Jimeno A, Hong SM, Fu B, Lin MT, Calhoun ES,
Kamiyama M, Walter K, Nikolskaya T, Nikolsky Y, Hartigan J, Smith DR,
Hidalgo M, Leach SD, Klein AP, Jaffee EM, Goggins M, Maitra A, Iacobuzio-
Donahue C, Eshleman JR, Kern SE, Hruban RH, et al: Core signaling
pathways in human pancreatic cancers revealed by global genomic
analyses. Science 2008, 321:1801-1806.
4. Parsons DW, Jones S, Zhang X, Lin JC, Leary RJ, Angenendt P, Mankoo P,
Carter H, Siu IM, Gallia GL, Olivi A, McLendon R, Rasheed BA, Keir S,
Nikolskaya T, Nikolsky Y, Busam DA, Tekleab H, Diaz LA Jr, Hartigan J,
Smith DR, Strausberg RL, Marie SK, Shinjo SM, Yan H, Riggins GJ, Bigner DD,
Karchin R, Papadopoulos N, Parmigiani G, et al: An integrated genomic
analysis of human glioblastoma multiforme. Science 2008, 321:1807-1812.
5. Ley TJ, Mardis ER, Ding L, Fulton B, McLellan MD, Chen K, Dooling D, Dunford-
Shore BH, McGrath S, Hickenbotham M, Cook L, Abbott R, Larson DE,
Boca et al. Genome Biology 2010, 11:R112
/>Page 9 of 10
Koboldt DC, Pohl C, Smith S, Hawkins A, Abbott S, Locke D, Hillier LW, Miner T,
Fulton L, Magrini V, Wylie T, Glasscock J, Conyers J, Sander N, Shi X,
Osborne JR, Minx P, et al: DNA sequencing of a cytogenetically normal
acute myeloid leukaemia genome. Nature 2008, 456:66-72.
6. Mardis ER, Ding L, Dooling DJ, Larson DE, McLellan MD, Chen K,
Koboldt DC, Fulton RS, Delehaunty KD, McGrath SD, Fulton LA, Locke DP,
Magrini VJ, Abbott RM, Vickery TL, Reed JS, Robinson JS, Wylie T, Smith SM,
Carmichael L, Eldred JM, Harris CC, Walker J, Peck JB, Du F, Dukes AF,
Sanderson GE, Brummett AM, Clark E, McMichael JF, et al: Recurring
mutations found by sequencing an acute myeloid leukemia genome.
New England Journal of Medicine 2009, 361:1058-1066.
7. Pleasance ED, Stephens PJ, O’Meara S, McBride DJ, Meynert A, Jones D, Lin ML,
Beare D, Lau KW, Greenman C, Varela I, Nik-Zainal S, Davies HR, Ordonez GR,
Mudie LJ, Latimer C, Edkins S, Stebbings L, Chen L, Jia M, Leroy C, Marshall J,
Menzies A, Butler A, Teague JW, Mangion J, Sun YA, McLaughlin SF,
Peckham HE, Tsung EF, et al: A small-cell lung cancer genome with complex
signatures of tobacco exposure. Nature 2010, 463:184-190.
8. Pleasance ED, Cheetham RK, Stephens PJ, McBride DJ, Humphray SJ,
Greenman CD, Varela I, Lin ML, Ordonez GR, Bignell GR, Ye K, Alipaz J,
Bauer MJ, Beare D, Butler A, Carter RJ, Chen L, Cox AJ, Edkins S, Kokko-
Gonzales PI, Gormley NA, Grocock RJ, Haudenschild CD, Hims MM, James T,
Jia M, Kingsbury Z, Leroy C, Marshall J, Menzies A, et al: A comprehensive
catalogue of somatic mutations from a human cancer genome. Nature
2009, 463:191-196.
9. Rajagopalan H, Bardelli A, Lengauer C, Kinzler K, Vogelstein B, Velculescu V:
Tumorigenesis: RAF/RAS oncogenes and mismatch-repair status. Nature
2002, 418:934.
10. Parsons DW, Wang TL, Samuels Y, Bardelli A, Cummins JM, DeLong L,
Silliman N, Ptak J, Szabo S, Willson JK, Markowitz S, Kinzler KW, Vogelstein B,
Lengauer C, Velculescu VE: Colorectal cancer: mutations in a signalling
pathway. Nature 2005, 436:792.
11. Lin J, Gan C, Zhang X, Jones S, Sjoblom T, Wood L, Parsons W,
Papadopoulos N, Kinzler K, Vogelstein B, Parmigiani G, Velculescu V: A
multidimensional analysis of genes mutated in breast and colorectal
and colorectal cancers. Genome Research 2007, 17:1304-1318.
12. The Cancer Genome Atlas Research Network: Comprehensive genomic
characterization defines human glioblastoma genes and core pathways.
Nature 2008, 455:1061-1068.
13. Tavazoie S, Hughes JD, Campbell MJ, Cho RJ, Church GM: Systematic
determination of genetic network architecture. Nature Genetics 1999,
22:281-285.
14. Mirnics K, Middleton F, Marquez A, Lewis D, Levitt P: Molecular
characterization of schizophrenia viewed by microarray analysis of gene
expression in prefrontal cortex. Neuron 2000, 28:53-67.
15. Goeman J, Buhlmann P: Analyzing gene expression data in terms of gene
sets: methodological issues. Bioinformatics 2007, 23:980-987.
16. Ekins S, Nikolsky Y, Bugrim A, Kirillov E, Nikolskaya T: Pathway mapping
tools for analysis of high content data. Methods Mol Biol 2007,
356:319-350.
17. Irizarry R, Warren D, Spencer F, Kim I, Biswal S, Frank B, Gabrielson E,
Garcia J, Geoghegan J, Germino G: Multiple-laboratory comparison of
microarray platforms. Nature Methods 2005, 2:345-350.
18. Allison D, Cui X, Page G, Sabripour M: Microarray data analysis: from
disarray to consolidation and consensus. Nature Reviews Genetics 2006,
7:55-65.
19. Michaud J, Simpson KM, Escher R, Buchet-Poyau K, Beissbarth T,
Carmichael C, Ritchie ME, Schutz F, Cannon P, Liu M, Shen X, Ito Y,
Raskind WH, Horwitz MS, Osato M, Turner DR, Speed TP, Kavallaris M,
Smyth GK, Scott HS: Integrative analysis of RUNX1 downstream pathways
and target genes. BMC Genomics 2008, 9:363.
20. Schaeffer E, Marchionni L, Huang Z, Simons B, Blackman A, Yu W,
Parmigiani G, Berman D: Androgen-induced programs for prostate
epithelial growth and invasion arise in embryogenesis and are
reactivated in cancer. Oncogene 2008, 27:7180-7191.
21. Parmigiani G, Lin J, Boca S, Sjoblom T, Kinzler K, Velculescu V, Vogelstein B:
Statistical methods for the analysis of cancer genome sequencing data.
Johns Hopkins University, Department of Biostatistics Working Papers 2007,
Paper 126 [ />22. Subramanian A, Tamayo P, Mootha VK, Mukherjee S, Ebert BL, Gillette MA,
Paulovich A, Pomeroy SL, Golub TR, Lander ES, Mesirov JP: Gene set
enrichment analysis: a knowledge-based approach for interpreting
genome-wide expression profiles. Proc Natl Acad Sci U S A 2005,
102:15545-15550.
23. Benjamini Y, Hochberg Y: Controlling the false discovery rate: a practical
and powerful approach to multiple testing. Journal of the Royal Statistical
Society B 1995, 57:289-300 [ />24. Thomas M, Taub A: Calculating binomial probabilities when the trial
probabilities are unequal. Journal of Statistical Computation and Simulation
1982, 14:125-131.
25. Lange K: Numerical Analysis for Statisticians. New York: Springer Verlag; 1999.
doi:10.1186/gb-2010-11-11-r112
Cite this article as: Boca et al.: Patient-oriented gene set analysis for
cancer mutation data. Genome Biology 2010 11:R112.
Submit your next manuscript to BioMed Central
and take full advantage of:
• Convenient online submission
• Thorough peer review
• No space constraints or color figure charges
• Immediate publication on acceptance
• Inclusion in PubMed, CAS, Scopus and Google Scholar
• Research which is freely available for redistribution
Submit your manuscript at
www.biomedcentral.com/submit
Boca et al. Genome Biology 2010, 11:R112
/>Page 10 of 10