Bio-MEMS Technologies and Applications - Wang and Soper (Eds) Part 14 docx
Bạn đang xem bản rút gọn của tài liệu. Xem và tải ngay bản đầy đủ của tài liệu tại đây (515.74 KB, 21 trang )
392 Bio-MEMS: Technologies and Applications
cells such as humans, which possess nearly 10
14
cells. Cells typically function
as independently operating machines providing a large heterogeneity in cell
characteristics, even for a group of cells that are localized to a specific organ
or tissue within a multicellular organism. However, cells do share several
common capabilities such as:
• Reproduction by cell division.
• Metabolism, including taking in raw materials, building cell compo-
nents, converting energy and molecules, and releasing by-products.
The functioning of a cell depends upon its ability to extract and use
chemical energy stored in organic molecules. This energy is derived
from metabolic pathways.
• Synthesis of proteins, the functional workhorses of cells, such as
enzymes. A typical mammalian cell contains up to 10,000 different
proteins.
• Response to external and internal stimuli, such as changes in tem-
perature, pH, or nutrient levels.
One way to classify cells is whether they live alone or in groups. Organisms
vary from single cells (called single-celled or unicellular organisms), which
function and survive more or less independently, through colonial forms with
cells living together, to multicellular forms in which cells are specialized. There
are 220 types of cells and tissues that make up the multicellular human body.
Cells can also be classified into two categories based on their internal structure.
• Prokaryotic cells are structurally simple. They are found only in sin-
gle-celled and colonial organisms. In the three-domain system of
scientific classification, prokaryotic cells are placed in the domains
Archaea and Eubacteria.
• Eukaryotic cells have organelles with their own membranes. Single-
celled eukaryotic organisms such as amoebae and some fungi are
very diverse, but many colonial and multicellular forms such as
plants, animals, and brown algae also exist.
Cells are comprised of components called organelles, which perform cer-
tain functions in this operating machine. The organizational structure and
the important organelles comprising a typical eukaryotic animal cell are
which serves to separate and protect the cell from its surrounding environ-
ment and is composed primarily of a double layer of lipids and proteins.
Embedded within this membrane are a variety of other molecules that act
as channels and pumps, moving different molecules into and out of the cell.
There is an additional membrane contained within most cells called the
nuclear membrane, which forms the cell nucleus and contains the genetic mate-
rial of the cell. Two different kinds of genetic material exist: deoxyribonucleic
DK532X_book.fm Page 392 Tuesday, November 14, 2006 10:41 AM
shown in Figure 15.1. A eukaryotic cell is surrounded by a plasma membrane,
© 2007 by Taylor & Francis Group, LLC
394 Bio-MEMS: Technologies and Applications
rough ER, which has ribosomes on its surface, and the smooth ER, which
lacks them. Translation of the mRNA for those proteins that will either stay
in the ER or be exported from the cell occurs at the ribosomes attached to the
rough ER. The smooth ER is important in lipid synthesis, detoxification, and
as a calcium reservoir. The Golgi apparatus, sometimes called a Golgi body
or Golgi complex, is the central delivery system for the cell and is a site for
protein processing, packaging, and transport. Both organelles consist largely
of heavily folded membranes.
Lysosomes and peroxisomes are often referred to as the garbage disposal
system of a cell. Both organelles are somewhat spherical, bound by a single
membrane, and rich in digestive enzymes—naturally occurring proteins that
speed up biochemical processes. For example, lysosomes can contain more
than three dozen enzymes for degrading proteins, nucleic acids, and certain
sugars called polysaccharides.
15.1.2 The Molecular Makeup of Cells
Cells are comprised of a variety of different types of molecules, such as
proteins, peptides, amino acids, DNAs, RNAs, lipids, carbohydrates, and so
on. These molecules perform diverse functions within the cell machinery
and the presence, absence, structural modification, amount, or location of
certain molecules within the cell provides the unique signature or identity
of that cell. An example of how a unique cell signature can have significant
consequences on the functional state of an organism is evident in cancer.
Cancer develops due to a variety of different mutagenic changes that occur
in a cell’s genome, providing unregulated cell growth in many cases (neo-
plasm). However, a solid tumor contains a highly heterogeneous collection
of neoplastic cells that can originate from a single cancer cell. The heteroge-
neity within the tumor results from the stochastic cascading mutational
events that occur within each cell of the solid mass during tumorigenesis.
The amount (i.e., copy number) of cellular molecules varies considerably
and depends on the type of molecule and the size of the cell. For example,
most eukaryotic cells contain only two copies of genomic DNA within their
nucleus, while the copy number of mRNAs can vary from several to tens of
thousands with the exact number dependent on the activity of the gene for
which it codes. In addition, there is usually one unique mRNA molecule for
each gene that is transcribed, and thus a single cell may contain more than
5000 different mRNA molecules. The number of different proteins found
within a single cell varies considerably as well, with a common estimate
being somewhere in the neighborhood of 10,000. In addition, the copy num-
ber of each protein found within the cell can vary tremendously.
There are a variety of different types of cells, all containing unique struc-
tural and morphological features. Several different types of cells and their
DK532X_book.fm Page 394 Tuesday, November 14, 2006 10:41 AM
sizes are listed in Table 15.1.
© 2007 by Taylor & Francis Group, LLC
396 Bio-MEMS: Technologies and Applications
parts of the genome that are difficult to amplify, such as highly repetitive
regions or regions rich in guanines and cytosine residues. The amplification
step would require an additional functional component to be integrated into
the system, complicating packaging and assembly of the system. And finally,
some molecules that are to be analyzed from a single cell do not lend them-
selves to amplification, such as proteins, peptides, or amino acids.
Therefore, it is necessary to consider the possibility of reading out the
results of a single-cell assay using single-molecule detection. Single-molecule
detection is affected by interrogating the signature of a single molecule when
it is resident within the sampling volume. To delineate some of the under-
lying principles associated with single-molecule detection, we will use laser-
induced fluorescence readout as an example. During the single molecule’s
residence within the sampling volume, which in this case is defined by the
confocal volume produced by a focused Gaussian laser beam, the molecule
is continuously cycled between the ground electronic state and an upper
electronic state with relaxation producing a fluorescent photon. This cycling
process generates a burst of photons (Mathies et al. 1990), with the number
of photons per molecule (n
f
) approximately equal to;
(15.1)
where Q
f
is the fluorescence quantum yield, Q
d
is the photodestruction quan-
tum yield, τ and k are dimensionless parameters equal to τ
t
/τ
d
(τ
t
= molecular
residence time in excitation volume; τ
d
= photobleaching lifetime of the
molecule), and k
a
/k
f
(k
a
= absorption rate of the single molecule; k
f
= fluores-
cence emission rate of molecule), respectively. As can be seen from Equation
15.1, molecules with high fluorescence quantum yields that are photochem-
ically stable produce large numbers of fluorescent photons. In addition, n
f
can be increased by increasing the residence time of the molecule within the
sampling volume to a point in time where photobleaching occurs, at which
time photon emission ceases.
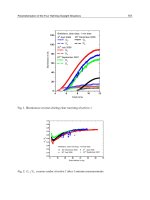
In any analytical measurement, one is interested in the signal-to-noise ratio
(SNR), which provides a criterion by which the analytical signal of interest
is statistically greater than the noise in the measurement. For single-molecule
detection, the noise is typically comprised of scattering (Raman, Rayleigh,
specular), autofluorescence from the sample matrix and shot noise from the
detection and processing electronics. In most cases, single-molecule measure-
ments are performed with threshold levels used to provide an acceptable
level of confidence that the event scored arises from a single molecule and
not from the background (false positive). However, lowering the level of
false positives typically provides higher levels of false negatives. To assess
the validity of the data and to assure that the scored events are those arising
from single molecules and not multiple molecules resident within the sam-
pling volume, one can use the following equations (Soper et al. 1993):
n
Q
Q
e
f
f
kk
f
=
−
− +
1
1τ()
DK532X_book.fm Page 396 Tuesday, November 14, 2006 10:41 AM
© 2007 by Taylor & Francis Group, LLC
Single-Cell and Single-Molecule Analyses Using Microfluidic Devices 397
(15.2)
(15.3)
Equation 15.2 represents the probability (P
o
) of a single molecule occupying
the probe volume, and is typically adjusted to less than 0.1 to minimize the
probability of double occupancy (C = molecular concentration, molar; D
v
is
the size of the probe volume in liters; N
A
is Avogadro’s number). N
ev
is the
number of events expected during a typical experimental run and can be
used as a diagnostic to assess the degree of false negatives incurred in an
experimental run (v is the linear sample velocity, cm/s; T is the duration of
the experiment, s; and ω
o
is the laser beam waist, cm).
15.1.4 Why Analyze Single Cells or Single Molecules?
Most biological samples represent a high degree of heterogeneity and as
such, making a bulk measurement over many targets, whether they are cells
or molecules, will yield an ensemble average of the entire sampling domain.
Therefore, fine structure in the heterogeneous sample is lost due to this
ensemble averaging phenomenon. Single-cell or single-molecule measure-
ments eliminate such artifacts, and thus can provide fine detail from mixed
population samples. Additionally, single-entity measurements produce the
ability to study rare events. For example, micrometastasis is typically asso-
ciated with breast cancer, in which tumor cells are released into circulating
blood prior to full-stage metastasis. It is not uncommon to find 1 to 10 cells
per milliliter of whole blood with the red blood cell count exceeding 10
7
. The
detection of these rare cells can be used as an effective early diagnostic for
breast cancer (Baker Megan et al. 2003; Husebekk et al. 1988; Kahn Harriette
et al. 2004). Another diagnostic example is detecting genetic disorders in
embryos at the 6- to 10-cell embryonic developmental stage, in which only
1 to 2 cells can be biopsied for DNA analysis without permanently damaging
the embryo.
In the case of single-molecule detection, practical examples of where this
can be of importance is in developing biological assays that seek to minimize
the number of processing steps required to elicit a response, which can
provide near real-time readout and simplify assay processing. DNA frag-
ment sizing following restriction enzyme digestion can be used to score
potential mutation sites at specific locations (restriction fragment length
polymorphism [RFLP]). This assay typically requires a gel electrophoresis
step to sort (by size) the restriction fragments that are generated. Using
single-molecule detection, the electrophoresis step can be completely elim-
inated (Ambrose et al. 1993; Foquet et al. 2002; Habbersett et al. 2004).
Another example is the detection of mutations in certain gene fragments
PCDN
ovA
=
N
PvT
ev
o
o
=
2
πω
DK532X_book.fm Page 397 Tuesday, November 14, 2006 10:41 AM
© 2007 by Taylor & Francis Group, LLC
398 Bio-MEMS: Technologies and Applications
following PCR amplification of the prerequisite gene fragments. The use of
single-molecule detection can completely eliminate the need for PCR, reduc-
ing assay cost and development time (Wabuyele et al. 2003). From a micro-
systems point of view, single-molecule detection capabilities eliminate the
need for fabricating devices that carry out these amplification processes,
simplifying the operation of the system and improving manufacturing suc-
cess rates.
In this chapter, we will provide some practical examples of using micro-
systems for analyzing both single cells and single molecules. Special empha-
sis will be placed on the fabrication of devices and systems capable of
detecting single molecules and analyzing single cells as well as substrate
material considerations of the microsystem and its effects on single-molecule
and single-cell analyses.
15.2 Single-Cell Analysis Using Microfluidic Devices
Each biological cell is self-contained and self-maintaining: it takes in nutri-
ents, converts them into energy, carries out specialized functions, reproduces,
and dies. Each cell stores its own set of information for performing each of
these activities. The study of cells, what is in them, on them, around them,
how they eat, sleep, grow, die, complete tasks, and work by stimulating,
influencing, inhibiting and destroying each other is called cellomics. Under-
standing the molecular biology of cells is an active area of research that is
fundamental to all of the basic sciences, agriculture, biotechnology, and
medicine. Detailed knowledge of the cell biology, cell metabolic processes
and pathways, and genetic and proteomic makeup can contribute to the
development of new methodologies and drug therapies for prevention or
treatment of many disorders and diseases. The stakes involved in single-cell
analysis are of great significance, and not surprisingly, the development of
single-cell analysis tools has become the focus of significant efforts in the
bio-MEMS arena. Well-founded techniques, such as capillary electrophoresis
and flow cytometry, have both demonstrated valuable and effective abilities
to manipulate large numbers of cells (with few exceptions where single-cell
handling was demonstrated) and have rather limited capability to manipu-
late and analyze single biological cells. A disadvantage of currently available
cell screening techniques is their low throughput capabilities, making it
difficult to obtain data for large cell populations.
New methodologies and rapid developments in micro- and nanofabrica-
tion technologies are creating new opportunities for single-cell analysis.
There are a number of reasons microfluidic devices and systems are partic-
ularly attractive for performing cellomics (Andersson et al. 2003, 2004): (1)
micromechanical devices are capable of manipulating single objects with
cellular dimensions, (2) the size of cells fits very well with that of commonly
DK532X_book.fm Page 398 Tuesday, November 14, 2006 10:41 AM
© 2007 by Taylor & Francis Group, LLC
Single-Cell and Single-Molecule Analyses Using Microfluidic Devices 399
used fluidic devices (10 to 100 µm), (3) the ability to integrate standard
operations into the microfluidic system, (4) heat and mass transfer charac-
teristics that are very fast in microfluidic systems. The unique ability of
microfluidic devices to integrate sample manipulation and processing oper-
ations with separations and analyte detection allows for the efficient auto-
mation and high-throughput capabilities of chemical analyses. Microdevices
possess several advantages over conventional chemical and biochemical
analysis instrumentation, including (1) the ability to perform fast separations
with no losses in separation efficiency, (2) lower reagent and sample con-
sumption, and (3) the ability to fabricate many parallel systems on the same
device making it a convenient platform for single-cell assays with high-
throughput capabilities.
Cell studies utilizing microfluidic systems have focused thus far on cytom-
etry (Andersson et al. 2003; Andersson et al. 2004; Beebe 2000; Chan et al.
2003; Chin Vicki et al. 2004; Erickson and Li 2004; Eyal and Quake 2002;
Palkova et al. 2004; Sohn et al. 2000; Wu et al. 2004), sorting (Andersson et
al. 2003; Emmelkamp et al. 2004; Fu et al. 2002; Fu et al. 1999; Kruger et al.
2002; Lu et al. 2004a; Rao et al. 2004; Sia et al. 2003), cell lysis (Chaiyasut et
al. 2002; Dhawan et al. 2002; Gao et al. 2004; Hellmich et al. 2005; Heo et al.
2003; Huang et al. 2003; Lee and Tai 1999; McClain et al. 2003; Waters et al.
1998; Wheeler et al. 2003), followed by extraction (Hong et al. 2004), and
separation and analysis of intracellular components (Ocvirk et al. 2004).
Microfabrication technology has also enabled the engineering of cell culture
environments. Recent microfluidic work has demonstrated successful cultur-
ing of biological cells on chips (Balagadde et al. 2005; Chung et al. 2005; Futai
et al. 2006; Gu et al. 2004; Hung et al. 2004; Rhee et al. 2005; Shackman et al.
2005; Tourovskaia et al. 2005). These studies addressed certain aspects of cell
culture control, including nutrient mass transport and modulation of culture
conditions. The ultimate goal, however, is single-cell analyses that can be
helpful where culturing processes are difficult (i.e., unculturable microbes,
viruses), or when one deals with developing organisms or primary cells.
15.2.1 Cell Sorting and Capture
Cell separation and recognition techniques are fundamental in cell biology.
The ability to effectively isolate and recognize single cells from a heteroge-
neous population is a limiting factor in many sorting technologies. Sohn et
al. (2000) developed a capacitance cytometry technique that allows recogni-
tion of single cells based on their internal properties. This technique allows
probing the polarization response of different biological materials present in
a cell. DNA, for example, is a highly charged molecule and when placed in
an applied low-frequency AC electric field has a substantial polarization
response. Unlike a Coulter counter, which measures the displaced volume,
capacitance cytometry measures the response of the polarization of a cell as
it passes through an electric field. Sohn et al. observed a linear relationship
DK532X_book.fm Page 399 Tuesday, November 14, 2006 10:41 AM
© 2007 by Taylor & Francis Group, LLC
400 Bio-MEMS: Technologies and Applications
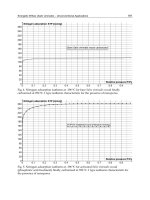
between the DNA content of eukaryotic cells and the change in capacitance
value that was evoked by the passage of individual cells across a 1 kHz 250
mV rms electric field (Figure 15.2c). The developed microfluidic cytometer
was used to quantify the DNA content of eukaryotic cells and to analyze the
cell-cycle kinetics of populations of cells. A comparison with standard flow
cytometry demonstrated high sensitivity of the method, which was achieved
by the use of shallow poly(dimethylsiloxane) (PDMS) channels (30 µm depth
and 30 µm width), grounding and shielding the device, and precisely con-
trolling the temperature. Gold electrodes were fabricated photolithographi-
cally onto the glass and were 50 µm wide. The interelectrode spacing was
30 µm and the noise magnitude observed was 0.1 to 2 fF. A schematic of the
device is presented in Figures 15.2a and b. In contrast to a standard laser
flow cytometer, this method required no special sample preparation, such
as cell staining.
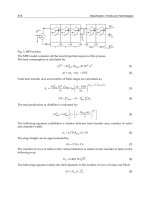
FIGURE 15.2
Schematic illustration of the integrated microfluidic device. (a) Top view shows the entire
device, including electrode configuration, inlet and outlet holes for fluid, and the PDMS
microfluidic channel. The electrodes are made of gold and are 50 µm wide. The distance, d,
separating the electrodes is 30 µm. The width of the PDMS microfluidic channel is also d, the
length, L, is 5 mm, and the height, h, is either 30 µm or 40 µm. (b) Side view along the vertical
axis of the device shows a detailed view of fluid delivery. Fluid delivery is accomplished with
a syringe pump at rates ranging from 1 to 300 µl/hr. (c) Change in capacitance C
T
vs. DNA
content of mouse SP2/0, yeast, avian, and mammalian red blood cells. As shown, there is a
linear relationship between C
T
and DNA content at 1 kHz frequency. ○–Data taken with a
device whose channel height was 30 µm; –data taken with a device whose channel height
was 40 µm. The 40 µm data were scaled by the ratio of the C
T
values obtained for mouse SP2/
0 cells measured with 30 µm– and 40 µm–high channel devices. All data were obtained at
T = 10°C and in PBS solution. (Reprinted with permission from Sohn, L.L., Saleh, O.A., Facer,
G.R., Beavis, A.J., Allan, R.S., and Notterman, D.A. (2000). Proceedings of the National Academy
of Sciences of the United States of America 97(20): 10687–10690. © 2000, The National Academy
of Science of the USA.)
L
d
PDMS
microfluidic
channel
Substrate
Inlet
Outlet
30
25
20
15
10
5
0
024
681012 14
∆C
T
(fF)
Mouse SP2/0 G2
Mouse SP2/0 G1
Rat-1 Fibroblast G2
Rat-1 Fibroblast G1
Human Leukocyte
Avian RBC
Ye as t G2
Ye ast G1
Mammalian RBC
DNA Content (pg)
h
Fluid in
Electrode
Fluid out
PDMS Channel
(a)
(b)
(c)
DK532X_book.fm Page 400 Tuesday, November 14, 2006 10:41 AM
© 2007 by Taylor & Francis Group, LLC
Single-Cell and Single-Molecule Analyses Using Microfluidic Devices 401
Microfluidic devices are being designed in ways that allow the investiga-
tion of single-cell phenomena rather than batch culture. Numerous methods
are being or have been already developed for the immobilization of partic-
ular types of cells in microfluidics (Braschler et al. 2005; Toriello et al. 2005).
Among the various immobilization or cell capture methods, several include:
(1) chemical surface modifications with microcontact printing, (2) laser trap-
ping, and (3) dielectrophoretic or electromagnetic trapping.
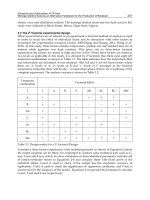
A PDMS and glass microchip that performed direct capture and chemical
activation of surface-modified single cells has been presented by Toriello et
al. (2005). The cell capture system was comprised of gold electrodes micro-
fabricated on a glass substrate (Figure 15.3a). The cell capturing mechanism
involved a labeling of the cell surface with thiol functional groups (using
RGD endogenous receptors) and the utilization of spontaneous adsorption
of thiol-containing species onto gold surfaces. The off-chip incubation in
RGD peptide resulted in approximately 5 × 10
6
thiol groups per cell. The
labeled cells were electrophoretically transported to electrodes and captured
on gold surfaces. Once captured, the single cells were activated with an
agonist to a membrane-bound receptor, and the response was monitored
optically with a fluorescent probe. Multiple cell types were sequentially and
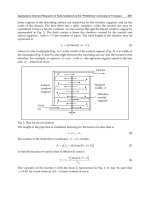
FIGURE 15.3
(a) Schematic of the glass-PDMS microdevice for single cell capture. A cell suspension enters
the 200 µm–wide PDMS channel through the 0.5 mm–diameter fluidic port. Cells flow over the
PDMA derivitized glass surface in the 32 µm–deep channel and are captured on the 16 µm
2
exposed gold pads centered on the 40 µm–wide gold electrodes. Cells are directed to the desired
electrode by applying a 50 V/cm electric field between the interdigitated electrodes (200 µm
spacing). Inset: electron micrograph of an electrode showing the three exposed gold pads on
the oxide-coated electrode. Bar, 30 µm. (b) Sequential directed capture of two populations of
Chinese hamster ovary (CHO) cells. The first population of thiolated K1 cells, labeled with
CellTracker Blue, is captured by applying a 50 V/cm potential to the even-numbered electrodes
for 10 min. (c) A second population of thiolated K1 cells, labeled with Cell Tracker Green, is
introduced into the channel through the opposite fluidic port and field-mediated binding occurs
selectively at the odd-numbered electrodes. Bar 40 µm. (Reprinted with permission from Tori-
ello, N.M., Douglas, E.S., and Mathies, R.A. (2005). Analytical Chemistry 77(21): 6935–6941.
© 2005, American Chemical Society.)
(a) (b) (c)
Fluidic port
Electrode
contact pad
Glass
SiO
2
Exposed gold
Initial captureAAfter E reversalB
1 + 1 −
2 − 2 +
3 + 3 −
4 − 4 +
−
DK532X_book.fm Page 401 Tuesday, November 14, 2006 10:41 AM
© 2007 by Taylor & Francis Group, LLC
402 Bio-MEMS: Technologies and Applications
selectively captured on neighboring electrodes by changing the field direc-
pad rows having a single cell captured) was optimized by variations in the
duration of the applied field, which was 63 ± 9% (n = 30) for 10 min and
was 90 ± 5% for a 60 min incubation. The use of cell surface thiolation
presents several advantages; (1) it relies on the robust and strong gold–thiol
bond; (2) it leaves the gold electrodes in their native state, which is useful
for sensor applications, and (3) the cell modification approach provides
superior adhesion with electrical measurement flexibility.
15.2.2 Cell Lysis
Typical laboratory protocols for cell lysis include the use of enzymes
(lysozyme), chemical agents such as detergents (Chaiyasut et al. 2002; Dorre
et al. 1997), mechanical forces such as sonication and bead milling (Belgrader
et al. 1999; Belgrader et al. 2000; Taylor et al. 2001), and thermal and laser
methods (Dhawan et al. 2002; He et al. 2001; Ivanov 1999; Sims et al. 1998).
Some of these methods have been successfully implemented into microflu-
idic formats. For example, an integrated monolithic microchip was fabricated
using electrokinetic fluid actuation and thermal cycling to accomplish lysis
of Escherichia coli and the subsequent amplification of the released DNA
(Waters et al. 1998).
In a similar electrokinetic device, the controlled manipulation of red blood
cells (RBCs) throughout a channel network and chemical lysis of the cells
was demonstrated (Dorre et al. 1997). A continuous flow device for rapid
RBC lysis and leukocytes isolation from whole blood was also developed by
Toner et al. (2005). RBCs lysis was performed on a PDMS chip using a NH
4
Cl-
based lysing buffer (Toner and Irimia 2005). The advantage of chemical lysis
on chip is reduced diffusion time, which allows for fairly short lysing times
of 30 s, as opposed to 10 to 20 min for benchtop formats.
The use of microfluidic glass chips for continuous single-cell lysis and
detection of β-Galactosidase (β-Gal) content was described by Ocvirk et al.
(2004). Cells were transported toward a Y-shaped mixing junction, at which
imately 100 and 40 mm/s were used under protein denaturing (35 mM
sodium dodecylsulfate [SDS]), and nondenaturing (0.1% Triton X-100) con-
ditions. Complete and reproducible lysis of individual cells on-chip occurred
within 30 s using Triton X-100 and 2 s when using SDS. Fluorescence peaks,
due to the enzymatic product of the reaction of β–Gal with fluorescein mono-
β-D-galactopyranoside (FMG), were detected downstream of the mixing.
Unincubated cells were mixed on-chip with both FDG and Triton X-100 with
each individual cell generating fluorescence downstream of the mixing point,
which was detected within 2 min of mixing. In contrast, viable cells incubated
with FDG required 1 h or more in order to generate significant signals.
DK532X_book.fm Page 402 Tuesday, November 14, 2006 10:41 AM
tion (Figures 15.3b and c). The capture efficiency (defined as the electrode
point lytic agents were introduced (Figure 15.4). Flow velocities of approx-
© 2007 by Taylor & Francis Group, LLC
404 Bio-MEMS: Technologies and Applications
Complete electrical lysis was demonstrated in less than 33 ms using an
AC electric field with a DC offset to lower the joule heating and provide
sufficient field strength for lysis. Fields of 0.45 kV/cm peak-to-peak square
waves (75 Hz) were used with a 0.68 kV/cm DC offset and a 50% duty cycle.
an individual Jurkat cell loaded with Calcein AM. In Figure 15.6a, the Jurkat
cell appeared close to one side of the main channel due to the flow from the
focusing and emulsification channel. In Figure 15.6b, the cell entered the
lysis intersection, encountered the electric field, and was lysed. The fluores-
cent dyes in the cytosol moved electrophoretically down the channel toward
the anode. Spatially separated bands from two dyes could be seen in the
third image (Figure 15.6c). Figure 15.6d shows the separation of Oregon
green and carboxyfluorescein compounds from eight interrogated cells.
These devices should make it feasible to analyze large cell populations.
Another example of a device for single-cell interrogation was introduced
by Khine et al. (2005). A PDMS device was designed first to selectively immo-
bilize, and second to locally electroporate cells. The cell suspension was
introduced into the device with a syringe and controlled manually to allow
cell trapping by applying negative pressure on the trapping channel. When
trapped, a cell was pulled laterally into a smaller channel, which acted as a
high-resistance component in the fluidic circuit. The localized electroporation
occurring across the membrane of the cell inside the channel, which is
inversely proportional to its surface area, hence the localized electroporation
FIGURE 15.5
(a) Image of microchip used for cell analysis experiments. (b) Schematic of the emulsification
and lysis intersections for the microchip design shown in (a). The solid arrows show the
direction of bulk fluid flow and the dashed arrow shows the electrophoretic migration direction
of the labeled components in the cell lysate. (Reprinted with permission from McClain, M.A.,
Culbertson, C.T., Jacobson, S.C., Allbritton, N.L., Sims, C.E., and Ramsey, J.M. (2003). Analytical
Chemistry 75(21): 5646–5655. © 2003, American Chemical Society.)
Emulsifier
Emulsification
/focusing
Waste
(syringe
pump)
Emulsification
intersection
Cells
µ
rp
130 µm
+
Buffer
Waste
Separation
channel
V
V
t
Lysis
intersection
Buffer
Cell
Separation
channel
−
(a) (b)
DK532X_book.fm Page 404 Tuesday, November 14, 2006 10:41 AM
Figure 15.6 shows a time series of CCD images demonstrating the lysis of
was achieved when cells were sequestered in the PDMS channels (Figures
15.7a and b). The electric field was focused with the greatest potential drop
© 2007 by Taylor & Francis Group, LLC
Single-Cell and Single-Molecule Analyses Using Microfluidic Devices 407
technique could be amenable to studies involving other tissues or cells that
release chemicals. The detection method (i.e., optical, electrochemical) could
be customized for the particular analyte of interest.
Another cellular metabolite, lactate, was assayed in a microfluidic format.
Lactate is the final product of glycolysis and is one of the most important
cellular metabolites. It is produced in small concentrations during aerobic
respiration and in larger concentrations during cell death. Measurements of
its concentration provide information on the complex timeline of metabolic
changes. Cai et al. (2002) presented ultra-low-volume, real-time measurements
of lactate from single heart cells utilizing amperometric detection. The rod-
shaped myocyte cell membrane integrity was compromised by permeabiliza-
tion with saponin, which caused immediate cell contracture (Figure 15.8).
Lactate was released from the cell immediately after the addition of saponin.
Dynamic electrochemical measurements of lactate during cell permeabilization
FIGURE 15.8
Healthy “dormant” rod-shaped myocyte being permeabilized with saponin. Upon addition of
the saponin (at 8 s to 80 g/mL), the myocyte shortened and rounded up. Images from 50 s
onward are shown (those from 0 to 50 s are identical). Observation of the cell within the chamber
showed that lactate was released immediately when saponin was added to the cell. (Reprinted
with permission from Shackman, J.G., Dahlgren, G.M., Peters, J.L., and Kennedy, R.T. (2005).
Lab on a Chip 5(1): 56–63. © 2005 The Royal Society of Chemistry.)
50 s
60 s
65 s
70 s
80 s
DK532X_book.fm Page 407 Tuesday, November 14, 2006 10:41 AM
© 2007 by Taylor & Francis Group, LLC
408 Bio-MEMS: Technologies and Applications
found that the lactate content after metabolic inhibition was three times that
in the healthy cell. The method provided a generic assay to make single-cell
sensing in picoliter volumes.
The detection of lactate was optimized using an enzyme-linked assay with
lactate oxidase involving amperometric detection of H
2
O
2
at +0.64 V versus
a Ag/AgCl reference electrode, according to Equations 15.4 and 15.5.
L-lactate + O
2
→ pyruvate + H
2
O
2
(15.4)
H
2
O
2
→ O
2
+ 2H
+
+ 2e
-
(15.5)
A two-electrode microamperometric system was developed based on a
platinized working microelectrode and an integrated Ag/AgCl electrode
serving as a counter and reference electrode. The platinized microelectrode
possessed a very large surface area, which increased the signal-to-back-
ground ratio and improved the detection limits. Also, this working electrode
is highly catalytic with a reduced overpotential for the oxidation of hydrogen
peroxide (H
2
O
2
). The entire device consisted of an electrochemical sensor
and a dispensation technology capable of delivering small volumes (6.5 pL),
and single cells into a microelectrochemical cell.
There is tremendous interest in understanding not only how cells react to
environmental stimuli, but also how they receive and process signals. Cel-
lular signal transduction has been found to be important in multiple phys-
iological functions, including their role in the immune system, neural activity,
and proper organ development. Molecular-level communication between
adjacent cells is essential for proper functioning of living tissue. It has been
noted for years that membrane contact with neighboring cells can cause
changes in morphology, gene expression, and growth. Impaired cell–cell
communication has been implicated in numerous diseases, and is correlated
with most forms of cancer (Lee et al. 2005). Lee et al. (2005) fabricated a
device to study cell–cell communication between neighboring cells. The
developed microfluidic device consisted of a module that selectively trapped
cell pairs followed by optical characterization. Microfluidic devices were
intended to trap individual cells within one cell diameter of an adjacent cell
by 20 µm on opposite sides of a microfluidic channel. The cell line used
averaged 12 µm in diameter, and hence the channel was wide enough to
allow cells to flow through unhindered and yet narrow enough to allow
membrane contact when the cell pairs were trapped across from each other.
The cell-trapping design consisted of two different heights of channels
molded in PDMS. The cell trapping array had four fluidic ports connected
to control valves. The west and east ports were used for the flow of cells into
the device and the north and south ports controlled the corresponding row
of cell-trapping sites. Independent control of the two trapping ports (north
and south) allowed trapping of one cell.
DK532X_book.fm Page 408 Tuesday, November 14, 2006 10:41 AM
(Figure 15.9). A single pair of trapping sites was designed to be separated
© 2007 by Taylor & Francis Group, LLC
410 Bio-MEMS: Technologies and Applications
the cell. The process of their activation is considered to be the key event of
apoptosis and is studied as a target for drug discovery. Suppression or
enhancement of apoptosis is known to cause or contribute to many diseases,
such as cancer, neurodegenerative diseases, and AIDS (Valero et al. 2005).
Valero et al. 2005 fabricated a microfluidic cell trap device for analysis of
apoptosis. The microfluidic silicon-glass chip enabled the immobilization of
cells and real-time monitoring of the apoptotic process. The device consisted
trapping microstructures were located in the vicinity of this crossway acting
as a filter; buffer flew through the trap while the cells were captured. The
cell-trapping structures varied in terms of shape, size, and the number of
trapping sites. Figures 15.11b and c show photographs of two different trap-
ping layouts. The layout shown in Figure 15.11b contains traps that differ in
size. The diameters of the capturing sites varied between 8 µm and 12 µm
and openings between traps were of 3 µm. The second layout in Figure 15.11c
shows a mechanical trap with identical trap diameters (10 µm) and no exit
channels between them. Figure 15.11d shows a SEM of the trapping sites
designed in the first layout.
Cells were interrogated with different apoptosis-inducing factors, either
electric or chemical, followed by the exposure of treated cells to the appro-
priate fluorescent dyes, FLICA™ and propidium iodide (PI). This allowed
discrimination between viable, apoptotic, and necrotic cells. For example,
FLICA is a reagent that measures apoptosis via detection of caspase activity.
It is a cell-permeable, noncytotoxic peptide reagent, called flourochrome
inhibitor of caspase, that binds active caspases within cells. When added to
a population of cells, the probe enters the cell and covalently binds to a
reactive cysteine residue on the subunit of the target active caspase, thereby
inhibiting further enzymatic activity. Unbound reagent diffuses out of the
cell. The remaining fluorescent signal is a direct measure of the number of
active caspase enzymes present in the cell at the time the reagent is added.
FIGURE 15.10
Diffusion of intracellular dye between fibroblasts in membrane contact. The north cell in both
cell pairs was initially labeled with calcein AM, while the south cell was not. When the two
trapped cells were not in membrane contact (left), no dye transfer occurred. When membrane
contact was present (right), fluorescent dye was able to transfer to the adjacent cell within 16
h. Phase contrast and fluorescence images are depicted for the same field of view. Reprinted
with permission from Lee, P.J., Hung, P.J., Shaw, R., Jan, L., and Lee, L.P. (2005). Applied Physics
Letters 86(22): 223902/223901–223902/223903. © 2005, American Institute of Physics.)
20 µm
3 hours
16 hours 3 hours 16 hours
No membrane contact Membrane contact
DK532X_book.fm Page 410 Tuesday, November 14, 2006 10:41 AM
of two channels joined together in a crossway (Figure 15.11a). The cell-
© 2007 by Taylor & Francis Group, LLC
412 Bio-MEMS: Technologies and Applications
15.2.4 Molecular Analysis of Cells
Conventional benchtop approaches for the molecular analysis of cells typi-
cally starts with thousands to millions of cells from which sufficient molec-
ular material is harvested (i.e., DNA, proteins) to enable a successful analysis.
However, individual cells isolated from a specific location and contained
within a large population pool may possess unique genomes due to their
response to external stimuli resulting in unique expression profiles produced
by the individual cell imposing upon it a distinct phenotype. Thus, the
isolation of genetic material from single cells is of great interest. The ability
to analyze cells (mutational content, identification, etc.) via signature
sequences elucidated from their genomic DNA (gDNA) or mRNA requires
the ability to effectively recover or purify the DNA and RNA from the whole
cell lysate. Following cell lysis, it is often necessary to remove cellular debris,
proteins and other intracellular components that may potentially interfere
with subsequent bioenzymatic reactions. Hong et al. (2004) recently
described a pneumatic microsystem for DNA and RNA isolation from a
single mammalian cell. All processes (i.e., cell isolation, cell lysis, DNA or
mRNA purification, and recovery) were performed on a single microfluidic
chip in nanoliter volumes.
The process for mRNA purification consisted of stacking an affinity col-
umn with oligo-dT polymer magnetic beads, isolating the cells of interest,
measuring and mixing reagents, lysing cells, flushing lysate over the affinity
cessing took place in a linear fashion; valves and cross-junctions were used
to load different segments of a channel with reagents. Opening the valve
between the lysis buffer and the cell chamber allowed diffusive mixing and
FIGURE 15.12
PI uptake in HL60 cells sitting at the trap due to the high electric field line density. (a) Fluo-
rescence image at the time the HL60 cells arrive at the trap. (b) Light microscopy image of the
cells 10 s after EOF control was stopped. (c) Fluorescence image from image (b). Reprinted with
permission from Valero, A., Merino, F., Wolbers, F., Luttge, R., Vermes, I., Andersson, H., and
van den Berg, A. (2005). Lab on a Chip 5(1): 49–55. © 2005, The Royal Society of Chemistry.)
(a) (b) (c)
DK532X_book.fm Page 412 Tuesday, November 14, 2006 10:41 AM
column, and recovering mRNA from the column (Figure 15.13). Batch pro-
© 2007 by Taylor & Francis Group, LLC
414 Bio-MEMS: Technologies and Applications
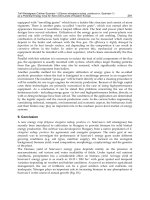
(PDMS). The upper layer contained a closed chamber that was connected to
an external pressure controller; the lower layer contained the microfluidic
network. Between the layers was a thin elastomeric membrane that deformed
under pressure to close the fluidic channel. The three stages of valve oper-
ation were: (1) when no pressure is applied, the PDMS membrane does not
deform and the fluidic channel is open; (2) when slight pressure is applied,
FIGURE 15.14
Three-state valve and picopipette. (a) Schematic illustration of three-state valve (top view and
cross-section). Channels on the upper layer (light shade) are filled with water and connected to
an external pressure controller; channels of the lower layer (dark shade) are the microfluidic
channels with smoothly curved surfaces. The pressure from the upper channel deforms the
membrane between the layers and controls the opening and closing of the lower channel. (b) A
simplified diagram of a three-state valve. (c) Schematic of the three states of this valve. (d) Scheme
of the function of a picopipette. (Reprinted with permission from Wu, H., Wheeler, A., and Zare
Richard, N. (2004). Proceedings of the National Academy of Sciences of the United States of America
101(35): 12809–12813. © 2004, Proceedings of the National Academy of Sciences of the USA.)
Top view
Cross-section
along dashed
line
To externa l
pressure controler
PDMS
(a)
d
(b)
××
×
Valve fully open Valve half open Valve fully closed
(c)
Liquid in
Air in
(d)
L
DK532X_book.fm Page 414 Tuesday, November 14, 2006 10:41 AM
© 2007 by Taylor & Francis Group, LLC
Single-Cell and Single-Molecule Analyses Using Microfluidic Devices 415
the membrane starts to deform and the left horizontal channel is blocked, but
the side channel remains open to the right horizontal channel; and (3) when
more pressure is applied, the side channel is also blocked and no flow takes
achieved by injection of the liquid from an inlet channel by pressure, with the
three-state valve closed (Figure 15.14d). Because PDMS is permeable to air,
liquid is pushed toward the closed valve; as air is displaced through the PDMS,
the chamber between the inlet and the valve is filled with fluid. Injecting air
from the inlet forces most of the liquid from the channel and traps a small
volume of liquid that can be loaded through the three-state valve into a reaction
chamber. The volume of the remaining liquid is accurately defined by the
channel dimensions and the distance from the inlet to the valve. This method
can accurately deliver picoliter amounts of liquid. Although fast evaporation
of water makes it difficult to meter lower volumes accurately with an air–water
interface, it might be possible to meter aqueous solutions with subpicoliter
volume by using oil as the second fluid to prevent evaporation.
A reaction volume of approximately 70 pL was used for the lysis and
derivatization of the contents of a single Jurkat cell, which limited the dilu-
tion of the contents of the single cell. The total analysis time of one cell (cell
injection, fluorescence derivatization, and separation) was 1 h. An electro-
pherogram of amino acids from single cells was recorded and compared
with those collected from a multiple-cell homogenate. Differences in the
separation traces between the single-cell and multicell samples were
assumed to be from insoluble single-cell debris, as this sample was not
filtered, whereas it was filtered in the case of the large cell population.
(Wheeler et al. 2003) developed a microfluidic device constructed from
PDMS for the analysis of single cells designed for two functions: (1) rapid
isolation of an individual cell from a mixture of cells in bulk solution, and
(2) precise delivery of minute volumes of reagents to the selected cell.
FIGURE 15.14 (continued)
Three-state valve and picopipette. (e) Pictures of a three-state valve that is connected to a
picopipette. (Reprinted with permission from Wu, H., Wheeler, A., and Zare Richard, N. (2004).
Proceedings of the National Academy of Sciences of the United States of America 101(35): 12809–12813.
© 2004, Proceedings of the National Academy of Sciences of the USA.)
Valve fully open Valve half open Valve fully closed
(e)
DK532X_book.fm Page 415 Tuesday, November 14, 2006 10:41 AM
place through the valve (Figure 15.14a). The operation of the picopipette is
© 2007 by Taylor & Francis Group, LLC
416 Bio-MEMS: Technologies and Applications
Isolating individual cells from bulk solution was achieved by utilizing fluid
dynamics in microfluidics. The behavior of fluids at the microscale differs
from the macroscale. In microfluidics, the surface tension, energy dissipation,
and fluidic resistance start to dominate and the fluid flow thus exhibits a
number of characteristic features, the most important of which is laminar
flow. Fluids flowing in channels with dimensions on the order of micrometers
and at flow speeds of 1 mm/s are characterized by low Reynolds numbers
(R
e
). The R
e
is usually much less than 100, and oftentimes less than 1.0 in
microscale channels. In this Reynolds number regime, flow is completely
laminar and no turbulence occurs.
To increase the efficiency of capture in flows that are dominated by laminar
flow, cells were hydrodynamically focused between two buffer streams.
Additional side inlet channels delivered reagents directly to a docked cell
for cell viability assays and measurements of calcium fluxes at the level of
single cells. The reagent delivery system utilized PDMS pumps and valves
that were actuated with a manifold of three-way pneumatic switch valves.
The manifold was controlled by compressed nitrogen or helium applied to
the device (approximately 20 psi). Two channels were positioned to the left
shield buffer; the channel farther from the dock delivered reagents. By actu-
ating pumps and valves such that the contents of both channels were flowing
by the dock, reagents were loaded within a few micrometers from the cell
(Figure 15.15c, main). If the shield buffer valve was closed, the reagent could
perfuse over the cell (Figure 15.15c, inset). The microfluidic network enabled
the passive separation of a single cell from a bulk cell suspension, and
integrated valves and pumps allowed the delivery of nL (10
–9
L) volumes of
reagents to the cell. Various applications of this system were demonstrated,
including cell viability assays and measurements of intracellular Ca
+2
flux.
Microfluidic devices play a key role in handling small quantities of mate-
rial, delivering those materials to different locations within the device, and
controlling the movement of cells within the channels. Microfluidic devices
have found numerous applications in biology, biochemistry, and medicine
because of their ability to efficiently control and replicate microenviron-
ments. They also offer practical benefits, such as limiting human exposure
to large amounts of hazardous samples (Shelby et al. 2003). The ability to
fabricate micrometer-sized features in glass, silicon, and polymers makes
these materials attractive options for making capillary-sized structures.
Many of these devices are integrated into far-reaching formats with the
ability to control physical parameters such as flow rate, temperature, and
pressure. Microsystems can closely mimic in vivo environments, and can be
helpful in characterizing biological cell surface area, volume, deformability,
and so forth.
For instance, Shelby et al. (2003) developed a microfluidic for observations
and characterization of Plasmodium falciparum–infected erythrocytes (i.e., red
blood cells [RBCs]). Normal erythrocytes are highly deformable cells, and
they owe their high degree of flexibility to low internal viscosity, high sur-
DK532X_book.fm Page 416 Tuesday, November 14, 2006 10:41 AM
of the cell dock (Figure 15.15c). The channel close to the dock delivered a
© 2007 by Taylor & Francis Group, LLC
418 Bio-MEMS: Technologies and Applications
frequently unresponsive to even the most aggressive treatments. There are
two distinct stages of P. falciparum erythrocytic stage asexual develop-
ment—trophozoite and schizont.
Shelby et al. (2003) developed a microfluidic device for observation and
in vitro modeling of cell deformability. The authors demonstrated the unique
abilities of elastomeric PDMS microchannels to characterize complex behav-
iors of the cells of interest (Figure 15.16). Microchannels were fabricated to
mimic capillaries between 2 and 8 µm in diameter. The average flow velocity
in the channel constriction modeled the flow rates in capillaries (100 to 500
µm/s). Channels ranging in width between 2 and 8 µm were readily tra-
versed by the 8 µm–wide, highly elastic, uninfected RBCs, as well as by
infected cells. Trophozoite stages failed to freely traverse 2 to 4 µm channels.
However, some emerged with morphological deformations. Heavily infected
RBCs failed to traverse 6 µm channels and rapidly formed a capillary block-
age. Uninfected RBCs, though, readily squeezed through the blockages of a
6 µm capillary. The individual erythrocytes in the trophozoite stage of infec-
tion (Figure 15.16b) and in the late schizont stages of infection after being
hydrodynamically forced through a 4 µm channel are shown in Figure 15.16c.
It was observed that the trophozoites recovered their spherical appearance
within approximately 30 s, however, the schizonts did not fully recover their
FIGURE 15.16
(a) Schematic illustrating the geometry of the microchannel. The constricted segment of the
channel (width denoted by w) was sized at 8, 6, 4, and 2 µm. The white arrow represents the
direction of fluid flow. (Upper inset) A differential interference contrast image of normal
(smooth) and infected RBCs. (Lower left inset) A normal RBC passing through a 2 µm constric-
tion. (Lower right inset) Infected RBCs blocking a 6 µm constriction. (b–c) Differences in
recovery of compressed infected cells; (b) Early trophozoite stages of infected RBCs were
partially distorted after passage through a 4 µm constriction and remained compressed for 30
sec after emerging from the channels. (c) Schizont forms of RBC infections were more severely
deformed and did not relax back to their original shape after passage through a 4 µm constriction
even 1 to 2 min after compression. (Reprinted with permission from Shelby, J.P., White, J.,
Ganesan, K., Rathod, P.K., and Chiu, D.T. (2003). Proceedings of the National Academy of Sciences
of the United States of America 100(25): 14618–14622. © 2003, The National Academy of Sciences
of the USA.)
w
5 µm5 µm
(b)
10 µm
(c)
(a)
DK532X_book.fm Page 418 Tuesday, November 14, 2006 10:41 AM
© 2007 by Taylor & Francis Group, LLC
Single-Cell and Single-Molecule Analyses Using Microfluidic Devices 419
spherical shape even after 1 to 2 min. It was concluded that both the RBC’s
membrane rigidity and internal viscosity increase as the parasite matures;
therefore, erythrocytes in the later stages of infection have longer recovery
times than cells in the early stages of infection. Such devices can thus be
used to screen antimalarial drugs or agents that can reverse the biomechan-
ical effects of malaria parasites on RBCs.
15.2.5 Organelle Manipulation in Microfluidics
A typical single organelle may range in size from tens of nanometers to a
couple of micrometers with a corresponding volume of approximately 6 × 10
–20
L for a 50 nm synaptic vesicle to approximately 8 × 10
–15
L for a 2 µm mito-
chondrion (Chiu 2003). Within a volume of 6 × 10
–20
L, even at a relatively high
concentration of 100 mM, the number of molecules present is only approxi-
mately 3600. At this small scale, most proteins would be present as a single
copy or only as a few copies. Therefore, the analysis of subcellular compart-
ments necessitates an approach that is both highly sensitive and capable of
isolating each organelle and then analyzing the various components of the
organelle for characterization and quantitation (Lu et al. 2004a).
Lu et al. (2004a) reported a microfabricated field flow fractionation device
for continuous separation of subcellular organelles by isoelectric focusing.
The microdevice provided fast separation while avoiding large voltages and
heating effects. The authors presented the separation of mitochondria from
whole cells and nuclei (Figure 15.17) as well as the separation of two mito-
chondrial subpopulations. When automated and operated in parallel, these
microdevices could facilitate high-throughput analysis in studies requiring
separation of specific organelles.
FIGURE 15.17
IEF of mitochondria from lysate of NR6WT cells stained with MitoTracker Green and propidium
iodide. The mitochondria focus into a distinct narrow band while the nuclei migrate to a broad
band. A pH 3 to 6 buffer was used; the mitochondria focused at pI between 4 and 5. (Reprinted
with permission from Lu et al. (2004a). © 2004, American Chemical Society.)
Flow direction
Cathode
Anode
Mitochondrial
fraction
Nuclei
}
100 µm
DK532X_book.fm Page 419 Tuesday, November 14, 2006 10:41 AM
© 2007 by Taylor & Francis Group, LLC
420 Bio-MEMS: Technologies and Applications
Strömberg et al. (2001) described an electrofusion-based technique for
combinatorial synthesis of individual liposomes. A device with containers
for liposome fusion was constructed. Optical trapping (Chiu et al. 1996) was
used to transport individual liposomes and cells through the microchannels
into the fusion container, where pairs of liposomes were fused together.
Optical trapping is a technique that utilizes laser light to trap and manipulate
small (nm scale) spherical objects using the radiation pressure produced from
a focused laser beam.
Sequential fusion of liposomes with different dyes incorporated into their
membranes is shown in Figures 15.18a through h. The first fusion (Figures
15.18a through d) involves a liposome with no membrane dye incorporated
and a green fluorescent liposome in the membrane. The product liposome,
shown in Figure 15.18d, was then fused with a red fluorescent liposome
FIGURE 15.18
Sequential pairwise fusion of three different liposomes. The first fusion involves a plain liposome
(no membrane dye in the membrane) and a liposome with the membrane fluorescent dye DiO
(a–c). The membrane dye distributes evenly over the entire membrane surface in the product
liposome (d). In the next fusion the created hybrid liposome with DiO was fused with a liposome
with the membrane fluorescent dye DiI (e–g). DiI was distributed over the entire membrane
surface of the product hybrid liposome (h). Black-and-white fluorescence images were pseudo-
color-coded and enhanced digitally. The scale bar is 10 µm. (Reprinted with permission from
Stromberg, A., Karlsson, A., Ryttsen, F., Davidson, M., Chiu, D.T., and Orwar, O. (2001). Ana-
lytical Chemistry 73(1): 126–130. © 2001, American Chemical Society.)
(a) (b) (c) (d)
(e) (f ) (g) (h)
DK532X_book.fm Page 420 Tuesday, November 14, 2006 10:41 AM
© 2007 by Taylor & Francis Group, LLC
Single-Cell and Single-Molecule Analyses Using Microfluidic Devices 421
dyes were evenly distributed after each fusion. This procedure allowed for
a large number of synthesized liposomes with complex components and
reaction systems to be obtained from small sets of precursor liposomes. The
use of optical trapping for the handling of cells required that trapping leave
the cells undamaged, which could be achieved using near-IR lasers. They
demonstrate excellent spatial resolution (10 nm to 100 µm) and confer a large
degree of dexterity and accuracy in the manipulation of micron-scale objects.
For biological applications, the fact that the lasers are noninvasive, sterile,
and operate in the near-IR (λ = 700 to 1064 nm) means that there are little
to no biological effects on cells. In the future the cell selection and fusion
concept should be advantageously used for the production of hybridomas,
cloning, and cell–liposome fusions.
Sinclair et al. (2002) presented a cell-based bar code reader for screening
of ion channel–ligand interactions. The microfluidic platform performed a
high-throughput screening and characterization of weak-affinity ion chan-
nel–ligand interactions. The device integrated a microfluidic chip with mul-
tiple channels entering an open volume with standard patch clamp
equipment (Figure 15.19). The microfluidic chip was placed on a motorized
scanning stage (ms scan rate capabilities). A patch-clamped cell was rapidly
scanned across zones of different solutions. This method had the capacity to
obtain kinetically resolved patch clamp measurements and dose-response
curves of up to 1000 ligands in a single day.
FIGURE 15.19
Schematic showing the design of a microfluidic device for generating chemical bar codes in
open volumes. The microfluidic chip is mounted on a programmable scanning stage (not
shown) that can move the channel outlets relative to a patch-clamped cell. The patch clamp
electrode is positioned using micromanipulators. B represents buffer reservoirs and channels,
and L1-3 represents the different ligand reservoirs and channels. F1 is the drag force acting on
the cell due to scanning, and F2 is the force created by fluid flow from the microchannel outlets.
The inset shows a cross-section of the device with the channel structure in Si bonded to glass
and PDMS. PDMS was used to increase the height of the reservoirs and sensor chamber. Each
channel is 50 µm wide and 100 µm high, and the flow rate was 3 mm/s. The stream remains
collimated in the open volume. B and L depict channels filled with buffer solution and dye,
respectively. (Reprinted with permission from Sinclair, J., Pihl, J., Olofsson, J., Karlsson, M.,
Jardemark, K., Chiu, D.T., and Orwar, O. (2002). Analytical Chemistry 74(24): 6133–6138. © 2002,
American Chemical Society.)
+P
PDMS
Si
Glass
To amplifier
Translation of
microscope stage
F
2
F
1
L
3
L
2
L
1
B
B
B
B
z
x
y
x
z
DK532X_book.fm Page 421 Tuesday, November 14, 2006 10:41 AM
within the membrane (Figures 15.18e through h). The fluorescent membrane
© 2007 by Taylor & Francis Group, LLC