Machine Learning and Robot Perception - Bruno Apolloni et al (Eds) Part 3 pps
Bạn đang xem bản rút gọn của tài liệu. Xem và tải ngay bản đầy đủ của tài liệu tại đây (625.23 KB, 25 trang )
42
M. Mata et al.
1.6.4 Corridor Navigation Example
A more complex unconstrained navigation problem is presented now.
The robot starts in a unknown point of the building, and it must reach a
specific location. In this example, the robot starts in the hall between zones
B and C, on the third floor of building 1. The robot does not know any of
this, and is told to reach room 1.2D01. Fig. 1.30.a presents the landmark
distribution and the approximate trajectory (there is no need for odometric
measures) described by the robot. The robot does not know its initial position, so it tries to find and read a room nameplate landmark. If it can
achieve this, then immediately knows its position (building, zone and office it stands at). In this case, it can’t find any one. Then, the “room identification from landmark signature” ability is used. The robot tries to find all
the landmarks around it, and compares the obtained landmark sequence
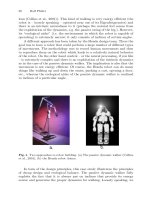
with stored ones. Fig. 1.31.a shows an image of this location, taken with
the robot’s camera. In this example, again this is not enough, because there
are several halls with a very similar landmark signature. The last strategy
considered by the robot is entering a corridor (using the laser telemeter)
and trying again to read a nameplate. Now this is successful, and the robot
reads “1.3C01” in the image shown in Fig. 1.31.b. Once located, the desired action sequence until the objective room is reached is generated. The
robot is in the right building, but in the third floor, so it must search for a
lift to go down one floor. The topological map indicates it has to follow the
C zone corridor, then enter a hall, and search here for a “lift” sign. It follows the corridor, and tries to read the nameplates for avoiding getting lost.
If some are missed, it is not a problem, since reading any of the following
ones relocates the robot. If desired, other landmarks present in the corridors (like fire extinguisher ones) can be used as an additional navigation
aid. When the corridor ends in a new hall (Fig. 1.31.c), the robot launches
the room identification ability to confirm that. The hall’s landmark signature includes the lift sign. When this landmark is found and read (Fig.
1.31.d), the robot finishes its path in this floor, and knows that entering the
lift lobby is the way to second floor. Our robot is not able to use the lifts,
so the experiment ends here.
1 Learning Visual Landmarks for Mobile Robot Topological Navigation
(a)
(b)
(c)
43
(d)
Fig. 1.31. Some frames in the robot’s path
A more complex situation is tested in a second part of the experiment.
The robot is initially headed so it will start moving in the wrong direction
(entering zone B instead C, see Fig. 1.30.b). When the robot reads the first
nameplate in B zone (“1.3B12”) realizes the wrong direction and heads
back to C zone corridor, and then follows it like before. Furthermore, this
time several landmarks (including the lift one) have been occluded for test
purposes. The robot can not recognize the hall, so it heads for the new corridor, corresponding to D zone. When a nameplate is read, the robot knows
it has just passed the desired hall and heads back for it. The experiment
ends when the robot assures it is in the right hall, but unable to find the occluded lift sign.
1.7 Practical Limitations through Experiments
Exhaustive tests have been done to the system to evaluate its performances
and limitations. All tests have been carried out with real 640x480 color
images, without illumination control. The following points present some
limitations to the object detection. If the object in the image complies with
these limitations, it will surely be detected. The detection will fail if the
limitations are exceeded. On the other hand, false positives (detecting an
44
M. Mata et al.
object that is not present in the image) are very difficult to occur, as a consequence of the particularizations made and the autonomous training with
real images. No search is tried if no ROI are detected, and restrictive conditions for accepting the results are used. Unless otherwise specified, the
failure conditions are for false negatives.
1.7.1 Illumination Conditions
The system is extremely robust to illumination conditions, as a consequence of:
1. HSL color space is used, separating luminance component from color.
Color segmentation is done using relaxed intervals learned from illumination-affected real images. Furthermore, it does not need to be perfect.
2. Normalized correlation minimizes lightning effect in search stage.
3. All related processing thresholds are dynamically selected or have been
learned.
Illumination is the main cause of failure only in extreme situations, like
strongly saturated images or very dark ones (saturation goes to zero in both
cases, and all color information is lost), because no specific ROI are segmented and the search is not launched. This can be handled, if needed, by
running the search with general ROI detection, although computation time
is severely increased, as established. Strong backlighting can cause failure
for the same reason, and so metallic brightness. Fig. 1.32 shows several
cases where the object is found in spite of difficult lightning conditions,
and Fig. 1.33 shows failures. A white circle indicates the presence of the
object when not clearly visible.
1 Learning Visual Landmarks for Mobile Robot Topological Navigation
(a)
(b)
45
(c)
Fig. 1.32. Object found in difficult illumination conditions: (a) poor, (b) excessive, (c) night
(a)
(b)
(c)
Fig. 1.33. Failures due to extreme illumination conditions: (a) darkness, (b) dense
mist, (c) backlight
46
M. Mata et al.
1.7.2 Detection Distance
The most frequent failure cause is distance to the object. If the object is too
far from the camera, it will occupy too few pixels in the image. A minimal
object size in the image is needed for distinguishing it. The maximum detection distance is function of the object size and the camera optic focal
distance. On the other hand, if the object is too close to the camera, usually
part of it will fall outside the image. The consequences are the same that
for partial occlusion (section 1.7.3). There is another source for failure.
The correlation between the details included in the pattern-windows and
the object decreases slowly as the object details became bigger or smaller
that the pattern-window captured details. This decrease will make the correlation values fall under the security acceptance thresholds for the detection. Some details are more robust than others, and the object can be detected over a wider range of distances. Relative angle of view between the
object and the optical axis translates into perspective deformation (vertical
skew), handled with the SkY parameter of the deformable model. This deformation also affects to the object details, so the correlation will decrease
as the vertical deformation increases, too. The pattern-windows are taken
on a frontal-view image of the object, so detection distance will be maximal in frontal views, and will decrease as angle of view increases. Fig.
1.34 illustrates this: the average correlation of the four patter-windows for
the green circle is painted against the camera position respect to the object
in the horizontal plane (the green circle is attached to the wall). The circle
is 8 cm diameter, and a 8-48 mm motorized zoom has been used. The effect of visual angle can be reduced if various sets of pattern-windows are
used, and switched accordingly to model deformation.
1.7.3 Partial Occlusion
ROI segmentations is barely affected by partial occlusion, it will only
change its size. The subsequent search will adjust the deformed model parameter later. The search stage can or can not be affected, depending on
the type of occlusion. If the object details used for the matching are not occluded, it will have no effect (Fig. 1.35.b). If one of the four detail zones is
occluded, global correlation will descend; depending on the correlation of
the other three pattern-windows, the match will be over the acceptance
thresholds (Fig. 1.35.a), or will not. Finally, if at least two detail zones are
occluded, the search will fail (Fig. 1.35.c), street naming panel).
1 Learning Visual Landmarks for Mobile Robot Topological Navigation
47
Fig. 1.34. average pattern-window correlation with distance and angle of view for
the green circle. Values under 70% are not sufficient for accepting the detection
(a)
(b)
(c)
Fig. 1.35. Different situations under partial occlusion
1.7.4 Object Morphology
The morphology of the objects to detect is limited by the particularizations
made to achieve practical time requirements for the system. The object
must be planar (or at least with a relatively small third dimension), or a
face of a 3D object. The suppression of the rotation degree of freedom
causes that only objects appearing always with the same orientation are detected (although some rotation can be handled by the vertical deformation
d.o.f.). Object shape has no restrictions, since the base deformable model
only encloses the object; particular shape features will be used for the object search process. Color segmentation requires that objects one wants to
48
M. Mata et al.
include in the same class must share a similar color, independent of its extension or location inside the object. Also object specific detail requires
some common details shared by objects pretended to belong to the same
class. If these requirements are not satisfied, trying to include too different
objects in the same class will lead to a weak and uncertain learning; this
can be detected during the learning process (the associated scoring functions will have low values).
1.7.5 Defocusing
Defocusing must be taken into account in real applications, where image
capture conditions are not strictly controlled. Optic focusing can be inexact, or relative movement between camera and object can make it to appear
blurred if image capture integration time is too high; furthermore, interlaced CCD video cameras capture odd and even fields in different time instants, so they also are affected by movement. A high gain, progressive
scan CCD color camera, model CV-M70 from JAI, has been used for the
system evaluation to minimize movement effects, for example if the camera is mounted onboard a vehicle (one of the potential application fields).
Defocusing only affects color segmentation by changing segmented contours, but this is corrected by the genetic object search. The correlation
used for the searching process can be affected under severe defocusing, especially if the learned pattern-windows contain very thin and precise details, which can be destroyed by blur. However, the learning process along
a wide set of real examples of the objects tries to minimize this effect (excessive thin details are not always present in the images).
1.8 Conclusions and Future Works
A practical oriented, general purpose deformable model-based object detection system is proposed. Evolutionary algorithms are used for both object search and new object learning. Although the proposed system can
handle 3D objects, some particularizations have been done to ensure computation times low enough for real applications. 3D extension is discussed.
The system includes a symbolic information reading stage, useful for a
wide set of informative panels, traffic signs and so on. The system has
been developed and tested using real indoor and outdoor images, and several example objects have been learned and detected. Field experiments
1 Learning Visual Landmarks for Mobile Robot Topological Navigation
49
have proven the robustness of the system for illumination conditions and
perspective deformation of objects, and applicability limits have been explored. Potential application fields are industrial and mobile robotics, driving aids and industrial tasks. Actually it is being used for topological navigation of an indoor mobile robot and for a driver assistance system [17].
There are several related works in the literature in the line exploited in the
present article, showing this is an active and interesting one. Aoyagi and
Asakura [1] developed a traffic sign recognition system; circular signs are
detected with a GA and a NN classifies it as speed sign or other; a 3 d.o.f.
circle is matched over a luminance-binarized image for the sign detection.
Although seriously limited, includes several interesting concepts. GA initialization or time considerations are not covered. Minami, Agbanhan and
Asakura [32] also uses a GA to optimize a cost function evaluating the
match between a 2D rigid model of an object’s surface and the image, considering only translation and rotation. Cost function is evaluated over a
128x120 pixel grayscale image. It is a very simple model, but the problem
of where to select the object specific detail over the model is addressed,
concluding that inner zones of the model are more robust to noise and occlusion. In our approach, detail location inside the basic model is autonomously learned over real images. Mignotte et al. [35] uses a deformable
model, similar to our 2D presented one, to classify between natural or
man-made objects in high-resolution sonar images. The model is a cubic
B-spline over control points selected by hand, that is tried to adjust precisely over sonar cast-shadows of the objects. This is focused as the maximization of a PDF relating the model and the binarized (shadow or reverberation) image by edges and region homogeneity. Various techniques are
compared to do this: a gradient-based algorithm, simulated annealing (SA),
and an hybrid GA; the GA wins the contest. Unfortunately, the application
is limited to parallelepipedal or elliptical cast shadows, are multiple object
presence is handled by launching a new search. Furthermore, using a binary image for cost function evaluation is always segmentation-dependant;
in our approach, correlation in grayscale image is used instead. This chapter shows the usefulness of this new landmark detection and reading systems in topological navigation tasks. The ability of using a wide spread of
natural landmarks gives great flexibility and robustness. Furthermore, the
landmark reading ability allows high level behaviors for topological navigation, resembling those used by humans. As the examples have shown the
robot need not to know its initial position in the environment, it can recover of initial wrong direction and landmark occlusion to reach the desired destination. A new color vision-based landmark learning and recognition system is presented in this chapter. The experiments carried out
50
M. Mata et al.
have shown its utility for both artificial and natural landmarks; furthermore, they can contain written text. This text can be extracted, read and
used later for any task, such as high level localization by relating written
names to places. The system can be adapted easily to handle new landmarks by learning them, with very little human intervention (only providing a training image set). Different text styles can be read using different
sets of neural classifier weights; these sets can be loaded from disk when
needed. This generalization ability is the relevant advantage from classical
rigid methods. The system has been tested in an indoor mobile robot navigation application, and proved useful. The types of landmark to use are not
limited a-priori, so the system can be applied to indoor and outdoor
navigation tasks. The natural application environments of the system are
big public and industrial buildings (factories, stores, etc.) where the preexistent wall signals may be used, and outside environments with welldefined landmarks such as streets and roads. This chapter presents some
high-level topological navigation applications of our previously presented
visual landmark recognition system. Its relevant characteristics (learning
capacity, generality and text/icons reading ability) are exploited for two
different tasks. First, room identification from inside is achieved through
the landmark signature of the room. This can be used for locating the robot
without any initialization, and for distinguishing known or new rooms during map generation tasks. The second example task is searching for a specific room when following a corridor, using the room nameplates placed
there for human use, without any information about distance or location of
the room. The textual content of the nameplates is read and used to take
high-level control decisions. The ability of using preexistent, human-use
designed landmarks, results in a higher degree of integration of mobile robotics in everyday life.
References
1
2
Aoyagi Y., Asakura, T., (1996) “A study on traffic sign recognition in
scene image using genetic algorithms and neural networks”. International Conference on Industrial Electronics, Control and Instrumentation, pp.1838-1843.
Argamon-Engelson, S. (1998) “Using image signatures for place recognition”. Patter Recognition Letters 19, pp. 941-951.
1 Learning Visual Landmarks for Mobile Robot Topological Navigation
3
4
5
6
7
8
9
10
11
12
13
14
51
Armingol J.M., de la Escalera, A., Salichs, M.A., (1998) “Landmark
perception planning for mobile robot localization”. IEEE International
Conference on Robotics and Automation, vol. 3, pp. 3425-30.
Balkenius, C. (1998) "Spatial learning with perceptually grounded representations". Robotics and Autonomous Systems, vol. 25, pp. 165175.
Barber R., Salichs, M.A. (2001) “Mobile robot navigation based on
events maps”. 3rd International Conference on Field and Service Robots, pp. 61-66.
Beccari, G.; Caselli, S.; Zanichelli, F. (1998) "Qualitative spatial representations from task-oriented perception and exploratory behaviors".
Robotics and Autonomous Systems, vol. 25, pp. 165-175.
Betke, M., Makris, N., (2001) “Recognition, resolution, and complexity of objects subject to affine transformations”, International Journal
of Computer Vision, vol.44, nº 1, pp. 5-40.
Bhandarkar, S. M.; Koh, J.; Suk, M., (1997) “Multiscale image segmentation using a hierarchical self-organizing map”. Neurocomputing,
vol. 14, pp. 241-272.
Bin-Ran; Liu, H. X.; Martonov, W., (1998) “A vision-based object detection system for intelligent vehicles”. Proceedings of the SPIE- the
International Society for Optical Engineering, vol. 3525, pp. 326-337.
Blaer, P., Allen, P. (2002) “Topological mobile robot localization using fast vision techniques”. IEEE International Conference on Robotics and Automation, pp. 1031-1036.
Borenstein, J. and Feng. L., (1996) "Measurement and correction of
systematic odometry errors in mobile robots". IEEE Journal of Robotics and Automation, vol. 12, nº 6, pp. 869-880.
Colin, V. and Crowley, J., (2000) “Local appearance space for recognition of navigation landmarks”. Robotics and Autonomous Systems,
vol. 31, pp. 61-69.
Cootes, T.F., Taylor, C.J., Lanitis, A., Cooper, D.H., Graham, J.
(1993) “Building and using flexible models incorporating gray level
information”. International Conference on Computer Vision, pp.242246.
Dubuisson M.P., Lakshmanan S., and Jain A.K. (1996) “Vehicle segmentation and classification using deformable templates”, IEEE
Transaction on Pattern Analysis and Machine Intelligence, vol.18, nº
3, pp.293-308.
52
M. Mata et al.
15 Edelman S., Bulthoff H. and Weinshall D. (1989) “Stimulus familiarity determines recognition strategy for novel 3D objects”, technical report 1138, Massachussets Institute of Technology, Artificial Intelligence Laboratory.
16 Egido, V., Barber, R., Salichs, M.A., (2002) “Self-generation by a mobile robot of topological maps of corridors”. IEEE International Conference on Robotics and Automation, pp. 2662-2667.
17 Escalera A. de la, Armingol J. M. and Mata M. (2003) “Traffic sign
recognition and analysis for intelligent vehicles”, Image and Vision
Computing, vol. 21, pp. 247-258.
18 Fahlman, S. E. (1998) “An empirical study of learning speed in backpropagation networks”. CMU-CS-88-162.
19 Franz, Matthias O. (1998) “Learning view graphs for robot navigation”. Autonomous robots, vol. 5, pp. 111-125.
20 Fukuda, T., Nakashima, M., Arai, F., Hasegawa, Y. (2002) “Generalized facial expression of character face based on deformation model
for human-robot communication”. International Workshop on Robot
and Human Interactive Communication, pp. 331-336.
21 Gaskett, C., Fletcher, L., Zelinsky, A., (2000) “Reinforcement learning
for vision based mobile robot”. International Conference on Intelligent
Robots and Systems, vol. 2 pp. 403-409.
22 Ghita, O., Whelan, P. (1998) “Eigenimage analysis for object recognition”, technical report, Vision Systems Laboratory, School of Electronic Engineering, Dublin City University.
23 Iida, M., Sugisaka, M., Shibata, K., (2002) “Application of directvision based reinforcement learning to a real mobile robot”. International Conference on Neural Information Processing, vol. 5 pp. 25562560.
24 Kervrann, C., Heitz, F., (1999) “Statistical deformable model-based
segmentation of image motion”, IEEE Transactions on Image Processing, vol.8, nº 4, pp.583-8.
25 Kreucher C., Lakshmanan S. (1999) “LANA: a lane extraction algorithm that uses frequency domain features”, IEEE Transactions on Robotics and Automation, vol.15, nº 2, pp.343-50.
26 Kubota, N., Hashimoto, S., Kojima, F. (2001) “Genetic programming
for life-time learning of a mobile robot”. IFSA World Congress and
20th NAFIPS International Conference, vol. 4, pp. 2422-2427.
27 Launay, F., Ohya, A., Yuta, S. (2002) “A corridors lights based navigation system including path definition using topologically corrected
map for indoor mobile robots”. IEEE International Conference on Robotics and Automation, pp. 3918-3923.
1 Learning Visual Landmarks for Mobile Robot Topological Navigation
53
28 Lijun Y., Basu A. (1999) “Integrating active face tracking with model
based coding”, Pattern Recognition Letters, vol.20, nº 6, pp.651-7.
29 Liu, L., Sclaroff, S., (2001) “Medical image segmentation and retrieval
via deformable models”. International Conference on Image Processing, vol. 3, pp. 1071-1074.
30 Liu, Y.; Yamamura, T.; Ohnishi, N.; Surgie, N., (1998) “Characterbased mobile robot navigation”. 1998 IEEE International Conference
on Intelligent Vehicles, pp. 563-568.
31 Luo, R. C.; Potlapalli, H., (1994) “Landmark recognition using projection learning for mobile robot navigation”. IEEE International Conference on Neural Networks, vol. 4, pp. 2703-2708.
32 Minami, M., Agbanhan, J., Asakura, T. (2001) “Robust scene recognition using a GA and real-world raw-image”, Measurement, vol. 29,
pp.249-267.
33 Mahadevan, S.; Theocharous, G., (1998) “Rapid concept learning for
mobile robots”. Machine learning, vol. 31, pp. 7-27.
34 Mata, M.; Armingol, J.M.; Escalera, A.; Salichs, M.A. (2001) “Mobile
robot navigation based on visual landmark recognition” International
Conference on Intelligent Autonomous Vehicles, pp. 197-192.
35 Mignotte, M., Collet, C., Perez P., Bouthemy, P. (2000) “Hybrid genetic optimization and statistical model-based approach for the classification of shadow shapes in sonar imaginery”, IEEE Transactions on
Pattern Analysis and Machine Intelligence, vol.22, nº 2, pp.129-141.
36 Myers, E. W., Oliva, P., Guimarães, K.S.(1998) “Reporting Exact and
Approximate Regular Expression Matches”. Combinatorial Pattern
Matching, 9th Annual Symposium CPM’98. pp. 91-103
37 Ohyama, T; (1995) “Neural network-based regions detection”. IEEE
International Conference on Neural Networks. Proceedings, vol.3, nº
2; pp. 222-302.
38 Perez, F.; Koch, C. (1994) “Toward color image segmentation in analog VLSI: algorithm and hardware”. International Journal of Computer
Vision, vol. 12, nº 1 pp. 17-42.
39 Poupon F., Mangin J. F., Hasboun D., Poupon C., Magnin I., Frouin V.
(1998)“Multi-object deformable templates dedicated to the segmentation of brain deep structures”, Medical Image Computing and Computer Assisted Intervention, First International Conference, pp.113443.
40 Rosenfeld A., (2000) “Image analysis and computer vision 1999 [survey]”. Computer Vision and Image Understanding, vol. 78 nº 2, pp
222-302.
54
M. Mata et al.
41 Rue H. and Husby O.K. (1998) “Identification of partly destroyed objects using deformable templates”. Statistics and Computing, vol.8, nº
3, pp.221-228.
42 Salichs, M.A., Moreno, L. (2000) “Navigation of mobile robots: open
questions”. Robotica, vol.18, pp. 227-234.
43 Selinger A., Nelson R. C. (1999) “A Perceptual grouping hierarchy for
appearance-based 3D object recognition”, technical report, Department
of Computer Science, University of Rochester.
44 Sim, R., Dudek, G., “Mobile robot localization from learned landmarks”. International Conference on Intelligent Robots and Systems,
vol. 2. pp. 1060-1065.
45 Takahashi, Y., Asada, M., (2000) “Vision-guided behavior acquisition
of a mobile robot by multi-layered reinforcement learning”. Conference on Intelligent Robots and Systems, vol. 1, pp. 395-402.
46 Tarr M.J., Bülthoff H.H. (1998) “Image-based object recognition in
man, monkey and machine”, Cognition, vol.67, pp. 1-20.
47 Thompson, S., Zelinsky, A., (2002) “Accurate local positioning using
visual landmarks from a panoramic sensor”. IEEE International Conference on Robotics and Automation, pp. 2656-2661.
48 Tomono M., Yuta, S. (2000) “Mobile robot navigation in indoor environments using object and character recognition”. IEEE International
Conference on Robotics and Automation, pp. 313-320.
49 Tsang, C.K., Fu-Lai Chung., (1998) “Development of a structural deformable model for handwriting recognition “. 14th Conference on
Pattern Recognition, vol. 2 pp. 1130-1133.
50 Uchida, S., Sakoe, H., (2003) “Handwritten character recognition using elastic matching based on a class-dependent deformation model”.
7th International Conference on Document analysis and Recognition,
pp. 163-167.
51 Ullman, S. (1998) “Three-dimensional object recognition based on the
combination of views”, Cognition, vol.67, pp.21-44.
52 Valveny E., Marti E. (1999) “Application of deformable template
matching to symbol recognition in handwritten architectural drawings”. 5th International Conference on Document Analysis and Recognition, pp. 483-486.
53 Walker, M., Messom, C.H., (2002) “A comparison of genetic programming and genetic algorithms for auto-tuning mobile robot motion
control”. IEEE International Workshop on Electronic Design, pp. 507509.
54 Yu, Z., Jain, A.K., (2000) “Object localization using color, texture and
shape”, Pattern Recognition, vol.33, nº 4, pp. 671-84.
1 Learning Visual Landmarks for Mobile Robot Topological Navigation
55
55 Yuille, A., Halliman, P., Cohen, D., (1992) “Feature extraction from
faces using deformable models”, International Journal of Computer
Vision, vol.8, nº 2, pp.99-111.
56 Yung, N., Lai, A., (1998) “Detection of vehicle occlusion using a generalized deformable model”. IEEE International Symposium on Circuits and Systems, vol. 4, pp. 154-157.
2 Foveated Vision Sensor
and Image Processing – A Review
Mohammed Yeasin1, Rajeev Sharma2
1. Department of Electrical and Computer Engineering, University of
Memphis, TN 38152-3180
Email:
2. Department of Computer Science and Engineering The Pennsylvania State University, University Park, PA-16802
Abstract. The term foveated vision refers to sensor architectures based on smooth
variation of resolution across the visual field, like that of the human visual system.
The foveated vision, however, is usually treated concurrently with the eye motor
system, where fovea focuses on regions of interest (ROI). Such visual sensors
expected to have wide range of machine vision applications in situations where the
constraint of performance, size, weight, data reduction and cost must be jointly
optimized. Arguably, foveated sensors along with a purposefully planned
acquisition strategy can considerably reduce the complexity of processing and
help in designing superior vision algorithms to extract meaningful information
from visual data. Hence, understanding foveated vision sensors is critical for
designing a better machine vision algorithm and understanding biological vision
system.
This chapter will review the state-of-the-art of the retino-cortical (foveated)
mapping models and sensor implementations based on these models. Despite
some notable advantages foveated sensors have not been widely used due to the
lack of elegant image processing tools. Traditional image processing algorithms
are inadequate when applied directly to a space-variant image representation. A
careful design of low level image processing operators (both the spatial and
frequency domain) can offer a meaningful solution to the above mentioned
problems. The utility of such approach was explefied through the computation of
optical flow on log-mapped images.
Key words Foveated vision, Retino-cortical mapping, Optical flow, Stereo
disparity, Conformal mapping, and Chirp transform.
2.1 Introduction
The amount of data that needs to be processed to extract meaningful
in-formation using uniform sampling cameras is often enormous and also
M. Yeasin and R. Sharma: Foveated Vision Sensor and Image Processing A Review, Studies
in Computational Intelligence (SCI) 7, 57–98 (2005)
c Springer-Verlag Berlin Heidelberg 2005
www.springerlink.com
58
M. Yeasin and R. Sharma
redundant in many machine vision applications. For example, in case of
autonomous navigation [1, 2], vergence control [3, 4, 5], estimation of
time-to-impact [6, 7, 8], object recognition [9, 10, 11] and object tracking
[12, 13, 14], one usually needs a real-time coordination between sensory
perception and motor control [15]. A biologically motivated sensor along
with purposefully planned acquisition strategy can considerably reduce the
complexity of processing. Hence, the main theme behind developing a
space-variant sensor is to establish an artificial vision and sensory-motor
coordination. The aim could also be to understand how the brain of living
systems sense the environment also transform sensory input into motor and
cognitive functions by implementing physical models of sensory-motor
behaviors.
Studies on primate visual system reveal that there is a compromise
which simultaneously provides a wide field of view and a high spatial
resolution in the fovea. The basis of this compromise is the use of variable
resolution or Foveated vision system [16]. The term Foveated vision refers
to sensor architectures based on smooth variation of resolution across the
visual field, like that of the human visual system. Like the biological retina, sensor with a high resolution fovea and a periphery whose resolution
decreases as a function of eccentricity can sample, integrate, and map the
receptor input to a new image plane. This architecture is an efficient means
of data compression and has other advantages as well. The larger receptive
fields in the periphery integrate contrast changes, and provide a larger
separation for sampling the higher velocities. Their elegant mathematical
properties for certain visual tasks also motivated the development of Foveated sensors. Foveated architectures also have multi-resolution property
but is different from the pyramid architecture [17]. Despite some notable
advantages space-variant sensors have not been widely used due to the
lack of elegant image processing tools.
Nevertheless, the use of space-variant visual sensor is an important factor when the constraint of performance, size, weight, data reduction and
cost must be jointly optimized while preserving both high resolution and a
wide field of view. Applications scenarios of such sensors include:
Image communication over limited bandwidth channels such as
voice-band telephony [18] and telepresence [19, 20].
Surveillance applications for public spaces (e.g., intelligent
highway applications, factories, etc.) [21] and private spaces
(e.g., monitoring vehicles, homes and etc.)[22].
Applications in which visible or infra-red camera system is used
to analyze a large work area [23], and communicate the scene
interpretation to a human observer via non-visual cues.
2 Foveated Vision Sensor and Image Processing – A Review
59
Field applications (for example, agriculture, forestry, and etc.)
in which identification and classification from a wide field of
view must be performed by a small, low power portable system
and communicated to the human user.
Autonomous and tele-operated vehicle control.
The broad range of applications mentioned above is by no means exhaustive, rather, an indication of the potential advantages that a biologically motivated design can offer to the large segment of machine vision
and image communication. Although many difficult problems are confronted in the application of a space-variant sensor, one is motivated by the
example of biological vision, the useful geometric characteristics and elegant mathematical properties of the sensor mapping, favorable spacecomplexity and synergistic benefits which follows from the geometry as
well as from the mapping.
The physiological and perceptual evidence indicates that the log-map
image representations approximates the higher vertebrate visual system
quite well and have been investigated by several researchers during the
past several decades (for example, [24, 25, 26, 27, 28]). Apart from these,
a variety of other space-variant sensors has been successfully developed
(for example, ESCHeR [29, 30]), and has been used for many machine vision tasks with a proven record of success and acceptable robustness [31,
32]. The problem of image understanding takes a new form with foveated
sensor as the translation symmetry and the neighborhood structure in the
spatial domain is broken by the non-linear logarithmic mapping. A careful
design of low level image processing operator (both the spatial and frequency domain) can offer a meaningful solution to the above problems.
Unfortunately, there has been little systematic development of image understanding tools designed for analyzing space-variant sensor images.
A major objective of this chapter is (i) to review the state-of-the-art of
foveated sensor models and their practical realizations, and (ii) to review
image processing techniques to re-define image understanding tools to
process space-variant images. A review catadioptric sensor [33, 34, 35, 36,
37] and panoramic camera [38, 39] which also share similar characteristics
i.e., variable resolution and wide field of view were not included. The rest
of the chapter is organized as follows. Section 2 review the retino-cortical
mapping models reported in the literature. The synergistic benefits of logpolar mapping were presented in Section 3.Following this; Section 4 presents the sensor implementations to date to provide a picture of the present
state-of-the-art of the technology. Subsequently, discussions on the spacevariant form of the spatial and frequency-domain image processing operators to process space-variant images were presented in Section 5 Section 6
presents the space-variant form of classic vision algorithms (for example,
60
M. Yeasin and R. Sharma
optical flow on log-mapped image plane). The utility of the biologically
motivated sensors were discussed in Section 7 and finally, Section 8 concludes the chapter with few concluding remarks.
2.2 A Review of Retino-cortical Mapping Models
The visual system has the most complex neural circuitry of all sensory systems. The flow of visual information occurs in two stages [40]: first from
the retina to the mid-brain and thalamus, then from thalamus to the primary visual cortex. Although, the primate eye has components serving
functions similar to those of standard video cameras – the eye’s light
transduction component, the retina, differs greatly from its electronic counterpart. Primate visual field has both binocular and monocular zones. Light
from the binocular zone strikes the retina in both eyes, whereas light from
the monocular zone strikes the retina only in the eye on the same side. The
retina responds to the light intensities over a range of at least 5 orders of
magnitude which is much more then standard cameras. Structurally, the
retina is a three layer membrane constructed from six types of cells (for details please see [41]). The light transduction is performed at the photoreceptors level, and the retinal output signals are carried by the optic nerve
which consists of the ganglion cell axons. The ganglion cell signals are
connected to the first visual area of the cortex (V1) via an intermediary
body.
The investigation of the space-variant properties of the mammalian
retino-cortical mapping dates back to the early 1940s. In 1960s Daniel
et. al. [42] introduced the concept of cortical magnification factor c ,
measured in millimeters of cortex per degree of visual angle, in order to
characterize the transformation of visual data for retinal coordinates to
primary visual cortex. The magnification factor is not constant across the
retina, but rather varies as a function of eccentricity. Empirically, the cortical magnification factor has been found to be approximated by [43]
c
( )
C1
,
1 C2
(1)
where
is the retinal eccentricity measured in degrees, and C1 and C2
are experimentally determined constants related to the foveal magnification and the rate at which magnification falls off with the eccentricity, respectively. Integrating Equation (1) yields a relationship between the retinal eccentricity and cortical distance r
2 Foveated Vision Sensor and Image Processing – A Review
C1
d
1 C2
0
r( )
C1
log(1 C 2 ) .
C2
61
(2)
To obtain an understanding of the variable resolution mechanism involved in the retina-to-cortex data reduction, one needs to understand the
different aspects of the primate visual path ways (see [40] for details). Researchers from inter-disciplinary fields have been investigating this issue
for quite some time and Schwartz [43] has pointed out that the retinocortical mapping can be conveniently and concisely expressed as a conformal transformation11, i.e., the log(z) mapping. This evidence does not by
any means paint a complete picture about the processing and extent of data
reduction performed by the retina. Nevertheless, it lays the foundation for
the retino-cortical mapping models reviewed in this paper. Conceptually,
the log(z) retino-cortical model consists of considering the retina as a complex plane with the center of fovea corresponding to the origin and the visual cortex as another complex plane. Retinal positions are represented by a
complex variable z, and the cortical position, by a complex variable .
The correspondence between these two planes is dictated by the function
= log(z). The mapping model
= log(z), has a singularity at the origin i.e. at z = 0, which complicates the sensor fabrication.
To avoid the singularity at origin and to fabricate a physical sensor,
Sandini et. al. [27, 44, 45] have proposed a separate mapping models for
the fovea and the periphery. These mappings are given by equations (3)
and (4) for continuous and discrete case, respectively:
q ,
,
log a
(3)
1,...., N ang ,
1,....., N circ
(4)
0
q
j
log a
j
1
i
2
where ( , ) are the polar coordinates and ( , ) are the log-polar coordinates. In the above expressions 0 is the radius of the innermost circle,
1/q corresponds to the minimum angular resolution of the log-polar layout,
1
A conformal mapping is a function of complex variable which has the property of preserving relative
angles. Mathematically, a function
f (z ) , where
and
Z
are complex variables, is
conformal at the point Z if it is analytic at point z and its derivative at z is non-zero.
62
M. Yeasin and R. Sharma
and p, q and a are constants determined by the physical layout of the CCD
sensor that are related to the conventional Cartesian reference system by:
x
cos and y
sin . Though this method provides an easy way
to construct a physical sensor, the fovea-periphery discontinuity is a serious drawback. In addition, the mapping is not conformal over the range of
the sensor, which is an important factor in developing tools to process
space-variant images.
Alternatively, Schwartz [46] proposes a modified mapping,
log( z a ) and shows that by selecting an appropriate value for a (a
is real number in the range of 0.3 0.7 [47]), a better fit to retino topic
mapping data of monkeys and cats can be obtained [48]. As opposed to the
log(z ) model log( z 1) provides a single output image. With modified
mapping, the singularity problem, the need for uniform resolution patch in
the fovea and the fovea-periphery boundary problems, is eliminated. To
perform the mapping, the input image is divided into two half-planes along
the vertical mid-line. The mapping for the two hemi-fields can be concisely given by the equation
log( z ka) log(a ) ,
(5)
i is the correwhere z x iy is the retinal position and
sponding cortical point, while k sgn x
1 indicates left or right
hemisphere. The combined mapping is conformal within each half plane22.
In a strict mathematical sense, the properties of scale and rotation invariance are not present in the mapping. However, if | z | a ,
then log( z a ) log( z ) , and therefore, these properties hold. Also, since
the log( z a ) template has a slice missing in the middle, circles concentric with and rays through the foveal center do not map to straight lines. To
the best of our knowledge, no physical sensor exists which exactly mimics
this model, but there are emulated sensor that approximates this model
[24].
Another attempt to combine peripheral and foveal vision has been reported in [49] using specially designed lens. The lens characteristics are
principally represented by the projection curve expressed in Equation (6),
which maps the incident angle of a sight ray entering the camera to r( ),
the distance of the projected point on the image plane from the image center. This curve has been modeled in three distinct parts to provide wide and
2 Note that this is similar to the anatomy of the brain: The two sides of this mapping are in direct correspondence with the two hemispheres of the brain.
2 Foveated Vision Sensor and Image Processing – A Review
63
high resolution images: a standard projection in the fovea, a spherical one
in the periphery and a logarithmic one to do a smooth transition between
the two:
f1 tan ,
r( )
log a ( f 2 )
f3
0
p,
q,
1
,
1
2
2
(6)
max
where q, p and a are constants computed by solving continuity conditions
on zeroth and first order derivatives, f1, f2 and f3 are the respective focal
length (in pixels) of the three projections and 1, 2 and max are angular
bounds.
It combines a wide field of view of 120 degree with a very high angular
resolution of 20 pixels per degree in the fovea. Those properties were
achieved by carefully assembling concave and convex optics sharing the
same axis. Despite the complexity of its optical design, the physical implementation of the lens is very light and compact, and therefore suitable
for active camera movement such as saccade and pursuit.
2.3 Synergistic Benefits
There are a number of synergistic benefits which follows from a biologically motivated (i.e., complex log-mapping, log-polar, etc.) sensor. Like
the human eye, a foveated sensor does not require a high quality optics offaxis, as conventional cameras do, since peripheral pixels are in effect lowpass filters. The complex log-mapping also provides a smooth multiresolution architecture [47] which is in contrast with the truncated pyramid
architecture33 that is common in machine vision [17]. The scale and rotation invariant properties of the mapping simplifies the calculation of radial
optical flow of approaching objects, allowing the system to quickly calculate the time to impact. The selective data reduction is helpful in reducing
the computation time and is useful in many image analysis and computer
vision application.
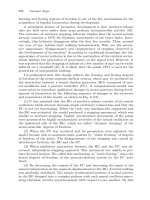
A mentioned earlier, retino-cortical mapping model provides a scale and
rotation invariant representation of an object. The scale and rotation invariance of the transformation is illustrated (see Fig 2.1) by mapping bars
of various size and orientation from standard Cartesian representation to a
3
The truncated pyramid architecture provides a data structure which is coarsely sampled version
of the image data.
64
M. Yeasin and R. Sharma
cortical representation. Figure 2.1 shows the results of the on center bars
and the off-center bars. Clearly, the mapping (cortical representation) produce results which is independent of the size and orientation of the bar. It
is important to note that the above properties hold if the rotation and scaling are centered about the origin of the complex-plane. This is due to the
fact that the inertial axis is not unique, and can be ambiguous. The scale
and rotation invariance property is of paramount importance and can be
used to improve form invariant shape/object recognition. Traditional
shape/object recognition schemes (i.e., template-matching and etc.) suffer
from the variance of the size and the orientation of an object. The retinotopic mapping model of the form-invariant shape recognition approach
may help in recognition of two-dimensional shapes independently from
their position on the visual field, spatial orientation, and distance from the
sensing device. The complex log-mapping has some favorable computational properties. It embodies a useful isomorphism between multiplication
in its domain and addition in its range. It has line-circle duality4, which
may be an interesting property for finding invariant features in the processing of space-variant images. For an image sensor having a pixel geometry
given by
log(z ) , image scaling is equivalent to radial shifting and
image rotation is equivalent to annular shifting. Let us assume that the image is scaled by some real amount S, which can be written as
ej
S . e j Applying the log-mapping one would obtain,
log(S . e j ) log S log
j .
Similarly, rotating the image by an angle
re j
re j ( ) . A log-mapping leads to a relation,
log(re j (
)
) log r
j(
).
(7)
can be written as
(8)
From equations (7) and (8) it is clear that scaling and rotation produces a
shift along the radial and the annular directions, respectively.
4
The log-mapping transforms lines and circles onto each other.
2 Foveated Vision Sensor and Image Processing – A Review
65
Fig. 2.1: Scale and rotation invariance properties of log-mapping: Log-polar mapping of (a) on-center bars and (b) off-center bars with various size and orientation.
Upper row corresponds to the Cartesian representation and the bottom row is corresponding cortical representation
To illustrate further, a geometrical interpretation of the above concepts
is shown in Fig.2.2. Consider a circle that is originating at the center of the
fovea (see Fig. 2.2(a)), maps on to a straight vertical line in the peripheral
grid (see Fig. 2.2(b)). An increase of the radius of the circle in the Figure
2.2(a) resulted in a shift in the Figure 2.2(b). Rotating a ray about the origin (see Fig. 2.2(c)) produces a shift as shown in Fig. 2.2(d). These properties of the log-mapping have been successfully utilized with regard to the
computations in a moving visual field [7]. These properties can also be exploited for the detection of general straight lines, line segments, and circles
through the foveation point.
While the use of the log-mapping greatly simplifies the rotation and
scale invariant image processing, it significantly complicates the image
translation (see Fig. 2.3). The vertical contours representing horizontal
translation in the input image Fig. 2.3(a) result curved contours in the logpolar image shown in Fig. 2.3(b). Similarly, Figs. 2.3(c) and 2.3(d) exemplify the effect of vertical translation. It is evident that spatial neighborhood structure in the spatial domain is broken by the space-variant properties of the sensor. Traditional image processing techniques do not hold
when applied directly to a space-variant image representation.
66
M. Yeasin and R. Sharma
Apart from the elegant mathematical properties, logarithmic mapping
greatly simplify several visual tasks. In [50, 51] it has been shown how the
mapping simplifies the computation of depth from motion for a moving
camera in a stationary world. Sandini et. al [52] demonstrated how the
scale and rotation invariant properties of the mapping simplifies the calculation of radial optical flow of approaching objects, allowing the system to
quickly calculate the time to impact. Centrifugal flow, which signals a
forward approach and hence a decrease in viewing distance, has recently
been shown to elicit increased convergence, while centripetal flow, which
signals the converse, elicits decreased convergence [53]. In [3] Capuro et.
al. proposed the use of space-variant sensing, as an alternative imaging geometry for robot vision systems. Interestingly enough the choice of this
geometry reduces the amount of visual information to be processed without constraining the visual field size, nor the resolution, and allow for more
simplified techniques. It has also been shown that logarithmic mapping, in
particular, log-polar representation provides a computationally efficient
way of encoding visual inputs with advantages for extracting correlations
between binocular images without the need to derive disparity explicitly
[3, 54]. In [5], it has been shown that applying correlation techniques on
log-polar images produce much better results than standard Cartesian images. It has been argued that the correlation between two log-polar images
corresponds to the correlation of Cartesian images weighted by the inverse
distance to the image center. Hence, the characteristic of the implicit
weighting function (dominance of the areas close to the image center) provides a measure of focus of attention. Space-variant sensors implicitly enhances objects that happen to lie close to the fixation point and through
this provides a pre-categorical, fast selection mechanism which requires no
additional computation [53].
In a recent study [54] by Sandini et. al. it has been suggested that a reciprocal interaction between biologists and computer vision scientists on a
common ground may highlight more synergies. For an example, in a recent
study on gaze stabilization mechanisms in primates that deal with the problems created by translational disturbances of the observer were introduced
in the context of robotic control. It was found that robots have benefited
from inertial sensors that encode the linear as well as angular accelerations
of the head just as the human occulomotor does.
2 Foveated Vision Sensor and Image Processing – A Review
67
Fig. 2.2: Duality of log-mapping: (a) and (c) shows retinal image (complex image
j
representation, i.e., z x jy re ) while (b) and (d) shows cortical images
(i.e., log-mapped images).Circles centered at the origin as shown in (a) maps onto
lines in (b). Rotating a ray about the origin of (c) results in a shift in (d)
Fig. 2.3: Translation properties of log-mapping: of similar image representation as
shown in Fig. 2.2. (a) horizontal translation, (b) the corresponding log-polar image, (c) and (d) shows similar images for vertical translation