Báo cáo y học: "Regional characterization of energy metabolism in the brain of normal and MPTP-intoxicated mice using new markers of glucose and phosphate transport" doc
Bạn đang xem bản rút gọn của tài liệu. Xem và tải ngay bản đầy đủ của tài liệu tại đây (1.49 MB, 9 trang )
RESEA R C H Open Access
Regional characterization of energy metabolism
in the brain of normal and MPTP-intoxicated
mice using new markers of glucose and
phosphate transport
Emmanuelle Lagrue
1,2,3†
, Hiroyuki Abe
4,5,6†
, Madakasira Lavanya
4,5,7
, Jawida Touhami
4,5
, Sylvie Bodard
1,2
,
Sylvie Chalon
1,2
, Jean-Luc Battini
4,5
, Marc Sitbon
4,5*
, Pierre Castelnau
1,2,3*
Abstract
The gibbon ape leukemia virus (GALV), the amphotropic murine leukemia virus (AMLV) and the human T-cell leuke-
mia virus (HTLV) are retroviruses that specifically bind nutrient transporters with their envelope glycoproteins (Env)
when entering host cells. Here, we used tagged ligands derived from GALV, AMLV, and HTLV Env to monitor the
distribution of their cognate receptors, the inorganic phosphate transporters PiT1 and PiT2, and the glucose trans-
porter GLUT1, respectively, in basal conditions and after acute energy deficiency. For this purpose, we monitored
changes in the distribution of PiT1, PiT2 and GLUT1 in the cerebellum, the frontal cortex, the corpus callosum, the
striatum and the substantia nigra (SN) of C57/BL6 mice after administration of 1-methyl-4-phenyl-1,2,3,6 tetr ahydro-
pyridinium (MPTP), a mitochon drial complex I inhibitor which induces neuronal degeneration in the striato-nigral
network.
The PiT1 ligand stained oligodendrocytes in the corpus callosum and showed a reticular pattern in the SN. The
PiT2 ligand stained particularly the cerebellar Purkinje cells, while GLUT1 labelling was mainly observed throughout
the cortex, basal ganglia and cerebellar gray matter. Interestingly, unlike GLU T1 and PiT2 distributions which did
not appear to be modified by MPTP intoxication, PiT1 immunostaining seemed to be more extended in the SN.
The plausible reasons for this change following acute energy stress are discussed.
These new ligands therefore constitute new metabolic markers which should help to unravel cellular adaptations
to a wide variety of normal and pathologic conditions and to determine the role of specific nutrient transporters in
tissue homeostasis.
Background
Energy stress appears to be a common and early patho-
genic pathway in several neurodegenerative diseases
occurring in childhood or adulthood [1]. Mitochondrion,
which is responsible for the adenosine triphosphate
(ATP) synthesis through the mitochondrial respiratory
chain (RC), plays a pivotal role when cells face energetic
failure. Among all cell types, neurons show a specific
vulnerability to energy stress as they display a high
energy demand and are large ly dependent on glucose.
Importance of such mitochondrial failure has been well
established in several neurodegenerative diseases in
adults, including stroke, Alzheimer’s disease, P arkinson’s
disease, Huntington’ s disease or amyotrophic lateral
sclerosis [2]. This has been also demonstrated in several
metabolic and degenerative encephalopathies in child-
hood, such as hypoxic-ischemic encephalopathy, iron
metabolism disorders, organic acidurias or mitochon-
drial diseases [3-7].
In order to investigate the patho physiological steps
which occur during cerebral mitochondrial distress, we
previously characterized a murine respiratory chain
* Correspondence: ;
† Contributed equally
1
UMR Inserm U 930, CNRS FRE 2448, Université François Rabelais de Tours,
F-37044 Tours, France
4
Institut de Génétique Moléculaire de Montpellier, CNRS UMR 5535, 1919
Route de Mende, Montpellier Cedex 5, F-34293 France
Full list of author information is available at the end of the article
Lagrue et al. Journal of Biomedical Science 2010, 17:91
/>© 2010 Lagrue et al; licensee BioMed Cen tral Ltd. This is an Open Access article distributed under the terms of the Creative Co mmons
Attribution License ( which permits unrestricted use, distribution, and reproduction in
any medium, provided the original work is properly cited.
deficiency model using 1-methyl-4-phenyl-1,2,3,6 tetra-
hydropyridinium (MPTP) [8,9]. Here, we studied the
regional distribution of the inorganic phosphate (Pi) and
glucose transporter in the brain of normal and MPTP-
intoxicated mice.
Pi and glucose represent key molecules in cellular
energy metabolism. The mitochondrion membrane pro-
tein ATP synthase depends on Pi supply for ATP synth-
esis and Pi biodisponibility is therefore criti cal in
cerebral homeostasis [ 10]. Recently, the validity of com-
mercial antibo dies directed against nutrient transporters
has been questioned [11]. Thus, assessing Pi metabolism
with ligands to the PiT1 and PiT2 high affinity transpor-
ters may b e a more reliable approach, although PiT1
and PiT2 might exhibit different cellula r functio ns [12].
Thus, PiT1 has been recently reported to be critical for
cell proliferation, a property apparently not shared by
PiT2 [13].
Several gamma and deltaretroviruses use nutrient
transporters as receptors for viral entry. Viral entry is
triggered after direct binding of the extracellular SU
component of retroviral envelope glycop roteins (Env) to
extracellular domains of the cognate transporters used
as receptors [14,15]. Binding is ensured by the amino-
terminal receptor bind ing domain (RBD) of the Env SU.
Based on this phenomenon, we derived immunoadhesins
from several retroviral RBD to serve as new extracellular
ligands for the detection and the study of transporters
of interest. We previously reported an HTLV Env RBD-
based immunoadhesin (HRBD) that serves as a uniquely
useful extracellular ligand of the glucose transporter 1
(GLUT1) [16,17]. Subsequently, HRBD has been largely
reported to be a reliable extracellular ligand for the eva-
luation of GLUT1 surface distribution and intracellular
trafficking in various tissues [11,18,19]. Similarly, an
immuno adhesin that binds the sodium-dependent phos-
phate symporter PiT2 has been derived from the RBD
of the amphotropic MLV (AMLV) [20,16] . Since the
gibbon ape leukemia virus (GALV) uses PiT1, the other
sodium-dependent phosphate symporter as receptor for
viral entry, we derived a new extracellular ligand f or
PiT1 based on the GALV RBD [21,22].
Here, we took advantage of these transporter ligands
as new metabolic markers, to monitor the distribution
of GLUT1, PiT1 and PiT2 in several regions of normal
and MPTP-intoxicated mice brain in order to de termine
whether the energy stress secondary to an acute mito-
chondrial dysfunction can modify the tissue distribution
of theses key nutrient transporters.
Methods
Fusion proteins generation
We previously described HRBD, the HTLV Env RBD-
derived ligand that binds the extracellular loop 6 on
GLUT1 [16,15]. AmphoΔSU, an MLV Env-derived PiT2
ligand that comprises the aminoterminal 379 residues of
the amphotropic murine leukemia virus Env SU fused at
the carboxyterminus with rabbit IgG Fc tag(rFc) has
been previously reported [20,16]. We now describe a
PiT1-binding immunoadhesin generated by f using the
aminoterminal residues of the GALV (SEATO strain)
Env, comprising the signal peptide, the RBD and
the proline-rich region, to the rFc tag, herein, referred
to as GRBD.
HRBD, AmphoΔSU and GRBD tagged ligands, and
control conditioned medium were produced by trans-
fecting 293T cells with the appropriate constructs or
with th e empty control vector using the calcium phos-
phate method [16]. After transfection, the culture med-
ium was replaced with fresh medium without fetal
bovine serum (FBS). Media containing the various
soluble RBDs were harvested 2 days later and clarified
by filtration (0.45 μm) to remove cell debris. The supe r-
natants were concentrated 12-fold using an iCon
concentrator 20 ml/9K spin column (Thermo Fischer
Scientific, Rockford, USA). Conditioned media were fro-
zen at -20°C until further use. Concentrated superna-
tants were clarified by centrifugation at 2300 g for 10
minutes at 4°C before use.
Animals
All experiments were p erformed on consanguineous
male C57/BL6N@Rj mice (5 weeks old, average weight:
19 ± 1 g (CERJ, Le Genest St Isle, France)) with 6 mice
per group. All experiments were carried out in compli-
ance with appropriate European Community Commis-
sion directive guidelines (86/609/EEC). Mice were kept
under environmentally controlled conditions (room
temperature (RT) = 23 ± 1°C, humidity = 40.3 ± 7.1%)
on a 12-hour light/dark cycle with food and water
ad libitum.
MPTP intoxication
Mice (6 animals per group) were intoxicated with 4
administrations of MPTP (12.5 mg/kg) intraperitonealy
(ip) at 1-hour intervals on a single day. MPTP (Sigma,
France) was dissolved in 0.9% sodium chloride to a final
concentration of 2.5 mg/ml (100 μL injection per 20 g
body weig ht). Control mice (6 per g roup) were injected
4 times ip with saline. Through s uch regimen, MPTP
induces a loss of approximately 70% of the dopaminer-
gic neurons from the substantia nigra (SN) at day 7
after MPTP intoxication, with a combination of both
necrosis and apoptosis [23]. This acute intoxication pro-
vides a validated and reliable model of energy stress
which we monitor through tyrosine hydroxylase immu-
noreactivity and dopamine transporter density measur-
ment as previously described [8,9].
Lagrue et al. Journal of Biomedical Science 2010, 17:91
/>Page 2 of 9
Immunofluorescence assays
Cryosections were generated from mice sacrificed by
cervical dislocation 7 days after MPTP intoxication. Five
areas of interest were studied : the cerebellum, the fron-
tal cortex, the corpus callosum (CC), the striatum and
theSN.Mousebrainswererapidlyremovedandfrozen
in isopentane (-35°C). Twenty-μm coronal sections pre-
pared with a cryostat microtome (Reichert-Jung Cryocut
CM3000 Leica Microsystems, Rueil-Malmaison, France)
were collected on Super Frost Plus slides (Menzel Glä-
ser, Braunschweig, Germany) and stored at -80°C. After
fixation with 100% ethanol at room temperature, the
sections were blocked with normal goat serum and
endogenous biotin blocking reagent (Biotin blocking sys-
tem, Dako, Via Real, CA, USA) prior to the incubation
with either HRBD (ligand for GLUT1), GRBD (ligand
for PiT1) or AmphoΔSU (ligand for PiT2). Several fixa-
tion protocols including 4% paraformaldehyde have
been evaluated. 100% ethanol fixation was the most
satisfying. Sections were incubated with the af oremen-
tioned probes for 30 minutes at 37°C. 10% FBS was
added to the probes as carrier. The sections were
further incubated with biotinylated anti-rabbit IgG (dilu-
tion 1/200) (Vectastain Elite kit, Vector Laboratories,
Burlingame, CA, USA) for 1 h at RT, followed by incu-
bation with Streptavidine-Alexa 488 (10 μg/ml) 30 min-
utes at RT, Hoechst 33342 (1 μM) (labelling for cell
nucleus) and CellTrace BODIPY TR methyl ester (5 μg/
ml) (labelling for intracellular membranes) (Invitrogen,
Carlsbad, CA, USA) 10 minutes at RT. Negative controls
were used for each reactive.
Acquisition and restoration of the images
Brain sections were scanned with an Axio Imager Z1
upright microscope (Zeiss, Le Pecq, France). The excita-
tion/emission filter sets specific for each of the fluores-
cent an tibodies were as follows: <365 nm excitation filter
and 420-470 nm emission filter for Hoechst (nucleus),
425-475 nm excitation filter and 485-535 nm emission
filter for Alexa 488, 530-585 nm excitation filter and 615-
∞ nm emission filter for CellTrace BODIPY (intracellular
membranes). Image scans for each probe were acquired
in seven z -series at a step-size of 3 μm w ith a specimen
magnification of 100×. Deconvolution was performed
through Huygens profession al software (Scientific
Volume Imaging, Hilversum, The Netherlands) with 0%
background offset in order to avoid artificially decreased
sig nals. Each plane of the individual z-se ries image stuck
was overlaid into a three-dimensional end product. Then,
two-dimensional projections were prepared by Maximum
Intensity Projectio n on Image J so ftware with the same
display ranges for each emission in all the images. Precise
measurements suc h as cell counts or staining qua ntita-
tion were not collected for this study.
Results
Animals
All the animals survived during the observation
period. The MPTP-induced transient weight loss
observed at day 4 as expected did not cause significant
differences in body weight between n ormal and intoxi-
cated animals.
Regional GLUT1, PiT1 and PiT2 distribution in the brain of
normal mice
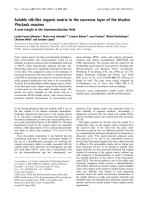
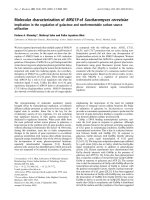
Cortex staining: GLUT1 staining was heterogeneous
from layer I to IV: layer I exhibited a low cellular den-
sity and all the neuronal cells in this layer were appar-
ently stained. Layer II/III displayed a higher cellular
density compared to layer I with general cytoplasm
staining. However, the staining in tensity was different
from one cell to another. Representative microphoto-
graphs of GLUT1 immunostaining in the cortex o f nor-
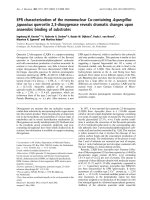
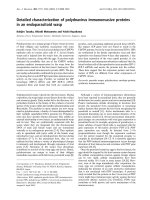
mal mice are shown in Figure 1A-C . PiT2 label ling gave
a diffe rent pattern: the staining was detected in layer I
to IV and was exclusively peripheral with a “rosette like”
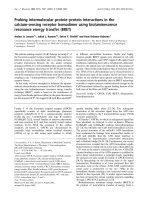
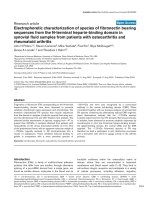
aspect (Figure 2A). As for PiT1, staining in the cortex
varied from layer I to IV with stained neurons predomi-
nantly detected in layer II/III. These neurons were med-
ium-sized with a homogeneous cytoplasmic staining
(Figure 3A).
Corpus callosum staining: A few GLUT1-labelled cells
were seen (Figure 1D) with a weak staining compared
visually to the cortex and striatum. No PiT2 staining
was observed (not shown). Perivascu lar cells were mark-
edly labelled with the GLUT1 and PiT2 ligands. PiT1
staining exhibi ted a linear pattern with few stained cells
following the myelinated fiber bundles corres ponding to
oligodendrocytes (Figure 3B).
Basal ganglia staining: In the striatum, GLUT1 label-
ling appeared rather weak and homogeneously diffuse
(Figure 1E). PiT1 labelling was also weak and detected
only in a few cellular bodies (4-5 cells in each striatum)
(data not shown). PiT2 staining was distinct, with a
“rosette like” pattern similar to that observed in the cor-
tex in addition to t he diffuse staining throughout the
striatum (Figure 2B). Noteworthy, the white matter
tracts were not stained with any of the three markers. In
the Substantia Nigra: no distinct binding of the GLUT1
ligand was detected, with the structure rather presenting
a diffuse staining (data not shown). PiT1, on the other
hand, showed a reticular pattern with several stained
cellular bodies (Figure 3C). PiT2 staining was compar-
able to the ones observed in the cortex and the striatum
with a “rosette like” aspect (Figure 2C). As observed
within the CC, the cerebral pe duncle, corresponding to
white matter, did not show any G LUT1 or PiT2 stain-
ing, whereas several oligodendrocytes were detected by
PiT1 staining.
Lagrue et al. Journal of Biomedical Science 2010, 17:91
/>Page 3 of 9
Cerebellum staini ng: the granular layer was irregularly
labelled with all three probes, whereas the molecular
layer was homogeneously labelled for PiT1 and PiT2
and i rregularly labelled for GLUT1. The Purkinje cells
were irregularly labelled for GLUT1 (Figure 1F), PiT1
and PiT2 (Figure 2D).
Regional GLUT1, PiT1 and PiT2 distribution in the brain of
MPTP-intoxicated mice
No noticeable change was observed in PiT1, PiT2 and
GLUT1 distribution in the cortex, the CC, the striatum
and the cerebellum after MPTP administration (data not
shown).
In the SN pars reticulata, GLUT1 and PiT2 staining
were unchanged in comparison to normal m ice brain.
Conversely, the PiT1 distribution pattern in the SN was
modified after MPTP administration: The cell density
and st aining did not appear to be altered but the reticu-
lar pattern, observed in normal mice brain, was not any-
more detected due to a labelling of the white-matter
fiber tracts apparently recruited and newly stained,
including the cerebral peduncle (Figure 3D).
Discussion
Here, we took advantage of new retroviral Env-derived
markers for nutrient transporters to detect directly and
for the first time the regional distribution of glucose and
phosphate transporters in mouse brain during e nergy
stress. MPTP was used to i nduce such aggression
through an acute respiratory chain deficiency.
Regional GLUT1 distribution in basal conditions
With HRBD, the GLUT1 ligand, we observed a st aining
of GLUT1 in the corpus callosum and the basal ganglia
apparently weaker than in the c erebellum and in the
cortex.
These results were reproducible in all animals and
are in accordance with the literature: the detection of
GLUT1 by immunoblotting performed in rats has pre-
viously shown that GLUT1 is expressed in all brain
regions but in less abundance in the striatum, the tha-
lamus and the brainstem [24]. In mice, only blood ves-
selswerefoundtobeimmunostainedusingan
antibody raised against the C-t erminal part o f the pro-
tein [25,26]. Cell surface antibodies directed against
metabolite transporters are rare because of high inter-
species homology and low immunogenicity of the
external loops. Our metabolic markers, all interact
with extracellular determinants of the multimembrane-
spanning transporter molecules. It must be specified
that our markers are independent from N-glycosylation
variations and that our GLUT1 ligand, HRBD, does not
A
C
Layer I
Layer
II / III
B
D
F
CC
E
Cortex
CC
St i t
GL
St
r
i
a
t
um
ML
Figure 1 GLUT1 immunostaining in normal mice. Cortex immunostaining: cells within layers I to IV exhibit a cytoplasmic staining. The
staining is presented as follows: A: Alexa 488 signals (green) for GLUT1. The arrow indicates an example of stained cell; B: Hoecsht signals (blue)
for the nuclear counterstaining; C: Alexa 488 signals (green) and Hoechst signals (blue) are merged; D: Corpus callosum (CC) staining: a few
stained oligodendrocytes are seen (arrow). (Alexa 488 signal and Hoechst signals merged); E: Striatum staining: GLUT1 staining appears
homogeneous and weak with few cellular bodies stained. The white-matter tracts are not labeled for GLUT1. (Alexa 488 signal and Hoechst
signals merged); F: Cerebellum staining: The granular layer (GL) and the molecular layer (ML) are irregularly labelled for GLUT1, whereas the
molecular layer is homogeneously labelled for PiT1 and PiT2. (Alexa 488 signal and Hoechst signals merged). Scale bar: 100 μm.
Lagrue et al. Journal of Biomedical Science 2010, 17:91
/>Page 4 of 9
cross-react with GLUT3 or other GLUT isoforms
[16,15]. However, we cannot formerly exclude that a
lack of labeling may not be due to the absence of cell
surface expression of the transporter but merely to a
cell surface environment than hinde rs ligand binding.
Thus, it has previously been shown that a general inhi-
bition of cell glycosylation by tunicamycin a llowed
receptorrecognitionandinfectiondrivenbyanMLV
envelope [27]. W hether, a lack of staining may come
from an absence of receptor/transporter or an altered
accessibility remains to be determined. In any case,
lack of staining reflects major c hanges in the transpor-
ter environment and in the case of GLUT1, such
changes have been shown to have a major impact on
GLUT1 transporter functions [19].
Regional PiT distribution in basal conditions
To our knowledge, t his is the first time that the regio-
nal distribution of PiT1 and Pi T2 were monitored i n
normal mouse brain through immunofluorescence
methods. We observed that, although both PiT1 and
PiT2 have been described as inorganic phosphate
transporters, they show distinctive distributio n pat-
terns. Cells appearing to be oligodendrocytes were
labelled with PiT1 but not PiT2. In the SN, PiT1
showed various stained cellular bodies with a reticular
pattern suggesting a sparing of white-matter bundles,
whereas the PiT2 staining pattern was comparable to
the one observed in the cortex and the striatum with a
“ rosette like” aspect. Hence, our results represent a
regional study which needs to be further explored at
A B
GL
CD
ML
GL
CPSNpr
GL
Figure 2 PiT2 immunostaining in normal mice. A: PiT2 immunostaining in t he cortex of a normal mouse. In this representative image, the
staining is detected in all cortical layers, with a “rosette like” aspect. The arrow indicates a characteristic stained neuron displayed in the
enlarged inset (magnification x300). B: PiT2 immunostaining in the striatum of a normal mouse. Some PiT2-stained cells carry a “rosette like”
pattern similar to that observed in the cortex (arrow and enlarged inset, magnification x300). Noteworthy, the white matter tracts are not stained
(shown within dotted circles). C: PiT2 immunostaining in the substantia nigra (SN) of a normal mouse. PiT2 staining pattern in SN is comparable
to the patterns observed in the cortex and the striatum with a “rosette like” aspect. The cerebral peduncle (white matter) does not show any
PiT2 staining. The arrow points at a characteristic stained nigral cell as shown in the inset (magnification x300). D: PiT2 immunostaining in the
cerebellum of a normal mouse. Purkinje cells are labelled with the PiT2 specific probe (arrow). Alexa 488 signals for PiT2 (green) and Hoechst
signals for the nuclear counterstaining (blue) are merged. CP: cerebral peduncle, SNpr: substantia nigra pars reticulata, ML: molecular layer, GL:
granular layer. Scale bar: 100 μm.
Lagrue et al. Journal of Biomedical Science 2010, 17:91
/>Page 5 of 9
the cellular level. The differential distribution pattern
for PiT1 and PiT2 might reflect a difference in cellular
functions between PiT1 and PiT2. This issue has been
recently highlighted when PiT1, unlike PiT2, was
reported to be critical for cell proliferation, indepen-
dently of their common phosphate transport activity
[13]. Recently, Festing et al generated the first condi-
tional and null PiT1 allele mouse and observed that
the hemizygous PiT1 knock-out is lethal. Since the
expression of PiT2 gene was not modulated in the
affected tissues in compensatory ways, these authors
conclude that PiT1 carries an essential and non redun-
dant role in embryonic development [28]. Altogether,
these data might suggest various regulations of the
different inorganic phosphate transporters which are
likely to indicate unique functional roles for each one.
Regional GLUT1 distribution after energy stress
We subsequently studied the changes of PiT1, PiT2
and GLUT1 distribution after MPTP i ntoxication. As
MPTP specifically induces a basal ganglia degeneration
[23,9], we focused on GLUT1 changes in these struc-
tures. We observed that under a basal energy state,
there was a homogeneous GLUT1 distribution in the
striatum and the SN that remained identical after
MPTP intoxication. However, GLUT1 is known to be
down-regulated by mitochondrial inhibitors in some
animal cultured cell lines [29]. Such an apparent
B
Layer I
A
Layer
II/III
CC
CC
CD
CP
CP
SNpr SNpr
Figure 3 PiT1 immunostaining in normal and MPTP-intoxicated mice. A: PiT1 staining in the cortex of control mice; stained neurons are
mostly detected in layer II/III. These neurons are medium-sized with homogeneous cytoplasmic staining. B: PiT1 immunostaining in the corpus
callosum (CC) of normal mice: PiT1 labelling exhibits a linear pattern with few stained cells following the myelinated fiber bundles corresponding
to oligodendrocytes (arrows). C: PiT1 immunostaining in the SN of normal mice with a reticular pattern due to a relative sparing of white-matter
(arrows). D: PiT1 immunolabelling in MPTP intoxicated mice where an apparent extension of staining can be seen in the white-matter bundles in
the substantia nigra pars reticulata (SNpr) and in the cerebral peduncle (CP). The staining is presented as follows: A to D, staining with Alexa 488
(green, PiT1 ligand) and A and B, signals are merged with Hoechst (blue, counterstaining for nuclei). Scale bar: 100 μm.
Lagrue et al. Journal of Biomedical Science 2010, 17:91
/>Page 6 of 9
discrepancy may be related to the sensit ivity of our
technique which may not allow the study of limited
variations in discrete areas such as the SN pars com-
pacta. Alternatively, it is also plausible that in order to
change GLUT1 transporter expression in the SN, the
energy stress should be more prolonged or pronounced
than in the acute intoxication which we tested. To
evaluate the consequences of a prolonged energy
insult, a chronic MPTP regimen should be used [23].
Regional PiT distribution after energy stress
We observed that PiT1 tissue distribution was modified
andappearedtobemoreextendedintheSNafter
MPTP intoxica tion. Several hypotheses may be raised to
explain the exact significance of such observation:
The fact that we observed P iT1 redistribution in all
the intoxicated animals and in no other area we moni-
tored except t he SN, where MPTP toxicity specifically
tak es place, supported the validity and specificity of our
observation. Also, the fact that the white-matter bundles
seemed to be recruited specifically at two different sites
also strongly argued in favor of specific labelling that
reflects de novo expression of this transporter in pre-
cisely delineated structures, namely the SN and the cere-
bral peduncles, where PiT1 normally appears to be
quiescent. Phosphate homeostasis is necessary for ATP
production through the mitochondrial RC . Interestingly,
the enzyme responsible for ATP synthesis, ATP
synthase (or complex V), is associated with the p hos-
phate carrier (PIC), which transport Pi, and t he adenine
dinucleotide carrier (ANC), which transport ADP, in a
large protein complex called ATP synthasome [30-32].
The A TP synthase then comb ines ADP and Pi to form
ATP. Therefore, an increase in the cytosolic Pi content
is likely to promote ATP synthesis and, thereby, coun-
teract energy deficiency and a subsequent cellular
degeneration. The apparent extension of PiT1 expres-
sion in the SN could translate a neuroprotective adapta-
tion to increase ATP synthesis where MPTP deprives
neurons from their energy supplies. Although difficult
to perform in mice brain, a specific measurement of the
complex V activity in the SN would provide important
information to support such hypothesis. Moreover, since
PiT1 has been shown to be critical for cell proliferation
[33], an upregulation of PiT1 might indicate an att empt
to promote cell survival and rescue, especially in the
white matter where a compensatory sprouting from the
dopaminergic nigral projections to ward the striatum,
has been largely described in immediate response to
MPTP toxicity [23,8].
Conversely, one could postulate that such modification
in PiT1 pattern of distribution participates to the
sequence of lesions in the SN and rather traduces
MPTP toxicity. Indeed, PIC is a key component of the
mitochondrial permeability transition pore [34]. The
apparent extension o f PiT1 distribution could generate
detrimental changes in PIC regulation and, thereby, in
the ATP synthasome homeostasis. An alteration in the
formation of this huge protein complex could release
PIC molecules and, subsequently, enhance mitochon-
drial transition po re opening which involve ment in
MPTP toxicity has been shown to participate to a com-
bination of necrotic and apoptotic cell death [23]. Con-
sistently, a direct effect of MPTP on PiT1 expression
cannot be also excluded at present.
Unlike for PiT1, the PiT2 distribution was not modi-
fied after MPTP intoxication. This would be consistent
with the fact that a differential regulation of Pi transpor-
ters takes place in the brain, in basal but also pathologic
conditions [13].
A natural neuroprotective reaction occurring in the
SN after M PTP intoxication is also conceivable, but this
would need to be confirmed by studies at the cellular
level including kinetic studies to further determine the
regulation of the inorganic phosphate transporters in
the brain.
In conclusion, our data suggest that these new meta-
bolic markers can be used to improve our understan ding
of the metabolism in the brain, as well as in others organs
such as the heart, the liver or kidne ys. In addition, t hese
new ligands could help a better understanding of the role
of their cognate transporters. It is also important to note
that these transporters are multifunctional proteins:
Hence, GLUT1 also transports the oxidized form of
ascorbic acid, dehydroascorbic acid (DHA), in mammals
which are unable to synthesize vitamin C [ 19,35]. PiT,
alternatively, can transport zinc in the bacteria E. Coli
[36]. Interestingly, vitamin C and zinc support major
pathophysiological pathways: vitamin C is an endogenous
antioxidant [37] and zinc is the cofactor of more than
300 enzymes. High levels of labile zinc accumulate in
degener ating neurons after br ain injury, such as ischemic
stroke, trauma, seizure and hypoglycaemia [38]. Excessive
levels of free ionic zinc can initiate DNA damage and the
subsequent activation of poly(ADP-ribose) polymerase 1
(PARP-1), which in turn leads to NAD+ a nd ATP deple-
tion when DNA damage is extensive [39]. Zinc also mod-
ulates hippocampic neurogenesis [40]. Since these
nutrient transporters are involv ed in various pathways of
neurodegeneration/neurogenesis, their study might,
therefore, provide additional insights in the natural
mechanisms of cellular defence and l ead, thereby, to the
conception of new neuroprotection strategies.
Acknowledgements
The authors are indebted to M-C. Furon for technical assistance on animal
experiments. The authors thank Julien Cau, Olivier Miquel and Pierre Travo at
the RIO Imaging facility in Montpellier for their precious help. HA was
Lagrue et al. Journal of Biomedical Science 2010, 17:91
/>Page 7 of 9
supported by a post-doctoral fellowship from ARC (Association pour la
Recherche contre le Cancer) and ML by successive fellowships from AFM
(Association Française pour les Myopathies) and ARC (Association pour la
Recherche sur le Cancer). MS was supported by a Contrat d’Interface
INSERM-CHU. Part of this work has been funded by ARC (Association pour la
Recherche sur le Cancer) and Fondation de France.
Author details
1
UMR Inserm U 930, CNRS FRE 2448, Université François Rabelais de Tours,
F-37044 Tours, France.
2
Université François Rabelais de Tours, F-37044 Tours,
France.
3
Unité de Neuropédiatrie et Centre de compétence Maladies
mitochondriales, Pôle Enfant, Hôpital Clocheville, CHRU de Tours, F-37044
Tours, France.
4
Institut de Génétique Moléculaire de Montpellier, CNRS UMR
5535, 1919 Route de Mende, Montpellier Cedex 5, F-34293 France.
5
Université de Montpellier 1 et 2, Place Eugène Bataillon, Montpellier, 34293
France.
6
Department of Anatomy, Teikyo University School of Medicine, 2-
11-1 Kaga, Itabashi-ku, Tokyo 173-8605, JAPAN.
7
Department of Microbiology,
University of Pennsylvania, Philadelphia, PA 19104-6142, USA.
Authors’ contributions
EL and HA: carried out the immunofluorescence assays and drafted the
manuscript; JLB and MS: conceived the envelope-derived tagged ligands
while; JLB, HA, ML and JT: generated, optimized and produced these ligands;
SB: participated to the animal experiments; SC: participated to the initiation
of the study; MS and PC: conceived the study, organized the experimental
schedule and conducted the manuscript writing. All authors have read and
approved the final version of the manuscript.
Competing interests
The authors declare that they have no competing interests.
Received: 6 July 2010 Accepted: 4 December 2010
Published: 4 December 2010
References
1. Mandemakers W, Morais VA, De Strooper B: A cell biological perspective
on mitochondrial dysfunction in Parkinson disease and other
neurodegenerative diseases. J Cell Sci 2007, 120:1707-1716.
2. Mattson MP, Gleichmann M, Cheng A: Mitochondria in neuroplasticity and
neurological disorders. Neuron 2008, 60:748-766.
3. Blomgren K, Hagberg H: Free radicals, mitochondriaand hypoxia-ischemia
in the developing brain. Free Radic Biol Med 2006, 40:388-397.
4. Hartig MB, Hörtnagel K, Garavaglia B, Zorzi G, Kmiec T, Klopstock T,
Rostasy K, Svetel M, Kostic VS, Schuelke M, Botz E, Weindl A, Novakovic I,
Nardocci N, Prokisch H, Meitinger T: Genotypic and phenotypic spectrum
of PANK2 mutations in patients with neurodegeneration with brain iron
accumulation. Ann Neurol 2006, 59:248-256.
5. Okun JG, Hörster F, Farkas LM, Feyh P, Hinz A, Sauer S, Hoffmann GF,
Unsicker K, Mayatepek E, Kölker S: Neurodegeneration in methylmalonic
aciduria involves inhibition of complex II and the tricarboxylic acid
cycleand synergistically acting excitotoxicity. J Biol Chem 2004,
277:14674-14680.
6. Di Filippo M, Picconi B, Costa C, Bagetta V, Tantucci M, Parnetti L,
Calabresi P: Pathways of neurodegeneration and experimental models of
basal ganglia disorders: downstream effects of mitochondrial inhibition.
Eur J Pharmacol 2006, 545:65-72.
7. Byrne E: Does mitochondrial respiratory chain dysfunction have a role in
common neurodegenerative disorders? J Clin Neurosci 2002, 9:497-501.
8. Lagrue E, Abert B, Nadal L, Tabone L, Bodard S, Medja F, Lombes A,
Chalon S, Castelnau P: MPTP intoxication in mice: a useful model of
Leigh syndrome to study mitochondrial diseases in childhood. Metab
Brain Dis 2009, 24:321-335.
9. Lagrue E, Chalon S, Bodard S, Saliba E, Gressens P, Castelnau P: Lamotrigine
is neuroprotective in the energy deficiency model of MPTP intoxicated
mice. Pediatr Res 2007, 62:14-19.
10. Berg J: Chapter 18: Oxidative Phosphorylation. In Biochemistry. 6 edition.
Edited by: Berg J, Timoczko J, Stryer L. New-York: WH Freeman; 2006.
11. Kinet S, Swainson L, Lavanya M, Mongellaz C, Montel-Hagen A, Craveiro M,
Manel N, Battini JL, Sitbon M, Taylor N: Isolated receptor binding domains
of HTLV-1 and HTLV-2 envelopes bind GLUT1 on activated CD4+ and
CD8+ T cells. Retrovirology 2007, 4:31.
12. Virkki LV, Biber J, Murer H, Forster IC: Phosphate transporters: a tale of two
solute carrier families. Am J Physiol Renal Physiol 2007, 293:F643-F654.
13. Beck L, Leroy C, Salaun C, Margall-Ducos G, Desdouets C, Friedlander G:
Identification of a novel function of PiT1 critical for cell proliferation and
independent from its phosphate transport activity. J Biol Chem 2009,
284:31363-74.
14. Overbaugh J, Miller AD, Eiden MV: Receptors and entry cofactors for
retroviruses include single and multiple transmembrane-spanning
proteins as well as newly described glycophosphatidylinositol-anchored
and secreted proteins. Microbiol Mol Biol Rev 2001, 65
:371-389.
15. Manel N, Battini JL, Taylor N, Sitbon M: HTLV-1 tropism and envelope
receptor. Oncogene 2005, 24:6016-6025.
16. Manel N, Kim FJ, Kinet S, Taylor N, Sitbon M, Battini JL: The ubiquitous
glucose transporter GLUT1 is a receptor for HTLV. Cell 2003, 115:449-459.
17. Kim FJ, Manel N, Garrido EN, Valle C, Sitbon M, Battini JL: HTLV-1 and -2
envelope SU subdomains and critical determinants in receptor binding.
Retrovirology 2004, 1:41.
18. Swainson L, Kinet S, Manel N, Battini JL, Sitbon M, Taylor N: Glucose
transporter 1 expression identifies a population of cycling CD4+ CD8+
human thymocytes with high CXCR4-induced chemotaxis. Proc Natl Acad
Sci USA 2005, 102:12867-12872.
19. Blanc L, Boyer-Clavel M, Jacquet C, Vidal M, Sitbon M, Taylor N: The GLUT1
and Glut4 glucose transporters are differentially expressed during
perinatal and postnatal erythropoiesis. Blood 2008, 112:4729-4738.
20. Battini JL, Heard JM, Danos O: Receptor choice determinants in the
envelope glycoproteins of amphotropic, xenotropicand polytropic
murine leukaemia viruses. J Virol 1992, 66:1468-1475.
21. Kavanaugh MP, Miller DG, Zhang W, Law W, Kozak SL, Kabat D, Miller AD:
Cell-surface receptors for gibbon ape leukemia virus and amphotropic
murine retrovirus are inducible sodium-dependent phosphate
symporters. Proc Natl Acad Sci USA 1994, 91:7071-7075.
22. O’Hara B, Johann SV, Klinger HP, Blair DG, Rubinson H, Dunn KJ, Sass P,
Vitek SM, Robins T: Characterization of a human gene conferring
sensitivity to infection by gibbon ape leukemia virus. Cell Growth Differ
1990, 1:119-127.
23. Jackson-Lewis V, Przedborski S: Protocol for the MPTP mouse model of
Parkinson’s disease. Nat Protoc 2007, 2:141-151.
24. Brant AM, Jess TJ, Milligan G, Brown CM, Gould GW: Immunological
analysis of glucose transporters expressed in different regions of the rat
brain and central nervous system. Biochem Biophys Res Commun 1993,
192:1297-1302.
25. Urabe T, Hattori N, Nagamatsu S, Sawa H, Mizuno Y: Expression of glucose
transporters in rat brain following transient focal ischemic injury. J
Neurochem 1996, 67:265-271.
26. Choeiri C, Staines W, Messier C: Immunohistochemical localization and
quantification of glucose transporters in the mouse brain. Neuroscience
2002, 111:19-34.
27. Wilson CA, Eiden MV: Viral and cellular factors governing hamster cell
infection by murine and gibbon ape leukemia viruses. J Virol 1991,
65:5975-5982.
28. Festing MH, Speer MY, Yang HY, Giachelli CM: Generation of mouse
conditional and null alleles of the type III sodium-dependent phosphate
cotransporter PiT-1. Genesis 2009, 47:858-863.
29. Ebert BL, Firth JD, Ratcliffe PJ: Hypoxia and mitochondrial inhibitors
regulate expression of glucose transporter-1 via distinct Cis-acting
sequences. J Biol Chem 1995, 270:29083-29089.
30. Ko YH, Delannoy M, Hullihen J, Chiu W, Pedersen PL: Mitochondrial ATP
synthasome. Cristae-enriched membranes and a multiwell detergent
screening assay yield dispersed single complexes containing the ATP
synthase and carriers for Pi and ADP/ATP. J Biol Chem 2003,
278:12305-12309.
31. Chen C, Ko Y, Delannoy M, Ludtke SJ, Chiu W, Pedersen PL: Mitochondrial
ATP synthasome: three-dimensional structure by electron microscopy of
the ATP synthase in complex formation with carriers for Pi and ADP/
ATP. J Biol Chem 2004, 279:31761-31768.
32. Pedersen PL: Transport ATPases into the year 2008: a brief overview
related to types, structures, functions and roles in health and disease. J
Bioenerg Biomembr 2007, 39:349-55.
33. Edinger AL: Controlling cell growth and survival through regulated
nutrient transporter expression. Biochem J 2007, 406 :1-12.
Lagrue et al. Journal of Biomedical Science 2010, 17:91
/>Page 8 of 9
34. Leung AW, Halestrap AP: Recent progress in elucidating the molecular
mechanism of the mitochondrial permeability transition pore. Biochim
Biophys Acta 2008, 1777:946-952.
35. Montel-Hagen A, Sitbon M, Taylor N: Erythroid glucose transporters. Curr
Opin Hematol 2009, 16:165-172.
36. Beard SJ, Hashim R, Wu G, Binet MR, Hughes MN, Poole RK: Evidence for
the transport of zinc(II) ions via the PiT inorganic phosphate transport
system in Escherichia coli. FEMS Microbiol Lett 2000, 184:231-235.
37. Rodrigo R, Guichard C, Charles R: Clinical pharmacology and therapeutic
use of antioxidant vitamins. Fundam Clin Pharmacol 2007, 21:111-27.
38. Lee JY, Son HJ, Choi JH, Cho E, Kim J, Chung SJ, Hwang O, Koh JY:
Cytosolic labile zinc accumulation in degenerating dopaminergic
neurons of mouse brain after MPTP treatment. Brain Res 2009,
1286:208-214.
39. Suh SW, Won SJ, Hamby AM, Yoo BH, Fan Y, Sheline CT, Tamano H,
Takeda A, Liu J: Decreased brain zinc availability reduces hippocampal
neurogenesis in mice and rats. J Cereb Blood Flow Metab 2009,
29:1579-1588.
40. Suh SW, Aoyama K, Alano CCanderson CM, Hamby AM, Swanson RA: Zinc
inhibits astrocyte glutamate uptake by activation of poly(ADP-ribose)
polymerase-1. Mol Med 2007, 13:344-349.
doi:10.1186/1423-0127-17-91
Cite this article as: Lagrue et al.: Regional characterization of energy
metabolism in the brain of normal and MPTP-intoxicated mice using
new markers of glucose and phosphate transport. Journal of Biomedical
Science 2010 17:91.
Submit your next manuscript to BioMed Central
and take full advantage of:
• Convenient online submission
• Thorough peer review
• No space constraints or color figure charges
• Immediate publication on acceptance
• Inclusion in PubMed, CAS, Scopus and Google Scholar
• Research which is freely available for redistribution
Submit your manuscript at
www.biomedcentral.com/submit
Lagrue et al. Journal of Biomedical Science 2010, 17:91
/>Page 9 of 9