BUY, SELL, OR HOLD: MANAGE YOUR PORTFOLIO FOR MAXIMUM GAIN phần 7 pot
Bạn đang xem bản rút gọn của tài liệu. Xem và tải ngay bản đầy đủ của tài liệu tại đây (803.5 KB, 26 trang )
ONE ASPECT OF PRICE HISTORY
139
Week
Price
58
48
46
44
42
56
54
52
50
40
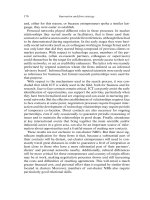
FIGURE 7.1 Chart pattern with breakout.
Week
Price
58
48
46
44
42
56
54
52
50
40
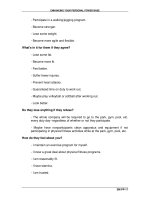
FIGURE 7.2 Chart pattern without breakout.
In this case, the trading range is established over the entire period on a
gradually increasing basis, with a 26-week low of 49 and a high of 56. Note that
the 26-week trading range in both of these examples is between 49 and 56; how-
ever, the significance of that trading range is quite different given the two pat-
terns and in the fact that one example had a breakout pattern while the other
showed a trading range that was moving over time. These recent histories are
significantly different than one another. Such comparisons can take place on
the down side as well, with breakout going down in price or with a trading
range that is declining over time.
The point worth making here is as follows: Volatility by itself does not always
tell the whole story. Merely comparing one stock to another in terms of price
volatility is not going to reveal a valuable conclusion until you also compare the
actual price changes, patterns, and current status.
Using this information to predict future price changes—the usual reason why
charts are used to analyze stock prices—is a troubling idea for several reasons:
1. Price is a short-term indicator. The recent price history of a stock is not
a reliable indicator for long-term growth prospects. While the study of
price over many years might indicate the long-term trend in a stock’s
price, the immediate price study is far from reliable. Price is not only a
technical indicator not directly related to the fundamentals, but it can be
deceptive, as well. Many companies with exceptional long-term growth
prospects are likely at various times to go through a one- to two-year
price slump. In such cases, their short-term price trend and recent his-
tory will appear dismal. In such times, these stocks might also be more
volatile than usual; that does not mean that the long-term fundamentals
have changed. In fact, price studies can distort and mislead if the funda-
mentals are not followed as well. Short-term price trends are
not a reflec-
tion of fundamental change. They might point the way to further
fundamental study; however, depending on price trends and changes in
volatility alone is a purely technical approach and should serve only as a
starting point for more study.
2. The recent past does not necessarily show how the future will look. The
chronic problem for chartists is that most people realize the unreliability
of the technique itself. The chartist spends a great deal of energy point-
ing to past price patterns to make the case that certain events (such as
price breakout, head and shoulders patterns, or trading price gaps) pre-
dict immediate price changes. In practice, though, predicting what is
about to happen proves far more elusive than demonstrating what hap-
pened in the immediate past. The price trends that chartists offer, even
if accurate, would refer only to the immediate future; in other words, the
next few days or even weeks at best. These trends do little to indicate
long-term growth prospects, because price trends as studied today and
140
VOLATILITY AND ITS MANY MEANINGS
yesterday reveal nothing about those long-term trends. So, the long-term
investor who believes in the fundamentals needs to recognize the tech-
nical nature of price trends and accept them as only short-term in
nature.
3. Forecasting of price is different than forecasting in business. One of the
flaws in stock market analysis is the attempt to equate price forecasting
with business forecasting. The stock market is dominated by businesspeo-
ple who understand the nature of forecasting and budgeting on the cor-
porate level. It is a science used to monitor trends in business and to spot
emerging changes that require corrective action. It is a science because
good forecasting is based on studies of marketing trends and on those
markets themselves. In comparison, forecasting of price in the market
cannot be based on the fundamentals because price does not reflect the
month-to-month changes in sales and profits. It cannot, because those
results are not available every week or month. So, price changes are a
factor of supply and demand, meaning that the auction marketplace
affects stock prices. These forces cannot be predicted in the same way
that a marketing department can predict sales levels based on customer
base activity. The desire to approach price in the same manner as busi-
ness forecasting can blind investors to the realities of price and price
trends: They are truly random, at least in the short term.
The long-term benefit of owning shares in a company should be based on
strong fundamentals rather than on short-term price trends. The approach of
buying stock when the price is at a 52-week high or low is a hit-or-miss method,
because that price trend really reveals nothing about the fundamentals or
about where that price is going to move next. The value of a volatility study is
found in what it reveals about the company itself. It is interesting to observe
that two similar corporations will have vastly different price volatility; this
observation can be used to further study the fundamentals with the premise
that the market is efficient—even with its short-term, random nature. The effi-
ciency of the market relates to the idea that investors will trade in a different
pattern when the fundamentals change. So, if there is a higher-than-average
level of uncertainty about a company’s immediate future, its trading pattern is
likely to be more volatile as well. So, with changes in management, acquisi-
tions, expansion into new sectors, and changes in earnings predictions, stock
prices will react in the short term. If two seemingly identical companies have
varying levels of volatility, there will be reasons why.
In this respect, price volatility can serve as a symptom of other problems or
advantages. Because uncertainly might cause higher-than-average volatility,
potential good news might cause high volatility. It is not only the negative.
There is a tendency to view high volatility as a sign of problems, because volatil-
ity translates to greater price risk. The other side of that reality, however, is
ONE ASPECT OF PRICE HISTORY
141
that there also might exist a higher level of profit opportunity. So, if a company
is branching out into new product areas, bringing in a more aggressive man-
agement team, investing capital in the development of new products, and tak-
ing other bold steps, the possibility of price volatility will accompany these
changes. If the new moves are successful, value rises and so does price; how-
ever, if these investments fail, the opposite will also be true. So, changes in
volatility have to be studied in terms of how the fundamentals are changing;
what kinds of long-term risk those changes represent; and whether or not you
want to own shares in the company, accepting the risk as the cost of the oppor-
tunity it also presents.
A widespread point of view about volatility is that a volatile stock price his-
tory is a sign of instability, thus a greater risk for investors. In the earlier exam-
ple, however, where a company is investing in expansion moves, the volatility
could represent change of a positive nature that ultimately will benefit share-
holders. The market, though, does not like unpredictability and change; it
wants predictability, which is why it thrives on analysts’ reports. Even though
those reports might be wrong, investment decisions are made in anticipation of
outcomes. The emphasis on PE ratio (which reflects perception about poten-
tial growth in the future) and volatility (which defines relative short-term price
stability) makes this point. While the fundamentals serve as the basis for iden-
tifying viable long-term investments, the real market
interest is going to be
found trying to anticipate what will happen tomorrow and next month.
So, volatility often reflects investor apprehension rather than actual evi-
dence. A company expanding in intelligent ways, into secure markets and with
properly planned investment levels, presents a promise of future growth and
should encourage long-term investors to buy and accumulate holdings; how-
ever, those same changes might cause higher volatility because change itself—
whether positive or negative—worries the market. The market, by definition,
is more prone to worry than to study. The short-term price trends described in
terms of volatility can mean many different things, and changes in volatility
should lead not to immediate conclusions but to further analysis.
Translating the Raw Material
The actual raw material developed from the typical study of volatility can be
used to lead to more studies as well as conclusions about price stability.
Remember, a stable price—meaning a narrow trading range—makes for a
“safe” investment in terms of price risk but could also represent little or no
market opportunity. So, you need to understand not only how volatile a stock’s
price is today, but also what that means in terms of potential for future growth.
This knowledge requires further analysis of the fundamentals.
The volatility conclusions drawn from financial reports involve studying the
52-week high and low range of a stock. The idea here is that the broader the
142
VOLATILITY AND ITS MANY MEANINGS
trading range, the more volatile the stock. If volatility is the same as “risk,”
however, then the analysis of the trading range can mislead the analyst unless
the study is taken further. Because business expansion means going into areas
of uncertainty, accompanied by business risk, it is likely that a growing com-
pany will also experience a volatile price history. That growth is exactly what
investors want, however. So, the instability in price reflects the desirable
growth activity. In fact, a volatile stock price can be caused by any number of
fundamental factors (some positive and some negative).
A positive fundamental activity usually involves expansion, investing capital in
new sectors, the introduction of new products or services, and other forms of risk-
taking. This period of expansion can also be accompanied by net operating losses
and instability in sales, even though the long-term outcome will reward stockhold-
ers. Investors with a long-term view understand that the expansion process is likely
to be a rocky one, and only the inexperienced, nervous investor will sell off shares
just because short-term price is more volatile this year than the year before.
In a simplistic approach to investing, the concept of volatility is seen as a
negative. Not liking price risk, investors will tend to sell off shares at the begin-
ning of expansion periods. The same investors are likely to reinvest capital in
shares of companies whose expansion has peaked because their price risk is
low. That is to say, the volatility level is low and price is relatively stable. This
situation also means, of course, that the potential for long-term profit has
passed and performance of that stock might be consistent but mediocre.
The typical calculation of volatility does not take these important variables
into account; it only uses high and low prices over the past year. This flawed
form of analysis is comparable to averaging only the highest and lowest ele-
ments in a field and calling that
typical. No statistician would call that fair or
accurate; yet, in the stock market, that is exactly how volatility is computed
and compared.
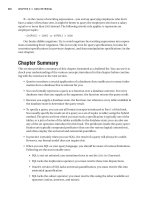
The formula for price volatility is shown in Figure 7.3.
TRANSLATING THE RAW MATERIAL
143
= v
h – l
l
h
= 52-week high price
l
= 52-week low price
v
= Volatility (percentage)
FIGURE 7.3 Volatility.
Volatility is expressed as a percentage by using this formula. It is a popular
measurement of stock prices because it is easy to compute, and it makes side-
to-side comparisons easy. An example of the calculation: A stock’s high price
during the past 52 weeks was $47 per share, and its low price was $34. Volatility
is calculated as such:
$47 – $34
= 38%
$34
If this outcome were being compared to other stocks, it would be easy to con-
clude that a stock with a volatility of only 19 percent would be half as volatile,
thus half as risky, as this one and that a stock with a volatility of 76 percent
would be twice as risky.
The problem, though, is that this formula is far from accurate. In previous
examples, a trading range was described in terms of volatility; and two differ-
ent stocks with identical trading ranges were shown to be vastly different in
their price characteristics. The trading range taken at face value might lead to
some conclusions, but it does not necessarily mean the same thing in every
case. Some further examples follow to make the point that the mere study of
volatility cannot be taken as a reliable indicator.
Example: A stock begins the year with a price of $47 per share and has declined
gradually so that the current price is at the 52-week low of $34 per share.
Example: The stock began the year at $34 per share and has traded consis-
tently between $34 and $38 with one exception: a spike in price up to $47 on a
rumor that the company was going to be taken over, which proved to be false.
Example: The stock normally trades between $40 and $47, but its main prod-
uct recently was pulled from the market after several class-action suits were
filed. Profits have evaporated, and analysts’ predictions are very pessimistic.
During the past week, the stock fell to a new low of $34 per share.
Example: The company has been expanding aggressively by acquiring smaller
competitors and most recently acquired a company in a different sector, diver-
sifying its product base. Sales are up, and predictions are that profits will reach
all-time high levels as well. The stock began the year at $34 per share and has
risen steadily, ending the year at $47.
Each of these examples demonstrates that volatility, by itself, does not tell
the story underlying the market price trend. In all of these examples, volatility
is 38 percent—but that obviously means different things based on different
price patterns. The causes of those price changes, even if based solely on mar-
ket perception, cannot be used to decide what is going on in the company or
even whether volatility and price patterns are positive or negative. Given the
fact that price, as a short-term technical indicator, is likely to change due to
immediate perceptions, volatility in price does not help you to pick good stocks
for long-term investments or even for short-term gain. For example, if the mar-
ket were to fall several hundred points, it is also likely that many stocks whose
144
VOLATILITY AND ITS MANY MEANINGS
trading range is usually quite narrow would experience a sharp price decline as
well. If the overall market levels recovered within the following week, individ-
ual stock prices would also be likely to return to previous levels.
Perhaps the greatest flaw in the volatility formula is its failure to exclude
price spikes. The fact that it is based on the rather primitive method of the two
extremes of high and low price makes it far from scientific, and it should not
be treated as conclusive. Anyone who reviews the daily stock listings, however,
finds the 52-week high and low prices, making trading range quite visible with-
out explanation. An alternative would be to calculate price volatility by using a
moving average for closing prices, at least at the end of each week. While this
method also can be distorted if the end of the week is untypical, the moving
average at least offers the advantage of evening out the distortions. Even so, it
remains a problem that volatility can mean several different things. So, even
with the more accurate moving average method, you still need to look at the
trading pattern for the year to discover not only the range of trading, but also
the trend itself.
Interpreting the Patterns
Given the fact that trading range is simply listed along with the rest of the stock
listings each day, it is easy to make a series of assumptions about a stock—
none of which are reliable given the potential for variation in trading patterns.
Some investors like to compare the current price of a stock with its trading
range. Some of the following conclusions could be reached easily. For example,
The stock is trading near its one-year high:
It is a good time to buy shares because the stock is showing an upward
trend.
It is a good time to hold and take no action; wait to see how the trend
moves.
Sell shares now. The stock’s price has peaked, so you want to get out at the
top.
The stock is trading in the middle of its one-year range:
This is a stable company and a safe investment.
The stock is not moving and should be dumped.
The stock is trading at the low end of its one-year range:
The stock is at a bargain price and should be bought now.
The stock is exhibiting a downward trend and should be sold.
Obviously, any of these conclusions could be right or wrong. It is impossible
to actually make an intelligent conclusion based on high and low price in com-
parison with current price; yet, this method of judging stocks is common and
popular. It is not only unreliable, however, but it also contradicts the tenets of
fundamental analysis in that it completely ignores the financial facts. Price is
INTERPRETING THE PATTERNS
145
a technical indicator and cannot be used as a sole method for picking stocks.
In fact, the high and low price as well as current price are all short-term in
nature and are collectively unreliable. Even those who use the volatility statis-
tics to pick stocks need to look closely at the trading patterns to discover what
they mean before making decisions in the market.
In analyzing the trading pattern of a stock, study more than a single 52-week
period. Look for the long-term price history of a stock. Examine trading pat-
terns, recognizing that long-term growth is typified by a trading range gradu-
ally moving upward over time. When a price breakout occurs—the movement
in price above resistance or below support—what does it mean? It might be
worth investigating the underlying causes of breakout, notably for companies
whose stocks have demonstrated consistency in trading range over many years.
Breakout often is caused by market overreaction to news or rumor, perhaps
relating to new products, pending litigation, government anti-trust actions,
unexpected earnings reports or outcomes, mergers and acquisitions, changes
in management, insider trading, and many other fundamental events. The real
test of breakout is not the event itself (in spite of what chartists claim) but the
subsequent price activity.
A breakout based on rumors that prove to be false would typically be
resolved by a return to the previous trading range. In this case, the breakout
should be ignored and discounted entirely. It is nothing more than a distortion,
and the astute chartist would know that the
typical trading range is far more
revealing that an aberration caused by unfounded rumor.
A breakout followed by the establishment of a new trading range is far more
significant, even to the fundamental analyst. This breakout usually is based on
significant news changing the fundamentals of the company. For example,
when the subject company merges with another and the new concern has a
broader product and customer base, sales and profits will be expected to
reflect the stronger new company. Thus, with more growth potential and a
diversified market share, the trading range might re-establish itself at a higher
level. On the down side, a company that is forced to stop selling its most prof-
itable product following a class-action lawsuit or a negative action by a regula-
tory agency can be expected to lose sales and profits. A breakout on the down
side could be permanent in this case, requiring the company to consolidate its
remaining products and change its marketing strategy—which could take
months or even years.
So, breakout by itself cannot conclusively reveal a change in the price pat-
tern—despite what chartists insist to the contrary. You need to examine the
underlying causes for sudden market reaction that leads to a surge above resis-
tance or a drop below support. The chartists are correct in their belief that
long-established support and resistance (even if gradually changing over time)
are important “lines in the sand” and that a violation of those levels is a signif-
icant event. The significance is questionable in some cases, however.
146
VOLATILITY AND ITS MANY MEANINGS
One point of view about breakout is that a strongly capitalized and well-
established company should see gradual growth over many years with low
volatility. Thus, even the unexpected rumor about that company should not
cause a breakout. This area might be a valid starting point for understanding
price risk and for defining what low volatility should mean. Even so, what does
it mean when a breakout occurs and almost immediately retreats? Is that a test
of support or resistance, as some chartists claim? Is it a sign foretelling sudden
price movement in the opposite direction? Or, rather than assuming that price
movement has significance just in its pattern, is it necessary to try to under-
stand the causes for market reaction? It often is the case that the price change
is the result of short-term worry (on the down side) or euphoria (on the up
side), which are temporary and extreme. In cases of more serious problems and
permanent changes in the fundamentals, breakout is the predictable result of
the underlying problem. In the majority of such cases, investors were aware
of the potential problem (thus, market risk) well in advance of the conclusion.
So, the breakout should not have come as a surprise.
For example, it should not have surprised investors when Amazon.com expe-
rienced a sudden and extreme drop in market price. It had never shown a
profit, after all, so the market price was based on market perceptions only and
eventually had to correct. On a more fundamental level, investors with shares
of Microsoft knew for many months that the federal government would try to
prove the company was a monopoly and break it up; the lawsuit was not a sur-
prise, although the initial outcome and subsequent reversals might have been.
In both of these cases, investors who were not willing to be exposed to the mar-
ket risks involved should have sold shares and sought companies whose market
risks were less extreme.
In many cases of price breakout, investors should not have been surprised.
A permanent breakout usually can be traced back to well-known and well-
publicized causes. When breakout follows surprises, such as earnings reports
that are inconsistent with analysts’ predictions or a company’s own predictions
of a slower-than-average year, the tendency is for price to return to previous
levels once the news has been absorbed. This process could take only a few
trading periods or many months; the point is that real surprises in the market
tend to be short-term in nature. Most fundamentals are well known in advance,
and investors who want to study the facts can discover them easily.
Price Volatility as a Technical Indicator
The study of price—in fact, the emphasis on price trends in the market—
should itself be highly suspect. Does price volatility reveal anything of value? Is
recent price history an indicator that you can use, or is it misleading?
The price of a stock is invariably a starting point, especially for inexperi-
enced investors. It is only a means for measuring the overall value of capital,
PRICE VOLATILITY AS A TECHNICAL INDICATOR
147
however. If a company has one million outstanding shares at $10 per share or
500,000 shares at $20 per share, the total capital value has not changed. Even
so, investors tend to view a $10 and a $20 stock in different ways. Some preju-
dice about price levels is inevitable, but they are worth examining and resist-
ing.
Many investors who start out with limited capital want to buy 100 shares, so
they are forced to look only at stocks at or below their capital level. If they have
$2,500, they need to look for stocks at or below $25 per share. So, they might
develop the opinion that high-priced stocks are too expensive. In reality, every-
one knows that the price per share is not a reflection of actual value; it is really
a reflection of a corporate decision to issue a particular number of shares with
the initial price a consequence of that decision. Subsequent changes in market
price are the result of investor supply and demand plus stock split decisions
and issuance of new shares—not to mention the effect of mergers where stock
is traded between companies and market values change rather suddenly.
Even given all of these facts, investors tend to depend heavily on price his-
tory and to view stock price levels with some conclusions that make little sense.
For example, consider the case of a stock that is trading today at $50 per share.
An investor might avoid buying shares of that stock because he or she can
remember when it was selling at about $70 per share only a few years ago. In
the interim, however, the stock might have split two for one so that the $70
stock became a $35 stock with twice as many shares and the market value then
rose to $50 per share—a significant increase in value that is easily misread by
investors.
Price history, even when adjusted for splits or mergers, cannot predict likely
future price changes. A company with strong fundamentals, a diversified cus-
tomer base, and smart management that knows how to create growth remains
a viable long-term investment prospect; however, the current and recent price
history for that company’s stock might not reflect these characteristics in any
manner. Some long-term growth prospects reveal a rather mundane price
movement over the past year, just as some very questionable long-term invest-
ments might exhibit an impressive history of price increase (as was seen with
many stocks in the dot.com phenomenon), which can be subsequently
adjusted.
Investors who depend too much on short-term price trends, notably on the
typical calculation of volatility, are likely to make mistakes in the timing of
their decisions to buy, sell, or hold shares of stock. Price alone cannot be used
for such decisions, but sadly it often is the sole determinant in those important
decisions. Investors are easily misled so that they make their decisions based
on short-term and unreliable technical indicators while continuing to believe
that they are investing based on analysis of the fundamentals.
Most investors recognize that volatility is a technical indicator. The mistake
is not in relying upon it too heavily, however, but in misapplying the very
148
VOLATILITY AND ITS MANY MEANINGS
concept that it represents. A study and comparison of volatility, as we have
demonstrated, is unreliable if limited to trading range and current price alone.
The statistical flaws involved in limiting a study only to the highest and lowest
levels—without defining what those levels mean in fundamental terms—
should cause investors to avoid comparisons of volatility between companies.
Rather, the real key to using volatility is to first identify the trading pattern and
look for surprises and then follow those indicators to the fundamentals and
search for the actual causes. If a breakout pattern is temporary, it can be
largely ignored. Even though a company with historically low price risk should
not experience rumor-based breakouts, it does occur. The breakout that does
not last is far less interesting than the one that leads to the establishment of a
new trading range, whether higher or lower than its prior range.
If you follow the fundamentals for the corporation, then you probably
already know the causes of such breakouts. Permanent changes in trading
range for stable companies are invariably the result of predictable change that
anyone paying attention would have been able to anticipate. The market risk
involved with litigation, labor relations, government oversight, product regula-
tion, mergers, and changes in management (to name a new of the potential fac-
tors) define the nature of change, and such market risks ultimately become
reflected in price and volatility. Thus, market risk can be said to lead price risk
in the respect that the well-known market factors defining the level of long-
term growth potential have both opportunity and risk and that those factors
will show up in price risk, as well.
To the extent that volatility points to a level of investor confidence, you
should examine what that actually means. Are you confident in the company’s
long-term growth prospects? If so, then short-term price volatility can be
largely ignored except to the extent that it signals a change in the fundamen-
tals. A lot of emphasis, perhaps too much, is placed on the idea of confidence
in a company when the real price volatility could be caused by decisions made
by institutional investors. When a mutual fund decides to invest in shares of a
company or begins selling shares that it held previously, that itself can change
the supply and demand temporarily. Does this situation mean the confidence
of the market has changed as well? The widespread belief is in the market as a
singular entity. It either has confidence in a company and its stock or it does
not. The mood of the market is singular in its direction under this belief sys-
tem, but in practice the market is a collection of many conflicting beliefs, risk
tolerance levels, and philosophies about investing. So, the idea of confidence
probably is overrated—especially for those who want to invest based on the
fundamentals. Confidence is related to price strength in the immediate future
and is a speculative term at best.
The exception for the fundamental investor is when volatility signals a sig-
nificance change in market or capital strength or other financially-based fac-
tors that change long-term growth prospects. Some of these elements are not
PRICE VOLATILITY AS A TECHNICAL INDICATOR
149
clearly visible in financial reports, so changes in volatility—notably breakouts
of a significant level—could foretell changes in the fundamentals that could
change everything. In these cases, price volatility foretells the announcement
of the change in the numbers instead of the other way around. In such cases,
you need to study the fundamentals to find the underlying causes and take
action, if necessary, to protect your portfolio. If a buy or hold indication should
change to a sell decision, then the study of volatility can be a useful way to get
an early sign of bigger changes to come. This situation is usually seen in a
broadening volatility, which reflects investor uncertainty or insecurity about
the fundamentals. The tendency to recognize such instability often takes place
too late to do anything about it, because that volatility means a lower current
market price. The trick is to recognize the causes that are going to lead to that
uncertainty before the market reflects the problem in lower prices.
Volatility in Earnings
To identify emerging problems in price stability—in other words, price volatil-
ity—a study of sales and earnings trends can be most useful. For example, a
stock whose price has been within a narrow trading range might begin to
expand its range. This situation occurs whenever price begins moving upward
or downward; change is disruptive to a nice, narrow trading range; and even
good news (expanded earnings, for example) is likely to create greater price
volatility.
Price stability by itself is not a desirable attribute for a stock. By definition, a
stable price range also means that the value of that company is not growing. The
price remains within a narrow trading range until growth begins, and then the
range needs to expand. Ultimately, stockholders are rewarded when the stock’s
price range increases, so an expanded trading range and greater volatility are
going to act as symptoms of growth. Of course, the same arguments apply to the
opposite direction. When a stock’s price is falling, it is equally volatile but for dif-
ferent reasons. The fact that rising and falling price ranges might exhibit the
same kind of volatility points out the flaw in traditional price-only volatility study.
Because rising and falling prices are caused by vastly different fundamental
causes, any unexpected changes in volatility should act as a signal to investigate
further. The questions are complex. Volatility is not a simple matter in spite of the
fact that when isolated to price and trading range, the typical comparative study
is simplistic. In fact, identifying the underlying causes of volatility requires con-
siderable analysis of the fundamentals. Even though short-term price changes
reflect an uncertain market that overreacts to virtually all news, significant
changes in volatility can have a more permanent meaning.
Fallacy: Volatility is easy to understand; it is nothing more than the history of
recent price change.
150
VOLATILITY AND ITS MANY MEANINGS
In reality, changing volatility can mean many different things. Even when
prices are moving in the same direction for two or more different companies, it
is not enough to limit your study to the relative volatility between a particular
stock and other stocks with similar characteristics. Volatility should be studied
on a company-by-company basis, including historical information and current,
new information.
As long as volatility is limited to a study of price during the past year, it will
always be of limited value. It is far more meaningful to review price history over
a span of many years. From this study, you can identify price patterns, whether
or not there has been growth, and if so, to what degree. Within the multiple-
year pattern, you will also identify whether price trends tend to occur within a
narrow band of trading or with broader swings in price (the pattern of price
change). Whether stock values are rising or falling can be thought of as a
reflection of historical market perception about the company. You should ask,
however, “Why do some stocks trade in a broad range while others trade in
much more narrow ranges?” In some cases, companies that appear identical in
other respects have much different trading patterns.
The answer contradicts the commonly held fallacy that volatility is easy to
understand. In fact, it is not simply the history of recent price range in a stock.
Of far greater significance (and value in your analysis), volatility is a symptom
of the fundamental attributes of a company. The fallacy should be replaced
with a different statement: Volatility is, in fact, a reflection of the market’s con-
fidence in the fundamentals of the corporation.
In comparing corporations that have certain similarities—the same sector, sim-
ilar capitalization structure, approximately the same sales levels—you will find
that price volatility might be far different, even given those similarities. Why? The
answer, again, is that the market tends to be confident in a reliable forecast and
tends to be nervous about less-certain fundamentals. So, when a particular com-
pany experiences sales and profits that grow steadily from year to year, whose prof-
its are consistent and whose dividends are paid regularly, the market as a whole
takes that as a sign of stability in every respect—and this confidence is reflected
in lower-than-average volatility. This situation is true even when growth is occur-
ring. The average market price might rise, but trading continues to take place in a
fairly narrow range with that range gradually increasing over time.
In comparison, when a company’s fundamentals are less reliable, the market
tends to have less trust in its long-term prospects, and that also is reflected in
the degree of price volatility. Some companies exhibit wide swings in the fun-
damentals. Sales are likely to be widely different from one year to the next, and
unusually high profit years might be followed by unusually high losses. When
the fundamentals are so volatile from year to year, you are likely to see a cor-
responding volatility in the price.
This tendency can be called
fundamental volatility because it is far more
important in your analysis than any price volatility. Given the fact that price in
VOLATILITY IN EARNINGS
151
the short term is not a reliable indicator of future investment value, it should be
abandoned as a primary indicator. Its only real value is as a starting point that
should lead to an examination of the fundamentals. So, when a stock’s price
volatility changes suddenly, it is a smart idea to discover why. Price changes can
lead to other information and cannot be ignored altogether. As the means for
making actual decisions to buy, sell, or hold, however, price volatility is unreli-
able. If only because short-term price change can be caused by so many contra-
dictory root causes, it cannot be taken seriously as an analytical tool; but to use
an automotive analogy, price volatility can serve as a red light on your investment
dashboard telling you to look under the hood and check the fluids.
Recent price volatility, because it is limited to the short term, reveals noth-
ing in and of itself about fundamental value. The two major market philoso-
phies—the Dow Theory and the random walk hypothesis—agree on that
singular point because it is so obvious. In virtually every financial paper, how-
ever, stock listings include the 52-week high and low price range, which is a
summary of volatility in its simple but popular form. Remember the important
flaw in popular analytical methods: They are popular because they are simple
and easy to understand. It often is also the case that those same forms of anal-
ysis are misleading and inaccurate, however. Price volatility is a good example.
The 52 weeks in the reported range are short term by nature. In addition,
because those 52 weeks go backward from each reporting day, you have no way
to identify what occurred in price in the 53
rd
week before. You also have no way
to track the reported period in terms of the company’s fiscal cycle or market
cycle. The timing of the 52 weeks is rigid, whereas the cyclical considerations
could change the entire picture. With these limitations in mind, the real test of
volatility should always go back to sales and earnings. The past year’s price his-
tory tells you nothing about fundamental value, and in fact it can give you mis-
leading information and steer you in the wrong direction.
The market as a whole likes predictability. So, a company whose growth pat-
tern is slow and steady will also have lower volatility in its price history (either
short-term or long-term). The real value in a study of price history (meaning
several years and not just the past 52 weeks) is in how that price relates to fun-
damental predictability. As long as a company’s sales rise steadily over time
and the profit yield on sales is consistent, stockholders take great comfort in
that growth pattern. Far more exciting but less predictable is the company
whose numbers jump upward and downward all over the board. How can you
forecast the growth prospects for such a company, however? Of course, it is
impossible based on the unreliable history itself. When sales and profits (or
losses) change drastically from one year to another, you have absolutely no
basis for forecasting future growth patterns. Fundamentals are likely to be
more complex than price, which is why price volatility is popular and widely
accepted. Fundamental volatility is the real test of a company’s long-term
investment value, however.
152
VOLATILITY AND ITS MANY MEANINGS
One problem in a study of the fundamentals is identifying the reliability of
current growth patterns. Will these continue into the future, or are they going
to level off? Of course, all trends will level off eventually. Nothing rises or falls
forever, and it is statistically likely that any trend that is going on today will
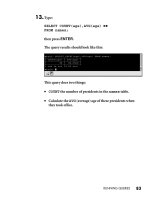
reduce its rate of change over time. Figure 7.4 provides a simplified view of this
tendency.
Note that while this trend is sharply upward, it gradually tapers off. Two
things occur in this situation. First, the rate of change slows down, as seen in
the illustration; this process is the topping-off or leveling effect. Second, the
actual range of change (in the case of stock prices, the trading range) tends to
narrow as well. So, in terms of price volatility, the trend would show up as a low-
ering of price volatility over the long term. This process is called “moving
toward the mean” in statistics—a reference to the tendency for trends to aver-
age out over time.
This tendency has great significance when applied to fundamental analysis.
In spite of what many investors and analysts would like to believe, growth is not
unlimited. The characteristics of growth change over time, and growth itself is
subject to a few statistical rules. These include the following:
1. The rate of change levels off and declines over time. As shown in the
illustration, rates of change tend to reduce as time passes. So, an impres-
sive growth rate in a new corporation has to be expected to slow down as
time passes for a number of reasons. First, impressive growth rates from a
small base are fairly easy to achieve; and with a larger base, duplicating
the experience becomes increasingly difficult. With this knowledge in
mind, investors should not expect growth rates to remain consistent over
time. For most believers in the fundamentals, a steady rate of change
VOLATILITY IN EARNINGS
153
FIGURE 7.4 The leveling out of trends.
over time is adequate, because realistically, investors know about this
tendency and they accept it. We are not saying that you will always want
to keep your capital invested with one company; you might wish to sell
when the leveling off in growth begins to occur and seek out the new
emerging-growth candidate.
2. The degree of change becomes increasingly unlikely as a company
expands its size. One of the problems with expansion, especially if it
takes place rapidly, is that the experience itself might inhibit the corpo-
ration’s capability to repeat its past record. It seems frequently in the
market that yesterday’s rising star falls out of favor because the numbers
level off. So, sales rates are called disappointing even though the slow-
down in growth is predictable. And profits, even when consistent and
strong, are no longer expanding at past rates. It is a reality, though, that
with growth, the rates and degrees of change are going to change.
Consider a company that can reasonably expect to generate an additional
$1 million in sales each year. Because growth is measured based on past
sales, what is the rate of change as sales expand?
BASE CHANGE CHANGE
$10 million $1 million 10.0%
$11 million $1 million $9.1%
$12 million $1 million $8.3%
This gradual reduction in the percentage of change, because it is based
on ever-growing sales levels of the past year, has to fall over time. This
situation does not mean the company is failing to capture new market
share; however, it often is reported by Wall Street analysts that sales
rates are falling as the company grows. The percentage of growth
declines from one year to another, which appears as a negative at first
glance. In fact, the dollar value shows that the company is picking up $1
million in new sales every year, which is not a negative at all. There is a
flaw in the popular methods of reporting, because it is not realistic to
expect that a growing company will be capable of duplicating its
rate of
sales expansion exponentially from one year to another. It should be
enough that growth continues, and a troubling sign would be falling or
stagnant sales—especially if profits were falling as well.
3. Trends in a given direction change in a predictable manner but with
unpredictable timing. What makes analysis truly interesting is that
change itself is predictable, and change from positive to negative is cycli-
cal. The timing of change is far more elusive, however. We know, for
example, that corporations experience market cycles and today’s strong
numbers will be weak at some point in the future. Some cycles have
highly predictable cycles, but others experience uncertain timing in their
154
VOLATILITY AND ITS MANY MEANINGS
cyclical change. So, statistically speaking, you have to expect good times
as well as bad times for any industry and for any corporation. Knowing
precisely when such changes will occur is a different matter. So, analysis
depends upon spotting emerging trends before everyone else knows about
them and making fast decisions when new information has been discov-
ered.
The importance of recognizing how trends actually work over time points to
the advantage of studying fundamental volatility rather than concentrating
only on price. It is true that changes in long-term price patterns can serve as
symptoms of more subtle changes in the fundamentals. To that extent, watch-
ing price trends is valuable. It is really fundamental volatility, however, that
defines a company’s growth prospects, identifies its expansion pattern, and—
most important of all—forecasts the leveling out that certainly is going to
occur.
As a long-term investor, it is not enough to purchase shares in a company and
then leave them to grow indefinitely. All growth is characterized by change,
and eventually today’s strongest growth stock will no longer be the same in
comparison to others. So, it makes sense to invest in long-term growth compa-
nies but then watch the fundamental trends. When growth itself begins to level
out, you need to determine whether it makes sense to continue holding shares
in that company or move your capital to a smaller company whose potential
rate of growth is greater. That often means that the investment value itself is
also greater. Of course, with greater investment potential comes greater risk.
One aspect of the leveling off in the rate of growth is that risk also tends to level
off. So, as a long-term investor, you will need to determine whether you want to
move your capital to the greater growth potential areas or protect your capital
in its appreciated form by keeping it in stock of the more firmly established cor-
poration. Either strategy makes sense as long as you understand the differ-
ences.
It comes down to a comparison between companies and a study of the fun-
damental volatility each will experience. The better-established company will
be likely to have a very low degree of fundamental volatility along with a slower
rate of growth; and the smaller, emerging long-term growth prospect will
exhibit the potential for long-term growth at faster rates but with more risk and
a higher degree of fundamental volatility.
Differences between Price and Earnings
The study of trends is essential for every investor, and most successful investors
accept the fact that analysis is the real key to consistently beating the averages.
The tendency among investors and analysts, however, is to apply the sound prin-
ciples of trend analysis but to the wrong material. While trend analysis makes
DIFFERENCES BETWEEN PRICE AND EARNINGS
155
sense when studying financial information—sales, profits, capitalization, market
share, and so forth—it really makes no sense when applied to the market price of
stocks.
It defies logic to believe that market prices can be studied in terms of trend
analysis, because volatility and its formula are invariably limited to price move-
ment during the past year. This study is short-term by definition. So, you often
find the illogic in the approach itself. An investor might say, “I believe in watch-
ing the fundamentals, and I understand how trend analysis can help me make
informed decisions.” Then, the same person will make an investment decision
based on comparisons of price volatility.
This mistake is easy to make. Investors are provided with certain informa-
tion in the form of stock listings, and the 52-week high and low range is easily
found. Volatility as computed is an easy formula, and the conclusions are easily
reached. Most investors have the point of view that volatility is easy to under-
stand because it means the same thing when applied to any stock. This belief
can lead to problems.
Fallacy: All volatility is the same.
The attributes of price (a technical indicator) and financial information (the
fundamentals) are vastly different and cannot be subjected to the same types of
analysis. As previously stated, market price is a useful indicator to watch for
changes in volatility. As trading ranges change and volatility increases, that
might serve as a signal about something changing in the fundamentals; however,
because price movement is based on perceptions (and perceptions are more
often wrong than right), it cannot be used as a reliable source for making the
decision to buy, sell, or hold. A long-term study of price reveals that day-to-day
price changes have little to do with the actual long-term trends of a company. The
stock price changes with a pendulum effect, tending to swing too high and then
too low based on the
facts about the company. The market, like supply and
demand markets, is efficient in many respects. Short-term pricing is not one of
those efficient points, however. Speculators recognize the tendency to overreact
to just about everything and move in and out of stock positions based on those
overreactions. As a long-term investor who believes in the fundamentals, how-
ever, using short-term price data is a dangerous idea; it can mislead you into mak-
ing ill-timed decisions rather than well-informed decisions.
In comparison, the fundamentals have certain attributes and can be studied
so that emerging trends are recognized over time. The tendency for long-term
growth to plateau is one very dependable factor because it occurs with regu-
larity. Confusing this study is the inevitable merger or acquisition. When com-
panies merge, the trend has to be adjusted so that the long-term field of
information reflects the consolidated entity. Otherwise, the whole study loses
its meaning and value. When you consolidate historical information, you also
156
VOLATILITY AND ITS MANY MEANINGS
discover that the trend itself changes. The previous isolated trend is no longer
significant because the combined organization has a different overall growth
history.
Just as a sales history tends to move toward the mean, a consolidated history
of two merged companies will be more difficult to read. Contrary points aver-
age out so that the overall trend is less clear. For example, if one organization
is growing at the average rate of $10 million in new sales per year and the
acquired company has been growing at the rate of $7.5 million in new sales,
the combined record will be difficult to interpret. Complicating the study is the
fact that these two entities probably are not the same size in terms of sales,
profit, or capital; that they might address different markets and have entirely
different fundamental attributes; and that the combined trend is going to move
in far different ways that each company moved in the past.
So, trend analysis is not easy when mergers take place. It would make more
sense to continue following the trend of each division as it existed prior to the
merger, but that presents several problems as well. First, it is difficult to tell
how dissimilar trends are affecting the whole organization. Second, the merger
itself probably changes the manner in which a trend is going to continue. And
third, the value of separating the major divisions of a company is questionable.
The solution is to adjust the overall trend by looking back historically and
creating a new trend study, which requires abandoning the prior trend analysis
and starting again. In so doing, it also is important to recognize how the merger
itself is likely to affect the past trend. For example, if two prior competitors
merge, their combined market strength is likely to change the way that the
overall organization will operate; thus, the trend will change. If two dissimilar
organizations merge, the overall trend will average out the significant factors
in prior trends even though they might be entirely different. For example, if the
parent company averages a net profit of 8 percent per year and the subsidiary
has earned only about 4 percent, the overall profit will be somewhere in
between. If both companies had the same sales level, one might expect to see
6 percent net profits; but any variation in the mix of sales volume will distort
this expectation. So, if the parent company has sales twice the volume of the
subsidiary, the net profit might work out to 7 percent or so.
The complexities of trend analysis are difficult enough for an organization
operating within a single market sector. When organizations diversify by
branching into different sectors (often through mergers), it complicates the
study because the dissimilar features offset one another. It is difficult, for
example, to anticipate changes in markets due to business and market cycles
when a company has diversified. This situation is intentional on the part of the
organization, of course. One purpose in diversifying is to insulate the company
from the singular effects of those very cycles. The diversified corporation hopes
to achieve expansion by going after market share in several different markets,
often with varying and offsetting business cycles.
DIFFERENCES BETWEEN PRICE AND EARNINGS
157
With these features in mind, it is clear that the methods you use to analyze
trends in the fundamentals are going to be far different than the relatively
straightforward study of price volatility. For those who are interested in select-
ing stocks based only on short-term price changes, the study of volatility with-
out detailed analysis is an easy task. The high and low prices for the year define
the trading range and thus define relative volatility of the stock. Higher volatil-
ity means more risk and lower volatility means more safety (so the argument
goes). Even a study of price volatility should include an analysis of the patterns,
causes, and exceptions within the price range, however. As previously demon-
strated, a volatile one-year history can be interpreted in several different ways.
The commonly held belief that all volatility is the same needs to be exam-
ined and questioned. It is more accurate to replace that belief with another:
Volatility has several different meanings, and price volatility is far different
than fundamental volatility. In either case, the initial conclusion needs to be
examined in more detail before any conclusions can be reached. Price volatil-
ity is of limited value, because it can act as a signal of change in the funda-
mentals. That is the extent of its value.
Conclusions Based on Fundamental Volatility
In studying the fundamentals in terms of sales and earnings volatility, it makes
sense to question the root causes of inconsistent sales and profits. When a com-
pany reports big jumps in earnings one year followed by declines the next, with
corresponding variation between profit and loss, that is a big problem for
investors. How can anyone forecast the future for such an organization? No one
can tell what kind of sales trend is underway because no trend has emerged.
Just as a company that has never reported a profit cannot be analyzed, a
company whose fundamentals change drastically from one year to the next is
equally as puzzling. When there is no profit, there is no PE ratio, no dividend
record, and no way to forecast growth. When a company reports inconsistent
sales and profits, it is a sign that management is not in control. You might
expect large jumps in the numbers for a year or two of big expansion, but mat-
ters should settle down rather quickly after that initial burst. Remember,
trends move toward the mean, and in order to be able to forecast future fun-
damental change, you need to begin with dependable raw material. Thus, you
expect sales to come through with some consistency and profits to follow suit.
If this process is not taking place for several years in a row, then there is likely
to be a problem at the top. Intelligent management often is misunderstood; its
function and purpose is not perceived from the outside in realistic terms.
Management’s task is not only to create bigger market share and expansion. It
goes beyond that. Management should also protect and reassure stockholders,
who like consistency and dependability. Thus, sales and profits should be
158
VOLATILITY AND ITS MANY MEANINGS
reported in a way that makes forecasting possible and fair. In that respect,
management is supposed to control growth so that it doesn’t occur so rapidly
that the corporation cannot support its new base. It occurs all too often that
uncontrolled growth leads to strains on capitalization, a decline in customer or
client service, and lower profits during times of higher sales—all due to man-
agement’s inability to control the rate and type of growth.
This situation raises a potential problem, of course. If management’s pri-
mary job is to protect the stockholder (meaning maintenance and improve-
ment of the stock’s market price over time), then how much control does
management exert over the reporting of sales and profits? The accounting rules
for reporting are flexible enough that companies are given some latitude in
interpreting its own numbers. Independent accountants will sign off on some
management decisions as long as they can find a way to justify management’s
decisions within the accounting rules. For example, a company that has shown
consistent growth might experience exceptionally high sales and profits one
year. Management perceives correctly, however, that this phenomenon is a one-
time deal that will not be repeated. If the high sales and profits are reported,
stockholders will expect a repeat of that change the following year, and when
it does not happen, it will be taken as a negative sign. In other words, the incon-
sistency from year to year rattles Wall Street, so it is more desirable to report
sales and profit growth in line with the past trend.
While actual manipulation of the books is illegal and deceptive, the account-
ing rules do provide for some adjustments in reported sales and profits. For
example, a portion can be deferred to the following year as long as there is
some justification for doing so. A company might increase its bad debt reserve
to reduce sales and profits or change its method for valuing inventory, for exam-
ple. The practice of putting off sales and profits to future periods, often called
“sugar bowling,” might not be frowned upon by the regulatory agencies as long
as the company is not thought to be deceiving stockholders. It is a far greater
problem when a company accrues income in a lower than average year, because
there is no guarantee that higher sales will come through in the future. So, the
practice of beefing up the sales and profit numbers is seen as a far more seri-
ous adjustment of the numbers.
The truth is that management and independent auditors do make adjust-
ments for several reasons in the release of financial information. As long as
there is no outright deception in this practice, the rules allow for some adjust-
ments. From the stockholder’s point of view, the consistency of sales and prof-
its makes prediction easier. So, in reality, if some sales and profits are deferred
during exceptionally high-volume years and the result is more dependable fore-
casting, then no one has been harmed. Cycles tend to make forecasting diffi-
cult, and trends are less reliable when the numbers change too frequently. So,
in some respects, changing the reported outcome can be beneficial both to the
CONCLUSIONS BASED ON FUNDAMENTAL VOLATILITY
159
company and to its stockholders. As long as the independent auditor is satis-
fied that adjustments fall within the acceptable range, and as long as the
Securities and Exchange Commission (SEC) agrees, the stockholder is pro-
tected. A deception usually refers to exaggerated reports; the relatively harm-
less practice of under-reporting outcome has more benefits than
consequences.
160
VOLATILITY AND ITS MANY MEANINGS
CHAPTER 8
161
Using Other
Peoples’ Money
L
everage is a popular idea among investors. On paper at least, the return on
investment looks more promising when a limited amount of capital is
expanded. There is also the unavoidable question of risk, however, and that is
where the idea of leverage becomes more troubling.
As a general rule, leverage means using a capital base as collateral to bor-
row money for investment. For example, when a homeowner puts a down pay-
ment on a property, the down payment is collateral—usually representing only
a small portion of total value. The balance, the mortgage obligation, is lever-
aged money because it was borrowed. For most homeowners, this method is
the only way that a home would be affordable. Few people can save enough
money to pay cash for their homes, so using leverage is normal and acceptable.
It is not the same for stockholders, however. With leverage comes more risk
and more danger in experiencing a loss.
Leverage can be thought of as a third method to investing, the first two
being equity and debt. With equity, you buy tangible value such as shares of
stock or real property. With debt, you lend your money to someone else and
receive interest payment, such as through the purchase of bonds. These two
well-known examples can be achieved through the use of money in hand or on
deposit, or the third method, leverage, can be employed. With leverage, you use
a small amount of capital to increase your holdings. The theory is that by
putting more money in the investment, you will gain more in profits.
The nature of equity investments bought and paid for in full is different than
equity that is leveraged. If you pay full price for shares of stock, you exchange
one asset for another. If that asset grows in value, you have a profit; if it falls,
you lose. But with leverage, a profit is not enough. You will need enough profit
to pay interest on the borrowed funds plus a profit that is adequate to meet
your investment goals. Your profit has to be greater when you use leverage, and
that often leads to problems because equity securities are not always going to
behave as you would like.
The same argument applies to debt investments. The interest you receive
from a bond issuer has to be equal to or greater than the interest you pay to
borrow money. Even then, you are at risk. If interest rates rise after you buy a
bond, the market value of the bond could be discounted, so you would not be
able to close out the position without a loss. Given the fact that bonds reflect
current market rates, it is unlikely that you would be able to leverage capital
and buy bonds at a profit. Invariably, the cost of borrowing money will be higher
than the interest on a debt investment. A bond paying higher rates would prob-
ably be rated so poorly that the risks are not justified.
The risk associated with leverage makes it suitable for only a minority of all
investors. If you are willing to accept the higher than average risks, it probably
means that you have great faith that the market is going to rise in the very near
future. If you are wrong, you will lose; if you are right, you make bigger profits
by leveraging than you would by only buying what you could afford to pay for at
the time of purchase.
An attitude among stock market investors is that leverage is a sophisticated
technique used by all smart investors and that the “real money” is to be made
by using other people’s money. This high-rolling approach is high in risk to say
the least. It might even be foolish given the uncertainties of the market.
Leverage, like all forms of speculation, is a dangerous approach to investing
and certainly makes no sense whatsoever if you plan to buy and hold securities
for the long term. It makes far more sense to buy in increments as you can
afford to buy and to leave the use of leverage to the speculator. In respect to
the risk itself, leverage is a form of speculation taken to its highest level. It is
risky enough to lose all of your money; when the loss leaves you in debt as well,
it puts the whole idea in perspective.
The Inaccuracy of Leverage Examples
Anyone who has listened to the sales pitches for leverage knows that the
promises are highly suspect, to say the least. If you believe that you hear from
162
USING OTHER PEOPLES’ MONEY
the promoters, leverage in real estate, for example, is a sure way to make mil-
lions by using no money of your own.
The typical example begins with a false premise and then proceeds, empha-
sizing the potential for profit while completely ignoring all forms of risk. In the
typical sales pitch, you are told that you can buy distressed properties out of
foreclosure for nothing down. As good as that sounds, it makes sense to ask,
“Why is the property in foreclosure?” If there were any real equity in that prop-
erty, it is doubtful that an owner or lender would be willing to get rid of it. A
distressed property often means that the problems go beyond the mere non-
payment of the mortgage. The property could have structural problems that
would cost so much to fix that there is negative equity in the property. The
neighborhood could be so dangerous that no properties will grow in value and
you will have problems keeping dependable tenants in the property or finding
another buyer. Other problems might be less obvious just looking at the facts.
If anyone was murdered in the home or committed suicide, for example, that
inhibits anyone’s ability to sell the property—and, in many states, those events
have to be disclosed. So, it could be that a property is distressed because its
marketability is at zero.
Beyond the flaws of the initial premise, you are next told that you can turn
around and borrow money against the property and use that to buy more proper-
ties at foreclosure auction or directly from the government. While some programs
exist for moving foreclosed properties in this manner and with minimal down pay-
ment, you still need to evaluate the idea realistically. For example, how will you
make payments on the property? Will rental be adequate to cover the mortgage?
What is the rental demand in the area? Many questions come up when dealing
with property and when considering becoming a landlord. To listen to the sales
pitch, all you have to do is buy and sell property and take your profits to the bank.
In practice, you have to work harder to make distressed properties profitable, and
in some cases, it cannot be done. That is why they are being sold for nothing down.
When you get to the point of trying to sell a property, you face yet another
problem. Can you sell the property at a profit, or can you even sell it at all? In
many cases, owners who cannot afford to meet their mortgage obligations will
sell the house. Few people with equity will be willing to just walk away and get
nothing. So, when a house is up for sale through foreclosure, chances are there
is going to be a problem in selling the property as well.
The programs for leverage make it sound as though you can use equity to
pick up more and more houses in this way. In theory, you could own dozens of
foreclosed properties and pocket thousands of dollars per month. In practice,
you will run into problems getting financing for more than four properties, just
due to restrictions placed upon lenders. So, picking up foreclosed properties is
naturally limited by the lending market as well as by practical constraints.
Some programs also like to discuss the tremendous tax benefits in owning
property. You are allowed to write off depreciation, interest, utilities, property
THE INACCURACY OF LEVERAGE EXAMPLES
163