The Toyota Way Fieldbook phần 3 docx
Bạn đang xem bản rút gọn của tài liệu. Xem và tải ngay bản đầy đủ của tài liệu tại đây (3.74 MB, 49 trang )
a foundation for creating flow and establishing standardization. In essence, this
isolation of variation is a basic application of heijunka, or leveling. By grouping
similar products, we were able to level the workload for the majority of the
process. The highly variable work is still difficult to standardize, but in this case
80 percent of the total is possible. This is an important aspect of creating stability.
Some basic applications of leveling can be done in the stability phase, and there
are advanced applications of heijunka as well, that will incrementally tighten the
timing and pressure on the system in later phases. (We will discuss this in detail
in Chapter 7.)
One common mistake is to attempt to establish flow or standardization too
soon. As we will go into in the next chapter, creating flow between operations
is designed to surface any issues quickly and to make them critical in nature
(ignoring them would be disastrous). If this step is taken before eliminating
major obstacles, the result will be too many problems and a consequent retreat
to the “old way.” Likewise, an attempt to standardize a chaotic process with a
high level of variability will most certainly cause frustration, since it is not pos-
sible to standardize variation.
If we liken the creation of lean processes to building a house, we understand
that in order to support the roof, we will need walls and trusses. Foundations and
subfloors, in turn, support the walls. This is easy to see and understand because a
house is a real, visible, tangible object with common elements (they all have roofs
of some type). A lean system, on the other hand, is not so clear. If you focus your
effort on developing an understanding of the intent of each phase, rather than the
application of lean tools, this process will be more successful. Understand the what
before trying to apply the how. The lean tools are applied to address specific needs,
and should not be applied simply because they are in the toolbox.
THE TOYOTA WAY FIELDBOOK78
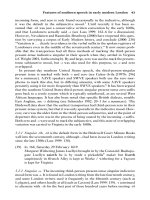
Figure 4-9. Process stability after variation of welding time is isolated
Throughput Time (Days)
0
5
10
15
20
25
Nov-02
Dec-02
Jan-03
Feb-03
Mar-03
Apr-03
May-03
Jun-03
Jul-03
Aug-03
Sep-03
Oct-03
Nov-03
Dec-03
Jan-04
Feb-04
Mar-04
Apr-04
May-04
Jun-04
Jul-04
Days
Chapter 4. Create Initial Process Stability 79
Reflect and Learn from the Process
1. Develop a current state map of your operation. The primary
purpose is not to complete a map, but to see what is actually
happening in your organization.
a. List at least 50 examples of waste that you observed while
developing the map. At this time do not be concerned
with “fixing” the problems you see. Simply look and notice
the opportunities.
b. If you cannot identify at least 50 examples, walk through
the process again, taking more time to stop and observe
(repeat as necessary).
2. Identify one specific operation from your current state map
where you believe the greatest need for improvement exists.
a. Complete the “stand in the circle” activity at this opera-
tion for at least two hours or more (longer is better).
b. List at least 50 examples of waste within this single oper-
ation. This should be a simple task. If you have trouble
identifying 50 items, you’re overlooking many examples
of waste. Take time away from the process; then return
with a fresh mind. Begin with the most obvious examples
(big waste), and then become more focused on smaller
and smaller examples of waste. If 50 examples is a simple
task, keep adding to the list until you are challenged to
find additional examples. This is when you will develop
your powers of observation.
3 Identify indicators of instability in this one operation (chaos,
variation, firefighting, inconsistent performance). Do not think
about why these conditions exist or how to correct them. The
purpose is simply to observe the current condition.
a. Make a list of the indicators of instability that you observed.
b. Separate the list into two categories based on whether the
instability is caused by external issues (customer demand
and product variation) or by internal issues (changes made
that are within your control).
c. Review the suggestions in this chapter and determine the
strategies and lean tools needed to address the issues.
Chapter 5
One-Piece Flow Is the Ideal
Taiichi Ohno taught us that one-piece flow is the ideal. In school when you have
the right answer for the test you get an A. The right answer is one-piece flow.
So just go out and implement one-piece flow and you are doing lean. What
could be easier? In fact, Ohno also taught that achieving one-piece flow is
extremely difficult and, in fact, not always even practical; he said:
In 1947 we arranged machines in parallel lines or in an L-shape and tried hav-
ing one worker operate three or four machines along the processing route. We
encountered strong resistance among the production workers, however, even
though there was no increase in work or hours. Our craftsmen did not like the
new arrangement requiring them to function as multiskilled operators. . . .
Furthermore, our efforts revealed various problems. As these problems became
clearer, they showed me the direction to continue moving in. Although young
and eager to push, I decided not to press for quick, drastic changes, but to be
patient.
Ohno learned to be patient and deliberate about reducing waste while moving
in the direction of one-piece flow, also called “continuous flow.” Products that
move continuously through the processing steps with minimal waiting time in
between, and the shortest distance traveled, will be produced with the highest
efficiency. Flowing reduces throughput time, which shortens the cost to cash
cycle and can lead to quality improvements. But Ohno learned that one-pi ece
flow is fragile.
Create Connected
Process Flow
Copyright © 2006 by The McGraw-Hill Companies, Inc. Click here for terms of use.
Sustaining continuous flow also serves to surface any problem that would
inhibit that flow. In essence, the creation of flow forces the correction of problems,
resulting in reduced waste. We often use the analogy of a ship on a sea filled with
dangerous rocks. As long as the rocks, like problems, are covered with water, like
inventory, it’s smooth sailing. But if the water level is lowered, the ship can
quickly be demolished by running into the rocks. In most operations there are
boulders hovering just under the surface, so naturally we keep enough invento-
ry to hide the problems.
Ohno discovered that if he reduced the inventory, the problems surfaced, and
people were forced to solve them or the system was forced to stop producing. This
was a good th
ing, as long as the damage was not too severe and the people had
the capability to improve the process so that the problems did not recur. He also
learned that the system needed some minimal level of stability, or the reduction
of inventory would just result in a loss of production, as we saw in Chapter 4.
Connecting two or more processes into a continuous flow will increase the
severity of any problems and necessitate their elimination. Connected flow across
the enterprise means that production in the entire facility—and perhaps across
multiple facilities—will be shut down if the problems are not corrected effec-
tively. Imagine the importance of equipment readiness, manpower ava
ilability,
and material supply when thousands of people all stop working if there is a failure!
At Toyota this occurs from time to time. The entire operation is connected, and so
within a few hours a problem with a main component will halt the entire facility.
Many organizations believe that this type of production stoppage is unaccept-
able. Stopping production is a sure ticket to the unemployment office. But Toyota
sees it as an opportunity to identify a weakness within the system, to attack the
weakness, and to strengthen the overall system. It is this counteri
ntuitive think-
ing that perplexes bottom-line thinkers. The Toyota Way suggests that “failing”
and correcting the shortcoming is a way to improve results for the long term.
Traditional thinking, in contrast, is that success is achieved by never allowing
“failure” to affect the short-term result.
That said, the objective is not to entirely jeopardize performance. It is wise
to prepare for flow by eliminating major issues, and to move with careful intent
and understanding, beginning w
ith planning, and developing the discipline for
solving problems. As the process improves, and develops capability, the control
parameters are compressed during the leveling phase to surface the next layer
of issues in an ongoing cycle of continuous improvement.
Why Flow?
Most often the failure of implementation stems from a misguided belief that suc-
cess is rooted in the application of lean tools (such as setting up the cell). We often
tour clients through lean plants, in some cases Toyota plants, and it’s interesting
Chapter 5. Create Connected Process Flow 81
to hear what they get out of the tour. They have overall impressions of cleanliness,
orderliness, precision, and people engaged by their work. But their eyes light up
when they see something they can directly apply in their plants.
One time, someone noted how a lean plant kept small cabinets of expendable
materials by each work cell and the cell leader signed out materials as needed. A
kanban system was used to replenish things like plastic gloves. The “industrial
tourist” was excited about going back and setting up a similar system for expend-
able materials in his plant. Unfortunately, he had noticed only one specific tool,
and failed to see the interconnectedness and i
nterdependence of all the various
elements. Successful creation of lean processes is derived from a deep under-
standing of how each tool is utilized to accomplish an end objective. A trained
mechanic does not bring a wrench to the car and then find a nut to loosen. He first
determines the nature of the problem, what will need to be done to correct it,
and then selects the appropriate tools to complete the job.
Yet we often see organizations place the tool before the understanding. “We are
going to implement visual control,” managers say, as if it were an individual
piece of a jigsaw puzzle to be added. A key to long-term success is a combined
effort that includes understanding the pr
imary philosophy or concept, an effective
strategy that necessitates the concept (it must become mandatory), a methodology
for applying the concept, lean tools that support the method, and an effective way
to measure the overall result.
We find it helpful to think about the relationship between one-piece flow and
waste reduction in the context of a broader model as shown in Figure 5-1. Rather
than leap into implementing tools for flow and pull, step back and understand
the purpose. This model emphasizes the relationship between the primary prin-
ciple of lean—the identification and elimination of waste—and the method for
achieving that objective—reducing batch size to move toward continuous flow.
The creation of cont
inuous flow is often thought to be a primary objective when
creating a lean process, but in reality, the creation of continuous flow is designed
to drive waste from any operation: Waste elimination is the primary objective.
When material and information flow continuously, there is less waste in the
operation. This is true by definition. If there were a lot of waste, material and
information would not be flowing. However, there is something more profound
happening here. Maintain
ing continuous flow between processes will create a
linkage, making each process dependent on the other. This interdependency
and the relatively small amount of buffering make any condition that interrupts
the flow more critical.
Anyone who has attempted to implement one-piece flow (a difficult task
indeed!) understands that heightening the level of problems can be of great ben-
efit . . . or of great harm. If effective systems are not in place to support the oper-
ation, the severity of problems will surely spell doom. This is the time when lean
THE TOYOTA WAY FIELDBOOK82
Less Is More: Reduce Waste by
Controlling Overproduction
In a true one-piece flow, each operation only builds what the next operation
needs. If the next operation gets backed up for some reason, then preceding
Chapter 5. Create Connected Process Flow 83
Figure 5-1. Waste reduction model
Philosophy
Waste Elimination
Performance Measure
Reduced Lead Time
Principle
Create Continuous
Process Flow
Strategy
Create Interdependent
"Connected" Processes
Reason
Problems Are Surfaced
Quickly and Are Critical
Effect
Problems Must Be
Corrected Quickly
Result
Waste Is
Reduced!
Method
Pull System
Lean Tools
Kanban, Supermarkets,
Defined FIFO Lanes
Control Method
Utilize Visual Controls So
That No Problems Are
Hidden
tools must be applied to provide the necessary structure to ensure success rather
than failure. The lean tools can help by providing both support systems and con-
trol methods to react appropriately to the problems that surface.
operations actually stop. It seems that nothing can be more uncomfortable in a
traditional manufacturing operation than stopping. Yet the alternative to stop-
ping is overproducing—producing more, sooner, or in greater quantity than the
next operation requires. Toyota considers overproduction to be the worst of the
seven types of waste because it leads to the other six types of waste (inventory,
movement, handling, hidden defects, etc.). This is the key to understanding how
less can be more (less means fewer parts produced in some individual steps in
the process, more means getting more value-added activity done from the overall
process). The case example below explains a typical situation of overproduction
that reduced the ability to meet the customer requirement.
Case Example: Control Overproduction to Improve
Operational Availability
While standing in the circle and observing a fabrication line, it was
clear that overproduction was rampant. The line was filled with product,
much of it stacked two and three layers deep. The workers were all busy,
but we could see that the operators overproducing were engaged in
“busy work” such as stacking and positioning the excess product.
Operators typically reached a point when no additional work would fit
on the line, and then excess time was spent care-tending the overpro-
duction (inventory). Cycle time comparisons to takt time revealed—
no surprise—that these operations were below the takt time and had
extra time available. Since they were not provided with additional value-
adding tasks, the operators filled their extra time by overproducing
and care tending.
Observation also showed that the process downstream of the over-
production (the customer) had to spend additional time moving and
unstacking the product that was poorly presented in large batches. The
cycle time of this operation was at takt time, but with the additional work
required to move and unstack product, the total time actually exceeded
the takt time. It could not achieve customer demand during scheduled
work hours. In this case, the supplier process created the excess waste,
but the negative effect was realized at the customer process.
We asked the operators at the initial operations to stop, and to stand
doing nothing, rather than to continue producing when the next process
had more than enough material to work with. It is, of course, very uncom-
fortable for operators to do nothing because they’ve been conditioned
by management to “keep busy.” Toyota stresses the importance of this
concept because it allows everyone to see and understand the amount
of opportunity available. Everyone can see the idle time because it is not
being clouded by busy work (overproduction).
THE TOYOTA WAY FIELDBOOK84
By having these operators do less (make fewer parts), the customer
operations also had less wasted time and were able to convert that
time to more production. The total output of the entire operation
increased significantly by simply controlling overproduction.
Of course, we were not satisfied to have operators standing around
with idle time—the waste of waiting. The next step was to determine
how to eliminate additional waste from these operations, and to
combine operations and achieve “full work.” For this task standardized
work analysis similar to the example described in Chapter 4 was
used.
Case Example: Making Aircraft Repair Flow at
Jacksonville Naval Air Depot
Repair operations have even more variability than manufacturing.
Until you break into the equipment, you don’t exactly know what the
problem is or how long it will take. So repair is often treated as a craft
process: Get a team of expert repair persons to work on each piece of
equipment. It is a return to the old days of the Model T, when a team
of craftsmen stood around a stand and built the car in place.
The U.S. Department of Defense does a tremendous amount of repair
and overhaul of ships, submarines, tanks, weapon systems, and aircraft.
These are very large things. There is almost always urgency getting a
plane out. A fighter plane being repaired in a hangar is one less plane
available for combat.
The largest employer in Jacksonville, Florida, is a Naval Air Depot
where aircraft is repaired for the Navy. Aircraft need to be completely
overhauled at periodic intervals, and some aircraft have serious weak-
nesses that require specific repairs. Because of the urgency of getting
planes overhauled, repaired, and back in service, when a plane comes
in, it’s brought into a hanger, and skilled personnel attack it, taking it
apart. Each plane sits in position and is dismantled, parts are repaired
or replaced, everything is tested piece by piece, and it is finally
reassembled and flown back into the field. Another motivation to get
to work on the plane immediately is to get paid. The base gets paid
based on charging hours for working on planes.
While the base had decades of experience repairing aircraft, the pressure
to reduce the time aircraft spend on the ground was intense. In some
cases aircraft are discontinued, and there are then a limited number avail-
able in service. If the planes spend too much time in the repair hangar,
there won’t be enough to fly the scheduled missions. A program called
Chapter 5. Create Connected Process Flow 85
“Air Speed” was started at headquarters to speed up the process of
repairing aircraft at NAVAIR facilities.
Two aircraft repaired at Jacksonville were the F18 and the P3 fighters,
worked on in different hangers. Lean manufacturing experts were hired
as consultants to lead internal lean teams and develop internal expertise.
Independently, they analyzed the current situation for the P3 and F18.
Their conclusions were the same:
◆ Each plane was treated as a unique project, with craftsmen working
in place, in no particular standardized process.
◆ The work area around the plane was disorganized with tools and
parts lying every which way.
◆ Repair people spent an inordinate amount of time walking to get
tools and parts and indirect materials.
◆ When the plane was disassembled, parts were tossed into boxes that
were sent to storage (e.g., an automated storage and retrieval system),
and then when the parts were brought out for reassembly, much
time was spent sorting through boxes, looking for parts. Parts were
often missing because they were "robbed" to work on another plane.
◆ Many planes were being worked on at once, and when they got stuck
on one for some reason (e.g., needed key parts), they shifted to work
on another.
◆ There was a belief that the planes came in for repair unpredictably and
that it was impossible to plan for a stable, leveled amount of work.
Value stream mapping revealed a huge amount of waste in the current
processes. Future state maps were developed and similar solutions were
presented for all the aircraft:
◆ The process of disassembly, inspection, repair, and reassembly needed
to be separated into distinct phases.
◆ A flow line needed to be set up with planes at different stations, and
specific work done at each station.
◆ The line then needed to be balanced to a takt time. Analysis of actual
data showed the arrival of planes was far more stable than previously
believed.
◆ Standardized work needed to be developed at each station.
◆ 5S was needed to stabilize the process and reduce much of the non-
value-added walking and getting stuff.
◆ A “hospital” position was needed so that if the workers got stuck on
one of the planes (e.g., waiting for a long-lead-time part), the plane
could be set aside in the hospital and the flow would not stop.
THE TOYOTA WAY FIELDBOOK86
◆ Management needed to be educated in the process and stop the
practice of bringing in additional aircraft whenever one arrived.
They needed to control the work in process limiting aircraft to the
number of stations in the flow lines (discussed later).
The work areas were laid out into workstations. There was a technical
challenge in moving the plane from station to station. At some point the
plane was taken apart and the center barrel and wings were removed,
along with the wheels. The F18 was a new aircraft for the base, and
they were able to purchase a system that held the plane together on
a big fixture on wheels so it could be moved from position to position.
This was not the case with the P3, so in its case a decision was made
to use a “virtual flow line.” That is, teams of repair persons would come
to each aircraft at fixed intervals of time to perform a stage of work.
This meant they would have to bring in the tools and materials needed
for each phase of the process.
Kaizen workshops were used to set up each piece of the overall system.
There were 5S workshops to lay out the area, find places for everything,
and label standard positions. There were material flow workshops to
take parts off the plane and put them into “shadow boxes” or kits, so
when they were brought back for reassembly they were organized.
Hazardous materials were set out on carts in kits. All the kits and parts
and materials were set up on pull systems to be replenished as they were
utilized. The slow and complex process of analyzing each procedure in
detail to develop standardized work was started so that each station
could be aligned with the takt time.
The P3 is an older plane soon to be retired. The Navy decided to reduce
the available planes in the fleet by over 50, from 200 to 150, yet wanted
a constant number in the field (about 120). This required less time tied
up in maintenance to keep the planes needed in the fleet available. Due
to some fuel tank and structural integrity problems associated with
aging, additional stress testing and repair requirements were added,
increasing the pressure—doing more in less time. In short, from the
Navy’s perspective this was a crisis, and from a lean perspective an
ideal opportunity to show the value of waste elimination.
Repairing these aircraft prior to the additional testing and repair
requirements took 247 calendar days. To meet the 120 planes needed
in the field at all times required a reduction in turnaround to 173 days,
a 30 percent improvement.
In April 2004 the lean activities formally started under the direction of
an experienced lean consultant.
1
After value stream mapping and
Chapter 5. Create Connected Process Flow 87
1
The consultant was Ed Kemmerling, who was later joined by Sam Talerico, both with many
years of experience applying lean methods at Ford Motor Company.
numerous kaizen events, significant results were already evident by
February 2005, less than one year later, as can be seen in the table
below.
Pre-Lean Post Lean
(4/04) (2/05)
Planes in hanger (WIP) 10 planes 8 planes
Takt time Nonexistent 15 days
Lead time when — 120 days
takt achieved
Actual lead time 247 days 200 days (on track for target
(calendar days) of 173 days)
Additional Results Reduced cost and manpower
Setting up the process was one thing. Managing it was another. It
required a different approach to management than the current leaders
were used to. While there were many different things to manage—5S,
standardized work, problem resolution processes, etc.—one of the
toughest challenges was fighting the urge to bring in more aircraft. The
flow concept was based on a fixed amount of WIP (work in process).
That is, there were a certain number of positions and a hospital, and
there should be no other aircraft in the hangar. When one plane was
finished and taken out of the hanger, one more could be brought in.
This was counter to just about every instinct of the leaders and counter
to the measurement system. First, they believed if they left a plane out-
side, it would take longer to get it fixed. The lean project in fact had
shown the opposite—lead time could be reduced in a major way by
working on a specific number of aircraft and leaving any additional
outside of the hanger until there was a place opened up at the begin-
ning of the line. Second, there were times when people were not busy
working on the planes, since all the work that needed to get done was
done on the aircraft in process. This was feared because the leaders were
judged based on charging direct labor hours, which also justified having
indirect labor in the hangar. At various times when a new plane came
in, some higher level leader would at first order the plane to be taken
into the shop. The lean consultants had to use their influence to get the
plane taken back out. It was clearly a major cultural clash.
THE TOYOTA WAY FIELDBOOK88
The results were quite astounding to the Navy. The Jacksonville base
quickly became a preferred tour site for personnel from the Navy, Naval
Air Depots, Air Force, and others to see real lean in action. Jacksonville
was emerging as a benchmark. Perhaps most dramatic was to see planes
being repaired in assembly-line fashion. Setting up a flow line with a
takt time drove tremendous continuous improvement to eliminate
waste and balance the line. Stability and control immediately began
to replace chaos and disorganization.
Strategies to Create Connected Process Flow
Table 5-1, below, shows the strategies that guide the creation of connected process
flow, as well as the primary and secondary lean tools often utilized. The same
tools that were used during the stability phase may be used (continually refin-
ing the result), as well as additional tools, depending on the circumstances of
the operation. The objectives and strategies, however, always apply.
Single-Piece Flow
This is the epitome of flow, and in fact the move toward single-piece flow has
reached fad status, with many companies failing in their attempts to reach this
level. Achieving single-piece flow is extremely difficult and requires a highly
refined process and very specific conditions. It will not ever be possible in many
Chapter 5. Create Connected Process Flow 89
Table 5-1. Strategies and Tools Used in Creating Connected Process Flow
Strategies
Primary Lean Tools
Secondary Lean
Tools
• Continued elimination of
waste
• Force problems to
surface
• Make problems
uncomfortable
• Establish connected
processes to create
interdependency
• Identify weak links in the
flow and strengthen
them
• Workplace/Cell
design
• Pull techniques
• Clearly defined
customer/supplier
relationships
• Visual controls
• Kanban
• Kanban boards
• Supermarkets
• FIFO lanes
• Problem solving
situations, and in many others several iterations through the continuous
improvement spiral would be required before attaining this level of capability.
As an analogy, imagine a bucket brigade line where the bucket is passed
from person to person one at a time. The ultimate single-piece flow would allow
the passing of a single piece from one member directly to the next. This would
require perfect synchronicity between all members of the brigade. After hand-
ing off one bucket to the following member, a turn is made to the previous
member to retrieve another bucket. Unless the timing between the two mem-
bers is absolutely the same, one of the members will wait on the other, whi
ch is
a form of waste. This level of precision would be exceptionally difficult, and
only possible in cases where the cycle time balance is perfect. Any slight falter
or misstep by one person on the line would throw off all the others, and the
house could burn down in the meantime.
In most manufacturing operations utilizing one-piece flow, a single piece is
placed between the workstations, allowing for minor variance in each worker’s
cycle time without causing waiting time. Even at this level, the cycle time balance
between operations needs to be exceptionally high.
Additional pieces between
each operation allow for greater variation in cycle times from operation to oper-
ation; however, this also increases the waste of overproduction. This is the conun-
drum. Decrease the buffer between operations to reduce overproduction, and
increase the losses due to imbalanced work times.
There is a happy medium as you move forward with the creation of lean
processes. That medium point will provide a certain degree of urgency for prob-
lems, so they’re not ignored, and also a degree of cushion until the capability of
the operation is improved and a tighter level can be sustained. The cont
inuous
improvement spiral model outlined in this section moves this cycle forward. The
THE TOYOTA WAY FIELDBOOK90
TIP
When Is a Problem Not a Problem?
Within Toyota, leaders are conditioned to not only stop and fix
problems, but also to continuously be on the lookout for prob-
lems before they occur. A well-established lean operation with
continuous, connected flow provides signals, which give everyone
an “early warning indicator” prior to complete system failure.
The ability to find problems before they occur allows leaders to
take preemptive corrective action, thus averting the failure.
Note: Within Toyota, “failure” is not considered to be a “bad”
thing. In fact, lack of failure i
s considered to be an indication that
the system has too much waste. Not knowing when and where the
failure will occur is an indication of a poorly designed system.
incremental leveling phase will require a reduction in buffer quantities through-
out the flow stream, thus driving ever-smaller problems to the surface, where
they demand attention. This will create new instability, and the cycle spirals
toward a tighter level of performance.
Key Criteria for Achieving Flow
As we discussed in the last chapter, foundational elements are necessary for
achieving smooth flow. These key criteria are generally met during the stability
phase, but bear repeating here.
◆ Ensure consistent capability, which is the primary intent of the stability
phase. At the very least, the level of capability should be on a daily basis.
During each day the operation must be capable of fulfilling the require-
ments of the customer.
◆ Consistent capability requires consistent application and availability of
resources—people, materials, and equipment. The inconsistent availability
of these resources is the primary reason that flow is unsuccessful. Methods
must be put in place to ensure availability of resources (not by simply
adding resources, which is added cost).
◆ Reliability of processes and equipment is imperative. Initially this would
encompass the larger issues such as downtime, or changeover, but as the
process is refined it would include lesser issues such as ease and simplicity
of use.
◆ Operation cycle times must be balanced (equal) to the takt time. Uneven
work times will create waiting time and overproduction.
Chapter 5. Create Connected Process Flow 91
TRAP
The Risk of One-Piece Flow Before Its Time
We have seen companies coming back from training classes excit-
ed about one-piece flow immediately create a cell, discover the cell
is shut down most of the time, and conclude that lean does not
work in the real world. They are suffering from a problem known
as “rolled throughput yield.” Take the case where five machines
are linked together in a one-piece flow and each machine inde-
pendently breaks down 10 percent of the time—that is 90 percent
uptime. In this case the uptime of the cell will be:
.9
5
ϭ .9 ϫ .9 ϫ .9 ϫ .9 ϫ .9 ϭ 59 percent uptime of the cell!
The solut
ion: Keeping a few pieces of WIP between operations
in carefully selected locations can increase this to 90 percent.
THE TOYOTA WAY FIELDBOOK92
Case Study: The Danger of Single-Piece Flow for Short
Cycle-Time Jobs
The move to making material flow from traditional “batch and queue”
methods has become somewhat of a fad. As with most fads, they can be
taken to an extreme, and negative consequences ensue. The single-piece
flow “fad” has, in many cases created reduced performance results.
Single-piece flow may not be the most efficient method for short cycle-
time operations (30 seconds or less).
A kaizen workshop was held with the objective of establishing single-
piece flow capability in the assembly operation. The product was an
assembled fitting requiring 13 seconds to complete. The takt time was
determined to be 5 seconds, based on the customer demand. The
work was divided among three operators, and a work cell (another
fad) was created to facilitate the passing of product between operators,
which is necessary for flow.
Several months later this work area was struggling to meet the customer
demand, and operators had returned to batching product between
operations. Observation revealed two major issues. First, as the cycle
balance chart in Figure 5-2 shows, the cycle times for the operators were
not well balanced.
This imbalance in work cycle times is a major reason operators begin
to deviate from the “no batching” rule. When operators deviate from
the original plan, it’s a strong indication that there is a flaw in the plan.
Unfortunately, a struggle usually ensues as management attempts to
enforce the rules of flow rather than to stop and consider where the
Cycle balance chart: Fitting assembly
0
1
2
3
4
5
6
Operator 1 Operator 3
Seconds
Takt time = 5 seconds
Operator 2
Figure 5-2. Original cycle balance chart for fitting assembly
Chapter 5. Create Connected Process Flow 93
process is flawed. Learn to see operator deviation as a positive! Stop
and observe and find the real cause, which if corrected will yield a
stronger process.
If the cycle times were properly balanced and smooth flow achieved,
there is another less noticeable problem. Attempting single-piece flow
when the work cycle time is very short creates a high ratio of waste to
value-added. Here’s why: During any work process there is inherently
some amount of necessary waste, such as picking up the part and setting
the part down for the next operation. This waste can be minimized,
but in the best-case scenario will still require one-half to one second
for each motion (pick up, and put down). Assuming the best case, this
would require a total of one second per work cycle—a half second to
pick up, a half second to put down—of motion waste. If the work cycle
time is five seconds total, one second for handli ng amounts to 20
percent of the total time! This comes to over 30 percent on a three-
second operation. That is a huge amount of inevitable waste. Yet this
waste is often overlooked because of the assumption that if the material
is flowing and the operators are moving continuously, it is “lean.” As
we see here, that is simply not the case.
This operation would be improved by having two operators pi ck up
a part and complete it entirely, rather than breaking the operati on
into multiple jobs in an attempt to create “flow.” The time would
be reduced by two seconds, and the result is 11 seconds to complete
(Figure 5-3). The net time per piece is 5.5 seconds (two people
working simultaneously produce two parts every 11 seconds and
11 seconds divided by 2 pieces = 5. 5 seconds per piece), which is
Cycle balance chart: Fitting assembly
0
2
4
6
8
10
12
Operator 1 Operator 2
Seconds
Takt time for 2 pieces = 10 seconds
Figure 5-3. Cycle balance chart for improved fitting assembly
Pull
The terms “pull” or “pull system” are often used interchangeably with flow. It
should be understood that, like flow, pull is a concept, and the two are linked,
but not the same. Flow defines that state of material as it moves from process to
process. Pull dictates when material is moved and who (the customer) deter-
mines that it is to be moved.
Many people are confused about the difference between the “push” method
and the “pull” method. Some erroneously think they are “pulling” because the
material continues to move or flow. It is possible to flow without having pull.
There are three primary elements of pull that distinguish it from push:
1.
Defined. A defined agreement with specified limits pertaining to volume
of product, model mix, and the sequence of model mix between the two
parties (supplier and customer).
2. Dedicated. Items that are shared between the two parties must be dedi-
cated to them. This includes resources, locations, storage, containers, and
so forth, and a common reference time (takt time).
3. Controlled. Simple control methods, which are visually apparent and
physically constraining, maintain the defined agreement.
In a push system there is no defined agreement between the supplier and the
customer regarding the quantity of work to be suppli
ed and when. The supplier
works at his own pace and completes work according to his own schedule. This
material is then delivered to the customer whether the customer requested it or
not. Locations are not defined and dedicated, and material is placed where there
is an opening. Since there is no definition, or dedication, there is no clear way
to understand what to control or how to control it.
Of course, some element of control does happen through expediting, chang-
ing the schedule, and moving people, but this only leads to additional waste
and variation. It could be argued as well that the agreement is defined based on
the schedule. All processes are working to the “same” schedule.
In fact they
may be on the same schedule, but they are not on the same page.
THE TOYOTA WAY FIELDBOOK94
0.5 seconds over takt. The next step would be to reduce other waste
and simplify the operation so it can be completed in 10 seconds or less,
resulting in a net time per piece below takt time (5 seconds).
In this example, the creation of flow actually reduced performance by
33 percent (three operations rather than two). Also, in the scope of
the entire value stream, this operation was a very small portion of the
total material flow. There were much greater opportunities to create
flow and reduce the throughput time in other areas by connecting
operations utilizing the pull methods described below.
Chapter 5. Create Connected Process Flow 95
A “pull system” is an aggregation of several elements that support the
process of pulling. The kanban “sign” is one of the tools used as part of a pull
system. The kanban is simply the communication method and could be a card,
an empty space, a cart, or any other signaling method for the customer to say,
“I am ready for more.” There are many other elements as well, including visu-
al control and standardized work. If the three elements of pull are properly
installed, a “connection” is formed between the supplier and customer processes.
The three elements dictate the parameters of the connection and its relative
strength and “tightness.”
The case example below illustrates the three distinct requirements for pull.
Single-piece flow is the easiest to explai
n and understand, but the same princi-
ples apply for any variation whatever the situation. For example, the same
principles apply to high-mix, low-volume operations, and to batching operations
where the quantities between processes may be much larger. This following exam-
ple is the easiest to understand, but the principles can be applied to any situation.
Case Example: Creating One-Piece Flow
Operation A supplies parts to Operation B, which supplies parts to
Operation C.
Is the agreement defined and specified?
Yes. We said it was single-piece flow, so in this case the defined quantity is
implied in the name. (As we will see, implied definition is not sufficient).
What is the specified agreement?
Provide one piece at a time.
When is the piece provided?
When the next operation takes the previous piece (remember the bucket
brigade).
Upon observation, we can determine whether the agreement is
being followed. In this case we see in Fi gure 5-4 that Operation B
is not following the agreement and has exceeded the defined limit
of one piece.
How do we know this is a violation of the agreement?
Operation
A
Operation
B
Operation
C
Figure 5-4. Flow that is not defined
THE TOYOTA WAY FIELDBOOK96
It is implied in the term “single-piece flow” that only one piece will
be between operations. THIS IS NOT GOOD ENOUGH! The agree-
ment needs to be distinct and visible to everyone.
If it is not distinct and visible, what will happen?
The agreement will not be followed, which is a deviation (creates
variation) from the agreed-upon standard (we see that in establish-
ing pull we begin to create a structure to support the next phase—
standardization).
How do we make it visual so that it is easily controlled?
Define and dedicate the space for one piece. The space is outlined with
tape or paint to show that only one piece is permitted, and a sign or
label is added to further clarify this (a taped square on the table is not
completely clear, so a sign is added for clarification of what the square
means), as shown in Figure 5-5.
In addition to the visual markings, the space could be physically limited
(controlled) by allowing only enough room for a single piece. Thi s
technique is especially effective when the parts are oriented vertically
and can be placed into a slot, thus controlling the quantity.
One of the primary benefits of creating flow and establishing defined agree-
ments is that the effect of problems can now be seen easily. In the example
above, if consistent deviation from the agreement occurs and the visual controls
are in place, there is another problem.
When deviation is occurring, this is a clear message of an underlying prob-
lem that needs to be addressed. In this situation managers often state, “They
know what they’re supposed to do, but we can’t get them to do it.” Many
managers make the mistake of blaming the operator for not following the
rules, and in fact the operator is compensating for a problem that needs to be
corrected. Stop, and “stand in the circle” to i denti
fy what the operator is com-
pensating for.
There are generally two reasons for this condition. The first thing to evalu-
ate is whether the agreement is visual and easily understood by everyone; the
Operation
A
Operation
B
Operation
C
1 PC
1 PC
Figure 5-5. Single-piece flow with visually defined agreement
Chapter 5. Create Connected Process Flow 97
second is to look for additional problems that the operators feel compelled to
“work around.”
The primary causes of deviation by operators are:
1. Imbalanced work cycle times that may be due to normal variation in work
content, operator skill, or machine cycle times. Typically, the person with
extra time will deviate.
2. Intermittent work stoppages due to lack of parts or (the fear of) operators
leaving the work area to perform additional tasks—such as retrieving
parts or performing quality checks—machine failures, or correction of
defects.
3. Intermittent work delays due to struggles with machines or fixtures, or
overly difficult or complex tasks.
4. Mi
scellaneous issues such as “building ahead” to “buy time” for change-
over, an operator leaving the line for some reason, or to stagger break or
lunchtimes, or such.
In some situations the correct course of action would be to adjust the defined
quantity of WIP between operations. Single-piece flow requires perfect operation
time balance, which is extremely difficult to achieve. Consider an operation that
will incur natural variations in the work cycle time, such as deflashing an injection-
molded part.
The cycle time wi
ll vary slightly each time because this is largely a manual
task, and no one can complete work cycles with exact precision (Olympic athletes,
after all, do not run every race in the exact time every race). These minor variations
may cause intermittent interruption in the flow. Operators do not like to wait with
nothing to do, so they will naturally add buffer to compensate. The addition of
buffer is the logical choice to compensate for minor time variation; however, the
quantity to add needs to be defined as the standard. Perhaps the defined buffer to
allow for the minor time variations should be two or at most three pieces.
TIP
The Value of Outside Eyes
The problem with communication is that it is hard to understand
why others misunderstand what we clearly understand. The point
of an agreement on a standard is for everyone to have the same
understanding. One simple way to test this is to find someone who
is not familiar with the work area, show her the standard, and ask
her to explain the agreement. You may be surprised to discover
how challenging it is to clearly communicate agreements visually!
THE TOYOTA WAY FIELDBOOK98
Complex Flow Situations
If we consider a different example with a higher degree of complexity, we can
see that it is a derivation of the same concepts. In this example, there are three
different models of product to produce—–Models 1, 2, and 3—and we need the
flexibility to produce any of the models at any time, one at a time. The layout is
shown below in Figure 5-6.
Suppose Operation C is required to produce Model 2. They would remove
the single piece from the defined location between Operation B and Operation
C. This provides a signal to Operation B in accordance with the agreement—an
empty space serves as a signal, and the agreement is that when the customer
pulls a part, it is replaced—to produce a Model 2 part. The layout would now
look like Fi
gure 5-7.
Operation B then removes part 2 between himself and Operation A, causing
Operation A to respond by beginning a Model 2 part. When completed, Operation
B will replenish the defined location between himself and Operation C. The layout
would now look like Figure 5-8.
Again, this is a simplistic model; however, the three required conditions exist
and are supported by visual methods. This basic model works well for produc-
ing high-volume or low-variety products, or for stock items. The primary advan-
tage is the flexibility to produce any of the models at any time and to change
between the models quickly
.
Operation
A
Operation
B
Operation
C
1 PC
1 PC
Model 2
Model 1
Model 2
Model 3
Schedule
1
2
3
1
2
3
Figure 5-6. Layout for single-piece flow with three distinct models
Chapter 5. Create Connected Process Flow 99
Operation
A
Operation
B
Operation
C
1 PC
1 PC
Model 2
Model 1
Model 2
Model 3
Schedule
1
2
3
1
3
Figure 5-7. Layout showing pull by Operation C and signal to produce
Model 2
Operation
A
Operation
B
Operation
C
1 PC
1 PC
Model 2
Model 1
Model 2
Model 3
Schedule
1
2
3
1
3
Figure 5-8. Layout showing replenishment of part, and pull from customer
THE TOYOTA WAY FIELDBOOK100
Pull in a Custom Manufacturing Environment
Because of the simple model (see Figure 5-8), which is based upon the produc-
tion of the same three models of parts again and again, many people believe
that pull in a high-variety or custom production environment is not possible.
This is based on the incorrect assumption that when Operation C produces a
specific model, they will send a “pull signal” to the preceding operation (B) to
make a replacement for that same model. Operation C uses a “1” and Operation
B makes a replacement version of “1.”
What if you have thousands of possible items and some may be used only once
per month? In a high-variety, high-mix, or custom producti
on situation the instruc-
tion on what to produce next (the custom order) would be given to Operation A
rather than C. After completion, Operation A passes the part to Operation B. Then
Operation B would work on this part, complete it, and pass it to Operation C. In
this manner the work “flows through” the subsequent operations. Remember that
flow and pull are not the same thing. The common assumption is that the work
must be pushed to Operation B and Operation C if the instruction to produce is pro-
vided to the beginning of the line (Operation A).
Look back at the distinctions between push and pull. The first element is a
defined agreement between the two part
ies. Is there a defined agreement between
Operation A and Operation B in a custom production situation? Yes, it is still
one piece of work in process. The second element requires that the location be
defined in accordance with the agreement and then dedicated. The space is ded-
icated just as in the previous example. The third element requires a method to
control the production to satisfy the agreement (the standard). How is the pro-
duction controlled? It is controlled the same way—visually.
What is the difference? The only difference is in the agreement of “what the
customer wants.” In this case, the quantity is the same, but what about the model?
The customer processes (B and C) do not dictate the specific model produced by
their supplier. The agreement is that each operation produces the next product
in the same sequence presented by the preceding operation. This is referred to as
“sequenced pull” or “sequenced flow.”
Figure 5-9, below, shows sequenced flow production for a high product vari-
ety situation. Operation A receives the schedule, and has previously produced a
Model 2, Model 1, and another Model 2; and the next item on the schedule is
Model 3. Since there is an open space between Operation A and Operation B, A
has permission to produce the next item on the schedule. The rules of pull are
st
ill followed in that Operation A would not produce if the space were full. The
rule states that an operation can complete the part in process if the customer
space is full, but will not pass the part to the space. The part will remain in the
Chapter 5. Create Connected Process Flow 101
workstation. In effect, Operation B still dictates what to do (build the next item
on the schedule) and when to do it (when the space is empty). If Operation B
completes the part before the signal space for Operation C is empty, the operator
will hold it in the workstation and wait for a signal from Operation C to replenish
the space.
In a high model-mix environment, the level of flexibility is limited by the
lead time from the point-of-schedule introduction to the completion of the prod-
uct. This is dictated by the number of operations that must be “flowed through.”
Instant changes to the schedule will not yield i
nstant changes in the output
because of the flow-through time delay.
For this type of flow to work well, each operator must have the capability to
produce any model that comes at any time. Often the greatest challenge in
establishing sequenced flow in a custom environment is achieving a balance of
operation times. Refer to the case study in the previous chapter for an example
of reducing the high degree of variation often found in a custom production
facility, and how better balance is achieved by defining the time requirements
more narrowly.
What if there is not a perfect balance in cycle times across Operations A,
B, and C? First, ask: “Can each operat
ion consistently perform the task in less
than the customer requirement time—the takt?” Second, if on average the
answer is yes but because of variability, the takt time is often missed, we need
to put in some buffer. The buffer does not have to be an unmanaged push sys-
tem. It can be defined with a specific visual arrangement showing the num-
ber of pieces allowed, e.g., three between stations. And the principle of first
in-first out (FIFO) should be used to prevent a particular part from “cutting
in line.”
Operation
A
Operation
B
Operation
C
1 PC
1 PC
2
1
In Process
2
In Process
In Process
3
Model 2
Model 1
Model 2
Model 3
Schedule
Figure 5-9. Sequenced flow for high product variety production
So we see that flow and pull work hand in hand. Establishing the three ele-
ments necessary for pull then creates defined connections between operations.
These connections are important to surface and highlight problems. They create
a singular process in which all operations are interdependent. This step will sig-
nificantly increase the level of urgency to resolve any interruptions to flow. If a
problem occurs in any operation, it will quickly affect all other operations.
Working around the problem by shifting manpower or machinery, or changing
the schedule, will cause additional problems throughout the entire system
because all operations are linked.
Creating Pull Between Separate Operations
From this understanding of the basics of pull it is possible to design a system
that will be effective in any situation. The single-piece flow model above is
specifically for line- or cell-type operations where the workers pass the product
down the line.
How are the basics applied in operations that are separated physically, or
for operations that produce parts in batches? First of all, it is important to
understand the inherent nature of an operation. Someone well trained in TPS
will understand that at the current time some operations are not conducive to
single-piece flow for some reason. It may be the s
ize of the part (very large or
small), a resource that is shared (has multiple suppliers and/or customers), or has
a limitation in the process, such as changeover times.
For example, the stamping operations at Toyota are not currently capable of
producing one fender, then changing to a hood, and then back to a fender one
piece at a time. The stamping operation has multiple constraints preventing
single-piece flow, and the parts are produced in “lot size” quantities. First, the
size of the equipment prohibits placement next to the customer operation (the
body welding department). Second, the machine (“shared resource”) produces
multiple part models that are required by different customers (the fender is
installed at a different location than the hood), so it is not possible to place the
equipment in proximity to all customers. Also the changeover time, while it is
very good, still limits the ability to make one piece, change over, make another,
and change over again.
How do the basic concepts of define, dedicate, and control apply in this sit-
uation? Start with an understanding of the agreement between the supplier and
the customers. Supply the correct material when requested. All operations must
adhere to the basic rule: “Always satisfy the customer,” or put another way,
“Never short the customer.” This is Rule 1
. Always follow Rule 1! (Note the
paradox of this statement. While it is the goal to always satisfy the customer we
THE TOYOTA WAY FIELDBOOK102