Báo cáo y học: "Validation of actigraphy to assess circadian organization and sleep quality in patients with advanced lung cancer" potx
Bạn đang xem bản rút gọn của tài liệu. Xem và tải ngay bản đầy đủ của tài liệu tại đây (393.72 KB, 12 trang )
RESEARCH Open Access
Validation of actigraphy to assess circadian
organization and sleep quality in patients with
advanced lung cancer
James F Grutsch
1,6*
, Patricia A Wood
2,3
, Jovelyn Du-Quiton
2,3
, Justin L Reynolds
2
, Christopher G Lis
1
,
Robert D Levin
1
, Mary Ann Daehler
1
, Digant Gupta
1
, Dinah Faith T Quiton
2,4
and William JM Hrushesky
1,3,4,5
Abstract
Background: Many cancer patients report poor sleep quality, despite having adequate time and opportunity for
sleep. Satisfying sleep is dependent on a healthy circadian time structure and the circadian patterns among cancer
patients are quite abnormal. Wrist actigraphy has been validated with concurrent polysomnography as a reliable
tool to objectively measure many standard sleep parameters, as well as daily activity. Actigraphic and subjective
sleep data are in agreement when determining activity-sleep patterns and sleep quality/quantity, each of which are
severely affected in cancer patients. We investigated the relationship between actigraphic measurement of
circadian organization and self-reported subjective sleep quality among patients with advanced lung cancer.
Methods: This cross-sectional and case control study was conducted in 84 patients with advanced non-small cell
lung cancer in a hospital setting for the patients at Midwestern Regional Medical Center (MRMC), Zion, IL, USA and
home setting for the patients at WJB Dorn Veterans Affairs Medical Center (VAMC), Columbia, SC, USA. Prior to
chemotherapy treatment, each patient’s sleep-activity cycle was measured by actigraphy over a 4-7 day period and
sleep quality was assessed using the Pittsburgh Sleep Quality Index (PSQI) que stionnaire.
Results: The mean age of our patients was 62 years. 65 patients were males while 19 were females. 31 patients
had failed prior treatment while 52 were newly diagnosed. Actigraphy and PSQI scores showed significantly
disturbed daily sleep-activity cycles and poorer sleep quality in lung cancer patients compared to healthy controls.
Nearly all actigraphic parameters strongly correlated with PSQI self-reported sleep quality of inpatients and
outpatients.
Conclusions: The correlation of daily activity/sleep time with PSQI-documented sleep indicates that actigraphy can
be used as an objective tool and/or to complement subjective assessments of sleep quality in patients with
advanced lung cancer. These results suggest that improvements to circadian function may also improve sleep
quality.
Background
Living organisms use circadian (about 24-hour) oscilla-
tors a nd environmental cues to adjust the dynamics of
their physiological/behavioral processes to critical phases
of the geophysical day [1,2]. Preclinical and clinical data
show that circadian organization diminishes with accel-
erating tumor growth and accurately predicts poor
prognosis, while restoring normal circadian function
improves quality of life and enhances the survival bene-
fits of chemotherapy [3-7].
Satisfying sleep is an important sign of a robust and
well-entrained endogenous circadian time structure.
Poor nighttime sleep quality is associated with reduced
quality of life and unremitting daytime fatigue. Each of
these traits is linked to diminished cancer patient survi-
val [8-10]. Surveys of sleep disturbances betw een differ-
ent groups o f cancer patients report prevalence rates
from a low of 24% to a high of 95% [9]. These
* Correspondence:
1
Cancer Treatment Centers of America at Midwestern Regional Medical
Center, Zion, IL, USA
Full list of author information is available at the end of the article
Grutsch et al. Journal of Circadian Rhythms 2011, 9:4
/>© 2011 Grutsch et al; licensee BioMed Central Ltd. This is an Open Access article distributed under the terms of the Creative Commons
Attribu tion License (h ttp://creativecommons.org/licenses/by/2.0), which permits unrestr icted use, distribution, and reproduction in
any medium, provided the original work is properly cite d.
observations suggest that circadian organization has the
potential to tell us a great deal about the overall health
of cancer patients [7].
Wrist actigraphy is a noninvasive tool for assessing the
24-hour sleep-activity cycle by monitoring continuous
non-dominant wrist movements [11]. Actigraphy has
been validated with concurrent polysomnography to
objectively measure many standard sleep quality and
quantity parameters as well as daily activity of healthy
individuals [11-15]. Care has been taken to fully specify
the instrumentation type, sampling mode and analysis
tools in order to allow inclusion of this study in the
growing database of cancer studies using actigraphy
[16].
This report investigates the hypothesis that advanced
lung cancer patients’ circadian activity rhythm correlates
with patient’s self report o f nighttime sleep quality . This
report also assesses whether chronic obstructive pul-
monary disease (COPD) status a nd severity confounds
the relations hip betwee n self-report of sleep quality and
their measured circadian function among ad vanced lung
cancer patients.
The primary goal of the study is to determine whether
and how the circadian organization of cancer patients is
affected by the cancer-bearing state. The secondary goal
is to determine whether and how objective measurement
of activity and sleep using actigraphy can quantify can-
cer-associated circadian disruption. The tertiary goal is
to determine the relationship between these objective
measure ments of circadian organization and subjectively
reported nighttime sleep and daytime fatigue. Finally, we
assess, whether and how hospitalization and chronic
obstructive lung disease mask these circadian
relationships.
Methods
Protocol Summary
The study was conducted concurrently at Cancer Treat-
ment Centers of America (CTCA) at Midwestern Regio-
nal Medical Center (MRMC), Zion, Illinois, USA and
the WJB Dorn Veterans Medical Center (VAMC),
Columbia, South Carolina, USA, from June 2002 to
April 2006. Forty-two eligible patients who were about
to undergo chemotherapy for advanced lung cancer
were enrolled at each site. All patients were asked to
complete the Pittsburg Sleep Quality Index (PSQI) ques-
tionnaire prior to their first chemotherapy treatment.
For the MRMC patients, actigraphy was performed at
the inpatient setting before and during their first che-
motherapy cycle, while for the VAMC patients, actigra-
phy data were obtained in the outpatient/ho me setting
prior to the initiation of chemotherapy. Henceforth, we
refertoMRMCpatientsasinpatients while VAMC
patients as outpatients. Actigraphic data of healthy
controls were obtained from the A mbulatory Monitor-
ing, Inc (AMI) database. Presence and severity of COPD
was obtained through clinical review of the current
medical records of the patients in VAMC. This informa-
tion was not available for MRMC inpatients.
Patients
Patients, between the ages of 18 and 94 were studied.
Each had a pathologically confirmed diagnosis of
advanced stage (IIB, IIIA, IIIB, IV) or recurrent non-
small cell lung cancer (NSCLC), with either bidimen-
sionally measurable or evaluable u nresectable disease,
including histologically positive ascites and histological ly
positive pleural effusion, and an Eastern Coo perative
Oncology Group (ECOG) perfor mance status of 0, 1, or
2. ECOG scores stratify patient’s performance status on
a sc ale of 0 (denoting perfect health) to 5 (de ad). In this
investigation, patients were restricted to scores of 0, 1
(fully active but symptomatic), and 2 (capable of self-
care and able to carry out work of a light or sedentary
nature). Untreated patients and pa tients who had failed
one prior chemothera py treatment regimen were eligible.
Ineligible patients included those with medical conditions
that precluded administration of chemotherapeutic
agents, such as inadequate renal function with serum
creatinine > 221 mmol × 10
-1
, inadequate hepatic func-
tion with bilirubin > 34.2 mmol × 10
-1
, uncontrolled con-
gestive heart failure; uncontrolled hypertension,
arrhythmia, or angina; carcinomatous meningitis; or
uncontrolled infection. Patients with a h istory of brain
metastases, or another uncontrolled primary cancer were
ineligible. All patients signed an Informed Consent indi-
cating that they were aware of the investigational nature
of the study. The Institutional Review Boards at MRMC
and VAMC approved the study. This current report is
based on data obtained at initial enrollment.
Actigraphy Measurements of Sleep/Activity Cycles
A watch-like wrist actigraph, worn on the non-dominant
wrist, was used to record a patient’s level and pattern of
gross motor activity (Mini Motionlogger Basic model,
Ambulatory Monitoring, Inc, AMI). Internal mo tion
sensors capture patient movement data, measured as the
number of accelerations per minute (Zero Crossing
Mode). Sleep is reflected by spans without accelerometer
movements as validated by AMI using formal sleep lab
studies. These movement data ar e transferred to a com-
puter for analysis to produce a report containing para-
meter s of sleep and wake periods, their timing, duration
and other characteristic details. For each patient, the fol-
lowing parameters were used to describe the activity
phase of t he daily circadian cycle: mean daily activity
(activity mean), mean duration of activity during con-
ventional wake periods (wake minutes), mean duration
Grutsch et al. Journal of Circadian Rhythms 2011, 9:4
/>Page 2 of 12
of sleep during conventional wake periods (sleep min-
utes), proportion of conventio nal wake period s spent
sleeping (% sleep), number of sleep episodes during con-
ventional wake periods (sleep episodes), frequency of
long naps (long sleep episodes > = 5 minutes). During
the presumed sleep phase of the circadian cycle, the fol-
lowing parameters were evaluated: mean duration of
wakefulness (wake minutes), number of sleep interrup-
tions (wake episodes), frequency of long sleep interrup-
tions (long wake episodes > = 5 minutes), proportion of
sleep span spent actually sleeping (% sleep), sleep
latency, sleep efficiency, frequency of long sleep episodes
(long sleep episodes).
Site Differences in Actigraphy
Each patient’s baseline sleep/activity cycle was measured
prior to or during the first cycle of therapy, to ach ieve a
minimum of 48 hours of high quality continuous activity
data. The timing and conditions of actigraphy measure-
ment were necessarily different at each of the two sites.
Because MRMC is a tertiary cancer center, actigraphy
data were recorded in the in-patient setting prior to and
often during the administration of the first cycle of che-
motherapy. Actigraphy was recorded in the patient’s
home for 4-7 days in VAMC patient s. The difference in
activity between in- and out-patients is substantial and
confounding. Consequently, all analyses of actigraphic
wake/sleep parameters are stratified by site. There were
no site differences in prior treatment, cancer stage, and
ECOG performance status.
Patient Therapy
All patients receive d identical chemothe rapy consisting
of Cisplatin 25 mg/m
2
and Etoposide 100 mg/m
2
each
on days 1, 2, and 3. This regimen was repeat ed every 28
days.
Determination of Presence and Severity of COPD
COPD, which i s present in the majority of lung cancer
patients, is a potential confounding variable for this
investigation of sleep and circadian time structure. All
outpatients, but no inpatients, were assessed clinically
and with pulmonary function tests for the presence of
COPD. Its severity was graded according to the Spiro-
metric Classification of COPD severity, by reference to
percent of predicted forced expiratory volume in one
second (FEV
1
). Thirty to 50% percent of predicted FEV
1
is considered severe; moderate is 50% to 89% percent;
and mild COPD is greater than 80% of predicted FEV
1.
No such data are available for MRMC patients.
PSQI
Patient’s sleep quality was assessed through the PSQI,
which is a questionnaire that assesses sleep quality and
quantity over a one-month span. The PSQI contains 19
items that comprise an overall sleep score. It produces
separate scores in seven component domains: subjective
sleep quality, sleep latency, sleep duration, habitual sleep
efficiency, sleep disturbances, use of sleep medication,
and daytime dysfunction. The seven component scores
are t otaled to produce a Global Sleep Quality Score for
each patient. The questionnaire requires the patient to
describe patterns of sleep such as typical bedtime and
wake time, length of time taken to fall asleep, and actual
sleep time. The patient then answers a series of ques-
tions relating to sleep habits and quality. Component
scores are based on a four-point Likert sc ale that r anges
from Very Good (0) to Very Bad (3). The component
scores are combined to produce the Global Sleep Qual-
ity Score ranging from 0 to 27. Those having a score
greater than 5 are considered poor sleepers, but among
cancer patients those with a score greater than eight
have been considered poor sleepers [17].
Statistical Analysis
Descriptive statistics were computed for numeric demo-
graphic factors and actigraphy endpoints to describe the
average and variability of the population. Frequency and
percentages were computed for qualitative factors such
as sex. Either parametric or non-parametric analysis of
variance, whichever was appropriate, was used to deter-
mine differences among factor levels (SAS v 9.1, Cary,
NC). For four to seven days, an actigraphy watch
recorded the number of accelerations per minute. This
data was translated into sleep/activity parameters
through the Act Millenium and Action W2 software
(Ambulatory Monitoring, Inc). Rhythmometric analysis
(using Chronolab v2) was done on these sleep/activity
patterns in order to assess d isruption and consolidation
of sleep in lung cancer patients. Rhythmometric analysis
fits a cosine curve to the circadian activity providing
three standard parameters: mesor (the average activity
over the 24-hr period), amplitude (1/2 peak to nadir dif-
ference) and acrophase (the time of peak activity). In
addition to these parameters, we also computed the cir-
cadian quotient (amplitude/mesor) to characterize the
strength of the circadian rhythm and the rhythm quotient
[A
24 HR
/(A
4
+A
8
+A
12
)]. In our patients, higher amplitudes
are often associated with more robust rhythms; for exam-
ple, people who move vigorously d uring the day and
sleep soundly during each night would have higher
amplitudes. The circadian quotient provides normalized
values that would allow comparison between individuals
[18,19]. Activity patterns of normal people usually have 1
or 2 major circadian components and best rhythm fit are
24 hours or 12 hours. The rhythm quotient provides a
basis for the quality of circadian rhythms and how well
activity and sleep are each consolidated within the day.
Grutsch et al. Journal of Circadian Rhythms 2011, 9:4
/>Page 3 of 12
Higher rhythm quotient indicates a more pronounced
circadian rhythm and lower values indicate fractured
sleep-activity patterns. Further, circadian rhythms were
assessed through spectral density analysis where 24-hr
autocorrelations (r
24
) were computed. Autocorrelations
theoretically can range from -1 to +1. If a circadian varia-
tion is present, autocorrelations will increase near the 24-
hour period and a more pronounced circadian rhythm
will result in a higher autocorrelation at 24-hour. Aside
from these parameters, day-night balance of activity as
well as sleep was also calculated. Day-Night Activity bal-
ance is the ratio of amount of activity during the day ver-
sus activity during the night, similarly, ratios of sleep
during the night over sleep during the day is called the
Night-Day Sleep balance.
Cosinor Analysis
To uncover underlying daily rhythms and describe the
shape and relationships of these recurring patterns
across time in the dat a sets, each time series was ana-
lyzed for about 24 hours [20], with use of the Chronolab
statistical package [21]. This method of time series ana-
lysis tests for the presence of a cosine-shaped pattern of
an a priori defined period l ength in each data set. If sig-
nificant, it confirms the presence of a recurring cycle or
rhythm in the data, as opposed to random variation or a
trend occurring across the entire observation span. Cosi-
nor analysis is analogous to the linear regression testing
by ‘’least squares’’ of a best-fitting strai ght line to a data
set when searching for a linear increasing or decreasing
trend and subsequently determining the probability that
the s lope of the best-fitting line is different from zero.
Using the same technique, the cosinor method fits a
best-fitting cosine function instead of a straight line.
Theprobabilitythattheamplitudeofthecosinefunc-
tion best fitting these data is g reater than zero is calcu-
lated based upon the reduction in variance about the
fitted cosine compared to the total variance about the
arithmetic mean (flat l ine). If the zero-amplitude
hypothesis can be rejected with 95% certainty, statistical
significance of a modula tion that approximates the
length (period) of the cosine is accepted at p < = 0.05.
Rhythm parameters of ‘’mesor,’’ ‘’acrophase,’’ and
‘’amplitude’’ can then be d erived from the cosine model
used. The ‘’mesor’’ is the mean of the rhythm and repre-
sents the middle value of the fitted cosine. The series
mesor and me an are identical if the data are equidistant
across the sampling span, but the y are not identical if
sampling is irregular or the time span is not an integral
number of the longest period being fitted, or both. The
‘’acrophase’’ is the time from a phase reference (08) to
the peak of the cosine function that best describes the
data. In our analyses, the fitted period, 24 hours, i s
referenced to local midnight as 0 degrees to 360 degrees
the next local midnight. The ‘’amplitude’’ is the height
of the best-fitting cosine function from the mesor to the
Table 1 Distribution of demographic/clinical traits by site and summary of PSQI scores
1A
All Patients Inpatients Outpatients Site Effect
Demographic/Clinical (n = 84) (n = 42) (n = 42) (c
2
,p)
a
Age in years (Mean; Range) 62 (40-94) 57(40-78) 66(47-94) 4.0, <0.01
Sex (M:F)
b
65:19 23:19 42:00:00 24.6, <0.01
Cancer Stage (IIB:IIIA&B: IV)
b
1:18:65 0:10:32 1:08:33 NS
Prior Therapy (Yes:No)
b
31:52 21:20 10:32 NS
WHO ECOG (0:1:2)
b
30:42:11 17:18:07 13:24:04 NS
COPD (No: Mild: Mod: Severe) ND ND 14:7:13:8 ND
1B
All Patients Inpatients Outpatients Site Effect
PSQI Sleep Factor (n = 64) (n = 37) (n = 35) (t, p)
a
Sleep Quality 1.40 ± 0.11 1.23 ± 0.14 1.56 ± 0.16 NS
Sleep Latency 1.48 ± 0.12 1.46 ± 0.16 1.50 ± 0.18 NS
Sleep Duration 1.63 ± 0.14 1.62 ± 0.20 1.63 ± 0.20 NS
Sleep Efficiency 1.65 ± 0.16 1.57 ± 0.23 1.74 ± 0.21 NS
Sleep Disturbance 2.11 ± 0.12 1.80 ± 0.17 2.30 ± 0.15 5.6, 0.02
Sleep Medication 0.78 ± 0.12 0.81 ± 0.17 0.75 ± 0.17 NS
Daytime Dysfunction 1.34 ± 0.13 1.16 ± 0.16 1.52 ± 0.20 NS
Global Sleep Quality Score 11.19 ± 0.66 10.86 ± 0.93 11.54 ± 0.94 NS
a
Based on t-test (t, p-value).
b
Values are numbers of patients.
c
Owen et al (1999) 26, 1649-51; NS = not significant; ND = no data available
a
Based on t-test (t, p-value)
Grutsch et al. Journal of Circadian Rhythms 2011, 9:4
/>Page 4 of 12
acrophase and is one-half of the full variation from
trough to peak of the co-sine, which indicates a predict-
able range of change.
Results
Patient Actigraphy, PSQI Data and Site Characteristics
There were systematic institutional differences in demo-
graphic and clinical status of participants between the
two sites (Table 1A and 1B). All forty-two patients from
VAMC were males while only 23 of 42 patients from
MRMC were males. VAMC patients were older; with a
mean age of 66 compared t o MRMC patients mean age
of 57 years. Fifty percent and 26% from MRMC and
VAMC, respectively, had failed previous cancer treat-
ment. Twelve actigraphs were worn for less than 48
hours and/or had missing observations, due to instru-
ment malfunction. Out of the 72 patients with complete
actigraph recordings, four patients failed to respond to
the PSQI question naire, so we ha ve complete actigraphy
and questionnaire data for 68 (35 inpatients, 33 outpati-
ents) of the 84 enrolled patients.
Patient Provided Sleep Outcomes by PSQI
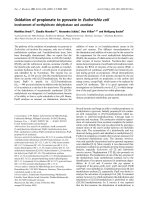
Lung canc er patients’ mean Global PSQI score was
11.19 ± 0.66, which exceeds the threshold score of 8 for
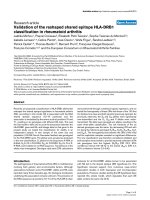
poor quality sleep (Table 1) [17]. PSQI scores of lung
cancer patients demonstrate poorer sleep quality, sleep
latency, sleep duration, sleep efficiency, and more day-
time dysfunction and sleep disturbance when compared
to healthy controls (Figure 1).
Sleep Quality
0
0.2
0.4
0.6
0.8
1
1.2
1.4
1.6
1.8
2
Inpatients Outpatients Healthy
Controls
Average PSQI score
Sleep Latency
0
0.2
0.4
0.6
0.8
1
1.2
1.4
1.6
1.8
Inpatients Outpatients Healthy
Controls
Average PSQI score
Sleep Duration
0
0.2
0.4
0.6
0.8
1
1.2
1.4
1.6
1.8
2
Inpatients Outpatients Healthy
Controls
Average PSQI score
Sleep Efficiency
0
0.5
1
1.5
2
2.5
Inpatients Outpatients Healthy
Controls
Average PSQI score
Sleep Medications
0
0.2
0.4
0.6
0.8
1
1.2
Inpatients Outpatients Healthy
Controls
Self-rated sleep medications score
Sleep Disturbance
0
0.5
1
1.5
2
2.5
3
Inpatients Outpatients Healthy
Controls
Average PSQI score
Daytime Dysfunction
0
0.2
0.4
0.6
0.8
1
1.2
1.4
1.6
1.8
Inpatients Outpatients Healthy
Controls
Average PSQI score
Global Slee p Quality
0
2
4
6
8
10
12
14
Inpatients Outpatients Healthy
Co
n
t
r
o
l
s
Average PSQI score
Figure 1 PSQI-measured sleep quality differences between inpatients, outpatients and healthy controls. Lung cancer patients
demonstrate poorer sleep quality, quantity and more daytime dysfunction when compared to healthy subjects.
Grutsch et al. Journal of Circadian Rhythms 2011, 9:4
/>Page 5 of 12
Ther e was no sig nificant difference in sleep quality by
site; 83.88% of MRMC patients had a Global PSQI score
of 5 or more and 64.86% had score of at least 8, while
85.71% of VAMC patients had Global PSQI score of at
least 5 and 82.86% had score of at least 8. Only sleep
disturbancedifferedbysite,whereoutpatientscores
were statistically significantly worse than inpatients (c
2
= 5.6, p = 0.02; Table 1).
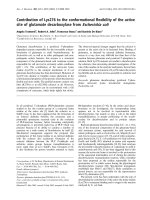
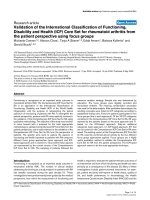
There were statistically significant associations
between ECOG performance status and sleep distur-
bance (e.g., nightmares, breathing difficulty, etc; c
2
=
4.1, p = 0.04, Figure 2) and greater daytime dysfunction
(e.g., staying awake while working, driving etc; c
2
=8.3,
p = 0.02; data not shown).
Table 2 Actigraphic activity-sleep characteristics during the wake period and sleep period of non-small cell lung
cancer patients compared to population-based controls
Wake Period Sleep Period By Site
Actigraphic Parameters All patients Population controls All patients Population controls Inpatients Outpatients
Cases 68 35 68 35 35 33
Mean activity(accel/min) 126.9 ± 4.9* 182.6 ± 25 ND ND 111.7 ± 7.1 143.0 ± 5.6
Wake minutes 797.5 ± 26* 947.1 ± 10.9 95.0 ± 8.8* 31.1 ± 3.6 714.2 ± 36 885.8 ± 31
Sleep minutes 208.8 ± 18* 47.1 ± 10.9 284.0 ± 18.3* 417.8 ± 9.4 241.3 ± 25 174.4 ± 24
% Sleep 20.9 ± 1.8* 4.7 ± 0.7 72.5 ± 2.0* 93.0 ± 0.8 25.8 ± 2.8 15.6 ± 1.9
Duration of longest sleep (min) 43.0 ± 2.8* 23.6 ± 0.6 91.7 ± 7.4* 225.6 ± 17 45.4 ± 4.0 40.5 ± 3.9
Sleep Latency NA NA 20.8 ± 2.5* 12.1 ± 6.9 NA NA
Sleep Efficiency NA NA 79.8 ± 1.7* 95.9 ± 0.7 NA NA
*p < 0.05 compared to controls
2.3
1.1
0.9
2.5
1.8
1.0
0
0.5
1
1.5
2
2.5
3
3
.5
012
ECOG Performance Status
PSQI Daytime Dysfunction score
Inpatients
Outpatients
Figure 2 Among both inpatients and outpatients, the
relationship between ECOG performance status and PSQI
domain score in daytime dysfunction worsened with
worsening performance status score.
W
a
k
e
Mi
nutes
0
100
200
300
400
500
600
700
800
900
1000
All Patients Healthy
Controls
All Patients Healthy
Controls
Average Wake Minutes
Daytime Nighttime
Sleep Minutes
0
50
100
150
200
250
300
350
400
450
All Patients Healthy
Controls
All Patients Healthy
Controls
Average Sleep Minutes
Daytime Nighttime
Duration of Longest Sleep Episode
0
50
100
150
200
250
300
All Patients Healthy
Co
ntr
o
l
s
All Patients Healthy
Co
ntr
o
l
s
Average Sleep Minutes
Daytime Nighttime
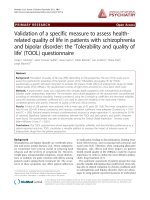
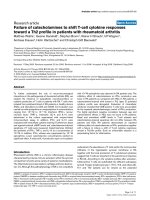
Figure 3 Objective actigraphic parameters that illustrate
daytime dysfunction among cancer patients when compared
to healthy controls.
Grutsch et al. Journal of Circadian Rhythms 2011, 9:4
/>Page 6 of 12
Concomitant Relevant Illness
COPD and lung cancer share a common etiology and
produce similar symptoms. Consequently, they each
potentially a ffect the patients’ sleep quality. In outpati-
ents, 67% suffered documented COPD, 20% (8 of 42)
had severe, 31% (13 of 42) had moderate and 16% (7 of
42) had mild COPD (Table 1). Two of the 27 measured
PSQI comp onents had a s tatistically significant associa-
tion with COPD severity; global PSQ I score (two-sided
Fisher’s Exact test, p = 0.0238; data not shown) and
habitual sleep efficiency (two-sided Fisher’s Exact te st, p
= 0.0022; data no t shown). The p resence and severity of
COPD did not affect any of the relationships of acti-
graphic circadian organization and sleep quality.
Actigraphy Lung Cancer Patient Data Compared To
Normal Controls
Actigraphic parameters of all cancer patients during the
Wake Period and the Sleep Period, from both sites,
were considered grossly abnormal when compared to
healthy individuals (Action-W v.2 database, Ambulatory
Monitoring, Inc.). This control database is comprised of
3-day actigraphy measurements of 35 adults, aged 20-50
years having no known disease.
During the Wake Period of putative activity, cancer
patients were 20 to 50% less active than the controls
(Table 2; Figure 3). The patients were inactive or nap-
ping at least three times longer than the c ontrols (%
sleep: 20.9% versus 4.7%) and these episodes of inactivity
or napping were longer than those occurring in healthy
individuals. During the nightly sleep span, lung cancer
patients had more and longer waking episodes than con-
trols. The duration of nighttime sleep for the patients
was diminished by 35% compared to controls and the
duration of the longest sleep episode was approximately
40% of controls. T here were no gender differences in
any actigraphic parameter among inpatients, where
females were studied.
Actigraphic circadian organization differed by site
(Table 2). Outpatients were, on average, much more
active than inpatients during the day and they consoli-
dated activity much better than the inpatients. During
the sleep phase, actigraphy at both sites we re indistin-
guishable. These prominent site differences in actigraphy
collection protocols required that the data be analyzed
by site.
Correlation between Actigraphy and PSQI
Usual Wake Period
Nearly all actigraphy parameters measured in outpati-
ents during the usual Wake Period correlated with PSQI
self-reported measures of sleep quality, but only a few
Table 3 Correlation of PSQI components and Actigraphy during the Usual Wake Period by Site
a
Actigraphy Parameters
(Wake Period)
PSQI Sleep
Medicine Use
PSQI Daytime Dysfunction Global PSQI Score
Inpatients (n = 35)
Activity Mean ns ns ns
Sleep Minutes 0.39(0.05) ns ns
% Sleep -0.37(0.064) ns ns
Wake Episodes ns ns ns
Mean Wake Episode ns ns ns
Long Wake Episode ns -0.46(0.03) ns
Sleep Episodes ns ns ns
Mean Sleep Episode -0.41(0.035) ns ns
Long Sleep Episode ns ns ns
Longest Sleep Episode -0.41(0.04) ns ns
Outpatients (n = 33)
Activity Mean -0.58(0.003) -0.61(0.006) -0.48(0.014)
Sleep Minutes ns 0.54(0.017) 0.41(0.036)
% Sleep ns 0.45(0.053) 0.37(0.06)
Wake Episodes 0.40(0.047) ns ns
Mean Wake Episode -0.52(0.008) ns -0.43(0.027)
Long Wake Episode 0.34(0.096) ns ns
Sleep Episodes 0.40(0.047) ns 0.35(0.078)
Mean Sleep Episode ns 0.62(0.004) ns
Long Sleep Episode ns 0.46(0.047) 0.43(0.029)
Longest Sleep Episode ns 0.61(0.005) 0.45(0.02)
a
Correlations are shown only for p-values < 0.05; ns = not significant; p-values are in ( ).
Grutsch et al. Journal of Circadian Rhythms 2011, 9:4
/>Page 7 of 12
parameters correlated among inpatients. Among outpati-
ents, there were statistically significant correlations
between patients’ levels of daytime activity and lower
use of sleep medication as self-reported in the PSQI (r =
-0.58, p < 0.01; Table 3), lower PSQI reported day time
dysfunction (r = -0.61, p < 0.01) and better overall PSQI
sleep quality (r = -0.48, p = 0.01). Among inpatients,
more daytime inactivity (sleep minutes) was associated
with higher self-reported use of sleep medications (r =
0.39, p = 0.05), more daytime dysfunction (r = 0.54, p =
0.02) and lower PSQI global sleep quality (r = 0. 41, p =
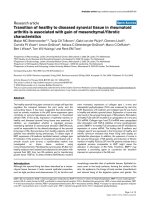
0.04) (Table 3). Two PSQI measures are plotted against
two corresponding actigraphy parameters to demon-
strate the correlation (Figure 4).
Conventional Sleep Period
There were statistically significant correlations between
actigraphy parameters measuring sleep and the PSQI
parameters of sleep duration, sleep efficiency, sleep dis-
turbance, sleep medication, daytime dysfunction and
global PSQI sleep quality (Table 4). Among outpatients,
the num ber of wake episodes during the night was asso-
ciated with more sleep disturbance (r = 0.63, p < 0.01)
and daytime dysfunction ( r = 0.55, p = 0.02), but it was
associate d with more sleep medication among inpatients
(r = 0.34, p = 0.09; Table 4). W ake after sleep onset is
significantly a ssociated with poorer global sleep quality
studied in these patients homes (r = -0.46, p = 0.02).
The duration of sleep latency is correlated with the use
of sleep medication in both i npatients (r = 0.62, p <
0.01) and outpatients (r = -0.38, p = 0.06). Furthermore,
for outpatients, t here were significant correlations
between actigraphically-measured nighttime sleep epi-
sodes and the PSQI parameters of sleep disturbance (r =
-0.63, p < 0.01), daytime dysfunction (r = -0.57, p =
0.01) and global sleep quality (r = -0.49, p = 0.01).
These associations were apparently masked by
hospitalization.
Actigraphic Circadian Parameters
Activity and sleep, considered togethe r, create daily
sleep-activity rhythms. In outpatients, higher daily mean
activity is associated with lower sleep medication use (r =
-0.45, p = 0.02; Table 5) and a higher circadian amplitude
of activity is associated with less daytime dysfunction (r =
-0.45, p = 0.05). Moreover, outpatients who exhibit
higher 24-hour rhythm quotients suffer less daytime dys-
function (r = -0.58, p < 0.01), while these associations are
not evident among hospitalized patients (Table 5).
Patients who sleep less during the day and c onsolidate
sleep well during the night, as measured by Day-Night
Sleep Balance, sleep longer, regardless of study site (inpa-
tients: r = 0.43, p = 0.016; outpatients: r = 0.43, p < 0.03).
Higher levels of night-day sleep balance are likewise asso-
ciated with less nighttime sleep disturbance (r = -0.44, p
= 0.067), less day time dysfunction (r = -0.43, p = 0.065)
and better global PSQI sleep (r = -0.36, p = 0.071) in out-
patients, but not in inpatients (Table 5). Table 6 illus-
trates all relationships that occur when data for both sites
are combined. These overall relationships are the most
robust as they occur across both sites. To illustrate the
relationship between PSQI and actigraphy, we cont rasted
the circadian rhythm of activity (accelerations/0.5 hr) in a
patient with a normal Global PSQI score and a pa tient
with a typically poor Global PSQI score (Figure 5). We
also demonstrate the differences in 3 actigraphic sleep/
wake parameters between the study patients and healthy
controls.
Correlation between COPD and Actigraphy
No statistically significant association was found
between any actigraphic parameter of activity or sleep
and C OPD presence or severity in this patient popula-
tion in which this potentia l covariate was recorded. Post
Mean actigraphic daytime activity
(accelerations / min)
0 50 100 150 200 250
PSQI daytime dysfunction score
0.0
0.5
1.0
1.5
2.0
2.5
3.0
3.5
Actigraph
normal range
PSQI
normal range
(r = -0.61; p=0.006)
outpatients
inpatients
(r=0; p=ns)
Mean actigraphic daytime activity
(accelerations / min)
0 50 100 150 200 250
PSQI daytime dysfunction score
0.0
0.5
1.0
1.5
2.0
2.5
3.0
3.5
Actigraph
normal range
Actigraph
normal range
PSQI
normal range
PSQI
normal range
(r = -0.61; p=0.006)
outpatients
inpatients
(r=0; p=ns)
(r = -0.61; p=0.006)
outpatients
inpatients
(r=0; p=ns)
(r = -0.61; p=0.006)
outpatients
inpatients
(r=0; p=ns)
Mean actigraphic wake episodes
0 5 10 15 20 25 30
0.5
1.0
1.5
2.0
2.5
3.0
3.5
(r = -0.63; p=0.005)
outpatients
inpatients
(r=0; p=ns)
PSQI sleep disturbance score
Actigraph
normal
range
PSQI
normal range
Mean actigraphic wake episodes
0 5 10 15 20 25 30
0.5
1.0
1.5
2.0
2.5
3.0
3.5
(r = -0.63; p=0.005)
outpatients
inpatients
(r=0; p=ns)
(r = -0.63; p=0.005)
outpatients
inpatients
(r=0; p=ns)
(r = -0.63; p=0.005)
outpatients
inpatients
(r=0; p=ns)
PSQI sleep disturbance score
Actigraph
normal
range
PSQI
normal range
PSQI
normal range
A
B
Figure 4 Relationship of Subjective (PSQI) and Objective
(Actigraphy) assessments of activity (A) and wakefulness
during sleep (B). Correlations between the two assessments are
the most robust among outpatients, while actigraphic parameters
were potentially masked in inpatients.
Grutsch et al. Journal of Circadian Rhythms 2011, 9:4
/>Page 8 of 12
traumatic stress disorder (PTSD) effects could not be
discovered as only t wo of the eighty four patients were
diagnosed with this syndrome.
Discussion
Actigraphy measurements confirm patient self-report of
abnormal sleep quality and correlate with one another.
Our patients’ mean nocturnal sleep span is 4.7 hours
compared to the adult normal sleep span of seven to
nine hours [22]. Healthy adults take less than 20 min-
utes to fall asleep after going to bed, but our patients
took more than twice as long [23]. Normally adults awa-
ken two to six times per night and remain awake for a
total of less than 40 minutes [24,25], but our patients’
mean awake time during the nighttime was 95 minutes.
Daytime inactivity in our control population was 46.5
minutes, while o ur patients’ daytime napping time was
3.5 hours/day. Finally, the patients’ daily activity rhythm
for both sites was seve rely damped in comparison to the
population-based control group.
All patients’ PSQI scores reveal poor quality sleep. There
were strong correlations between the severity of daily activ-
ity-sleep time structure abnormalities and self-reported
PSQI scores. The se correlations indicate that the actigraphic
measure of sleep and activity can accurately and quantita-
tively confirm t he patient s elf-report of sleep qua lity.
In addition to a dysfunctional circadian activity
rhythm, many of the patien ts have COPD, which can
contribute to insomnia and sleep maintenance problems.
Although two of the seven components of the PSQI
showed a statistically significant association with
increasing COPD severity, there w as no correlation
between COPD and any actigraphy parameter. COPD,
therefore, influences patients’ sleep quality indepen-
dently of the host’s circadian function.
Table 4 Correlation of PSQI components and Actigraphy during the Usual Sleep Period
Actigraphy Parameters
(Sleep Period)
PSQI Sleep Disturbance PSQI Sleep Medicine Use PSQI Daytime Dysfunction Global PSQI Score
Inpatients (n = 35)
Wake Minutes ns 0.44 (0.025) ns ns
Wake Episodes ns 0.34 (0.09) ns ns
Mean Wake Episode ns 0.40 (0.043) ns ns
Long Wake Episode ns 0.47 (0.014) ns ns
Longest Wake Episode ns 0.41 (0.038) ns ns
Wake After Sleep Onset ns 0.35 (0.077) ns ns
Sleep Latency ns 0.62 (< 0.001) ns ns
Sleep Efficiency ns ns ns ns
Sleep Episodes ns 041 (0.038) ns ns
Long Sleep Episode ns ns ns ns
Outpatients (n = 33)
Wake Minutes ns ns ns ns
Wake Episodes 0.63 (0.005) ns 0.55 (0.015) 0.49 (0.01)
Mean Wake Episode ns ns ns ns
Long Wake Episode ns -0.43 (0.031) ns ns
Longest Wake Episode ns ns ns ns
Wake After Sleep Onset ns ns ns -0.46 (0.018)
Sleep Latency ns -0.38 (0.058) ns ns
Sleep Efficiency ns ns ns ns
Sleep Episodes -0.63 (0.005) ns -0.57 (0.011) -0.49 (0.011)
Long Sleep Episode -0.53 (0.023) ns -0.47 (0.043) -0.41 (0.035)
a
Correlations are shown only for p-values < 0.05; ns = not significant; p-values are in ( ).
0
1000
2000
3000
4000
5000
6000
7000
8000
0 1 2 3 4 5 6 7 8 9 1011121314151617181920212223
Clock Time (Hours)
Normal PSQI score
(Patient#103-30, Score=2)
Abnormal PSQI score
(Patient#103-35, Score=21)
Activity (accelerations/0.5hr)
0
1000
2000
3000
4000
5000
6000
7000
8000
0 1 2 3 4 5 6 7 8 9 1011121314151617181920212223
Clock Time (Hours)
Normal PSQI score
(Patient#103-30, Score=2)
Abnormal PSQI score
(Patient#103-35, Score=21)
Activity (accelerations/0.5hr)
Figure 5 Actigraphy pattern of two patients who had normal
and abnormal PSQI Global Sleep Scores. The 24 hr pattern of
activity of a lung cancer patient who had an overall PSQI Global
Sleep Score of 2 (normal, upper curve) is more rhythmic than the
flattened daily activity pattern of a patient who scored 21
(abnormal, lower curve) on the overall PSQI Global Score.
Grutsch et al. Journal of Circadian Rhythms 2011, 9:4
/>Page 9 of 12
Our investigation has several significant limitations.
Our clinics could not provide gender and aged-ma tched
controls, but the population-based control illustrates the
extent of our patients’ abnormal circadian function. A
second limitation is that actigraphy was measured under
different circumstances at each study site. One site used
actigraphy for inpatients 1-2 days before and while
undergoing cancer therapy, while the other site recorded
actigraphy in the patients’ homes, before the initiation of
any treatment. This limitation has, however, produced a
valuable insight i n hospitalized lung ca ncer patients–the
variation in all day/night patterns and rhythms are so
suppressed by hospitalization that most relationships
between the patients’ self-report of daytime activity and
sleep quality and actigraphy-measur ed activ ity and sleep
function are masked in this setting. The hospital routine
obviouslychangesthedailyact ivity pattern obscuring
some of these circadian rhythms.
Conclusions
Actigraphy as a quantitative measure of circadian dis-
ruption is of growing utility since circadian disruption
has been shown to increase risk for breast, colon, pros-
tate and endometrial cancer [26-29]. Our findings sug-
gest that outpatient actigraphy is an effective tool to
quantitatively assess whether a patients’ disrupted sleep
is due to a dysfunctional circadian organization o f activ-
ity and rest. These results suggest that treatments
designed to improve circadian function may also
improve sleep quality, daytime function, diminish day-
time fatigue, and enhance cancer patients’ quality of life.
The next step is to try to improve circadian organization
of c ancer patients: behaviorally with morning exercise;
pharmacologically with evening melatonin or photody-
namically with morning light therapy among other cir-
cadian tuning strategies.
Table 5 Correlations of PSQI Components and Actigraphy Parameters of Circadian Organization for Inpatients and
Outpatientsa
Actigraphy Parameters
(Circadian)
PSQI Sleep
Duration
PSQI Sleep
Efficiency
PSQI Sleep
Disturbance
PSQI Sleep
Medicine
PSQI Daytime
Dysfunction
PSQI Overall
PSQI
Inpatients(n = 35)
24 HR rhythm Mean ns ns ns ns ns ns
24 HR rhythm Amplitude ns ns ns ns ns ns
Peak Activity ns ns ns ns ns ns
Circadian Quotient ns ns ns ns ns ns
Rhythm Quotient ns ns ns ns ns ns
Day-Night Activity Balance ns ns -0.61 (0.037) ns ns ns
Day-Night Wake Balance ns 0.4(0.03) ns ns ns ns
Day-Night Sleep Balance -0.43 (0.016) ns ns 0.46 (0.018) ns ns
Night Day Long Sleep
Balance
0.37 (0.039) ns ns ns ns ns
Night Day Longest Sleep
Balance
-0.38 (0.03) ns ns ns ns ns
Night-Day Sleep Balance ns ns ns ns ns ns
Outpatients (n = 33)
24 HR rhythm Mean ns ns ns -0.45 (0.02) ns ns
24 HR rhythm Amplitude ns ns ns -0.45 (0.048) ns
Peak Activity ns ns ns -0.45 (0.048) ns ns
Circadian Quotient ns ns ns ns -0.42 (0.065) ns
Rhythm Quotient ns ns ns ns -0.58 (0.007) ns
Day-Night Activity Balance ns ns -0.61 (0.037) ns ns ns
Day-Night Wake Balance ns 0.36 (0.08) ns ns ns ns
Day-Night Sleep Balance 0.43 (0.027) ns ns ns -0.62 (0.004) -0.49 (0.01)
Night Day Long Sleep
Balance
0.37 (0.063) ns -0.42 (0.08) ns -0.64 (0.003) -0.52 (0.006)
Night Day Longest Sleep
Balance
0.43 (0.028) ns ns ns -0.51 (0.027) -0.4 (0.044)
Night-Day Sleep Balance ns ns -0.44 (0.067) -0.37 (0.07) -0.43 (0.065) -0.36 (0.071)
a
Correlations are shown only for p-values < 0.05; ns = not significant; p-values are in ( ).
Grutsch et al. Journal of Circadian Rhythms 2011, 9:4
/>Page 10 of 12
Acknowledgements
The study was funded by a peer-review grant provided by the Gateway for
Cancer Research
SM
with support from the National Cancer Institute (1982-
2000 R01CA031635, WJMH) and by VA grants (1989-2006 Merit Award,
WJMH; 1989-2001 Merit Award, PAW).
Author details
1
Cancer Treatment Centers of America at Midwestern Regional Medical
Center, Zion, IL, USA.
2
Medical Chronobiological Laboratory, Dorn Research
Institute, WJB Dorn VA Medical Center, Columbia, SC, USA.
3
School of
Medicine, University of South Carolina, Columbia, SC, USA.
4
School of Public
Health Cancer Prevention and Control Program, University of South Carolina,
Columbia, SC, USA.
5
School of Engineering and Information Technology,
University of South Carolina, Columbia, SC, USA.
6
University of Illinois School
of Public Health, Chicago, IL, USA.
Authors’ contributions
JFG, PAW, WJMH, CGL, RDL, and MAD participated in concept and design of
this investigation. PAW, JLR, MAD, and DTQ recruited patients and data
acquisition and interpretation. PAW, JDQ, JFG, WJMH, DG participated in
concept, statistical analysis, data interpretation and writing. All authors read
and approved the final manuscript.
Competing interests
The authors declare that they have no competing interests.
Received: 6 February 2011 Accepted: 18 May 2011
Published: 18 May 2011
References
1. Bell-Pedersen D, Cassone VM, Earnest DJ, Golden SS, Hardin PE, Thomas TL,
Zoran MJ: Circadian rhythms from multiple oscillators: lessons from
diverse organisms. Nat Rev Genet 2005, 6:544-556.
Table 6 Correlation of Circadian Actigraphy Parameters and PSQI of NSCLC Patients
Actigraphy
Parameters
Pittsburgh Sleep Quality Index
Sleep Duration Sleep Disturbance Sleep Medicine Use PSQI Daytime
Dysfunction
Global Score
Inpatients
(n = 35)
Outpatients
(n = 33)
Inpatients
(n = 35)
Outpatients
(n = 33)
Inpatients
(n = 35)
Outpatients
(n = 33)
Inpatients
(n = 35)
Outpatients
(n = 33)
Inpatients
(n = 35)
Outpatients
(n = 33)
Wake Span
Activity Mean 0.07 -0.58(0.003) -0.25 -0.61(0.006) -0.11 -0.48(0.014)
Sleep Minutes 0.39(0.05) -0.36 0.09 0.54(0.017) 0.26 0.41(0.036)
Mean Wake
Episode
0.05 -0.52(0.008) -0.29 0.23 -0.11 -0.43(0.027)
Sleep
Episodes
-0.12 0.40(0.047) 0.18 0.28 0.08 0.35(0.078)
Mean Sleep
Episode
-0.41
(0.035)
-0.08 -0.31 0.62(0.004) 0.18 0.26
Sleep Span
Wake
Episodes
0.37 0.63 (0.005) 0.34 (0.09) -0.23 0.25 0.55 (0.015) -0.32 0.49 (0.01)
Sleep Latency 0.13 0.29 0.62 (<
0.001)
-0.38 (0.058) 0.11 -0.21 -0.04 0.26
Sleep
Efficiency
-0.34 0.02 -0.35 0.31 0.02 0.01 0.12 0.22
Sleep
Episodes
0.37 -0.63 (0.005) 041
(0.038)
-0.24 0.25 -0.57 (0.011) -0.28 -0.49 (0.011)
Circadian
Parameters
24 HR rhythm
Mean
-0.45 (0.02)
Circadian
Quotient
-0.42 (0.065)
Rhythm
Quotient
-0.58 (0.007)
Day-Night
Activity
Balance
-0.61 (0.037)
Day-Night
Sleep Balance
0.43 (0.027) 0.46
(0.018)
-0.62 (0.004) -0.49 (0.01)
Night Day
Long Sleep
Balance
0.37 (0.063) -0.42 (0.08) -0.64 (0.003) -0.52 (0.006)
a
Correlations are shown only for p-values < 0.05; NSCLC = non-small cell lung cancer
Grutsch et al. Journal of Circadian Rhythms 2011, 9:4
/>Page 11 of 12
2. Refinetti R: Circadian physiology CRC Taylor & Francis, Boca Raton, London,
New York; 2006.
3. Filipski E, King VM, Li X, Granda TG, Mormont MC, Claustrat B, Hastings MH,
Levi F: Disruption of circadian coordination accelerates malignant
growth in mice. Pathol Biol (Paris) 2003, 51:216-219.
4. Iurisci I, Rich T, Levi F, Innominato PF, Tinari N, Irtelli L, De Tursi M,
Grassadonia A, Iacobelli S: Relief of symptoms after gefitinib is associated
with improvement of rest/activity rhythm in advanced lung cancer.
J Clin Oncol 2007, 25:e17-e19.
5. Mormont MC, Waterhouse J, Bleuzen P, Giacchetti S, Jami A, Bogdan A,
Lellouch J, Misset JL, Touitou Y, Levi F: Marked 24-h rest/activity rhythms
are associated with better quality of life, better response, and longer
survival in patients with metastatic colorectal cancer and good
performance status. Clin Cancer Res 2000, 6:3038-3045.
6. Sephton SE, Sapolsky RM, Kraemer HC, Spiegel D: Diurnal cortisol rhythm
as a predictor of breast cancer survival. J Natl Cancer Inst 2000,
92:994-1000.
7. Hrushesky WJM, Haus E, Lakatua DJ, Halberg F, Langevin T, Kennedy BJ:
Marker rhythms for cancer chrono-chemotherapy. In Chronobiology 1982-
1983. Edited by: Haus E, Kabat HF. New York: S. Karger; 1985; 1985:493-499.
8. Beck SL, Schwartz AL, Towsley G, Dudley W, Barsevick A: Psychometric
evaluation of the Pittsburgh Sleep Quality Index in cancer patients.
J Pain Symptom Manage 2004, 27:140-148.
9. Davidson JR, MacLean AW, Brundage MD, Schulze K: Sleep disturbance in
cancer patients. Soc Sci Med 2002, 54:1309-1321.
10. Mercadante S, Girelli D, Casuccio A: Sleep disorders in advanced cancer
patients: prevalence and factors associated. Support Care Cancer 2004,
12:355-359.
11. Mormont MC, Waterhouse J: Contribution of the rest-activity circadian
rhythm to quality of life in cancer patients. Chronobiol Int 2002,
19:313-323.
12. Cole RJ, Kripke DF, Gruen W, Mullaney DJ, Gillin JC: Automatic sleep/wake
identification from wrist activity. Sleep 1992, 15:461-469.
13. Jean-Louis G, von Gizycki H, Zizi F, Fookson J, Spielman A, Nunes J,
Fullilove R, Taub H: Determination of sleep and wakefulness with the
actigraph data analysis software (ADAS). Sleep 1996, 19:739-743.
14. Korszun A, Young EA, Engleberg NC, Brucksch CB, Greden JF, Crofford LA:
Use of actigraphy for monitoring sleep and activity levels in patients
with fibromyalgia and depression. J Psychosom Res 2002, 52:439-443.
15. Sadeh A, Sharkey KM, Carskadon MA: Activity-based sleep-wake
identification: an empirical test of methodological issues. Sleep 1994,
17:201-207.
16. Berger AM, Wielgus KK, Young-McCaughan S, Fischer P, Farr L, Lee KA:
Methodological challenges when using actigraphy in research. J Pain
Symptom Manage
2008, 36:191-199.
17. Carpenter JS, Andrykowski MA: Psychometric evaluation of the Pittsburgh
Sleep Quality Index. J Psychosom Res 1998, 45:5-13.
18. Ancoli-Israel S, Klauber MR, Jones DW, Kripke DF, Martin J, Mason W, Pat-
Horenczyk R, Fell R: Variations in circadian rhythms of activity, sleep, and
light exposure related to dementia in nursing-home patients. Sleep 1997,
20:18-23.
19. Satlin A, Teicher MH, Lieberman HR, Baldessarini RJ, Volicer L, Rheaume Y:
Circadian locomotor activity rhythms in Alzheimer’s disease.
Neuropsychopharmacology 1991, 5:115-126.
20. Nelson W, Tong YL, Lee JK, Halberg F: Methods for cosinor-rhythmometry.
Chronobiologia 1979, 6:305-323.
21. Mojon A, Fernandez JR, Hermida RC: Chronolab: an interactive software
package for chronobiologic time series analysis written for the
Macintosh computer. Chronobiol Int 1992, 9:403-412.
22. Foley D, Ancoli-Israel S, Britz P, Walsh J: Sleep disturbances and chronic
disease in older adults: results of the 2003 National Sleep Foundation
Sleep in America Survey. J Psychosom Res 2004, 56:497-502.
23. Ohayon MM, Carskadon MA, Guilleminault C, Vitiello MV: Meta-analysis of
quantitative sleep parameters from childhood to old age in healthy
individuals: developing normative sleep values across the human
lifespan. Sleep 2004, 27:1255-1273.
24. Buysse DJ, Reynolds CF, Monk TH, Berman SR, Kupfer DJ: The Pittsburgh
Sleep Quality Index: a new instrument for psychiatric practice and
research. Psychiatry Res 1989, 28:193-213.
25. Littner M, Kushida CA, Anderson WM, Bailey D, Berry RB, Davila DG,
Hirshkowitz M, Kapen S, Kramer M, Loube D, et al: Practice parameters for
the role of actigraphy in the study of sleep and circadian rhythms: an
update for 2002. Sleep 2003, 26:337-341.
26. Davis S, Mirick DK, Stevens RG: Night shift work, light at night, and risk of
breast cancer. J Natl Cancer Inst 2001, 93:1557-1562.
27. Kubo T, Ozasa K, Mikami K, Wakai K, Fujino Y, Watanabe Y, Miki T, Nakao M,
Hayashi K, Suzuki K, et al: Prospective cohort study of the risk of prostate
cancer among rotating-shift workers: findings from the Japan
collaborative cohort study. Am J Epidemiol 2006, 164:549-555.
28. Schernhammer ES, Laden F, Speizer FE, Willett WC, Hunter DJ, Kawachi I,
Fuchs CS, Colditz GA: Night-shift work and risk of colorectal cancer in the
nurses’ health study. J Natl Cancer Inst 2003, 95:825-828.
29. Viswanathan AN, Hankinson SE, Schernhammer ES: Night shift work and
the risk of endometrial cancer. Cancer Res 2007, 67:10618-10622.
doi:10.1186/1740-3391-9-4
Cite this article as: Grutsch et al.: Validation of actigraphy to assess
circadian organization and sleep quality in patients with advanced lung
cancer. Journal of Circadian Rhythms 2011 9:4.
Submit your next manuscript to BioMed Central
and take full advantage of:
• Convenient online submission
• Thorough peer review
• No space constraints or color figure charges
• Immediate publication on acceptance
• Inclusion in PubMed, CAS, Scopus and Google Scholar
• Research which is freely available for redistribution
Submit your manuscript at
www.biomedcentral.com/submit
Grutsch et al. Journal of Circadian Rhythms 2011, 9:4
/>Page 12 of 12