báo cáo khoa học: " Implementing quality indicators in intensive care units: exploring barriers to and facilitators of behaviour change" pot
Bạn đang xem bản rút gọn của tài liệu. Xem và tải ngay bản đầy đủ của tài liệu tại đây (490.26 KB, 8 trang )
Implementation
Science
de Vos et al. Implementation Science 2010, 5:52
/>Open Access
RESEARCH ARTICLE
© 2010 de Vos et al; licensee BioMed Central Ltd. This is an Open Access article distributed under the terms of the Creative Commons
Attribution License ( which permits unrestricted use, distribution, and reproduction in
any medium, provided the original work is properly cited.
Research article
Implementing quality indicators in intensive care
units: exploring barriers to and facilitators of
behaviour change
Maartje LG de Vos*
1,2
, Sabine N van der Veer
3
, Wilco C Graafmans
1,4
, Nicolette F de Keizer
3
, Kitty J Jager
3
,
Gert P Westert
1,2
and Peter HJ van der Voort
5
Background: Quality indicators are increasingly used in healthcare but there are various barriers hindering their
routine use. To promote the use of quality indicators, an exploration of the barriers to and facilitating factors for their
implementation among healthcare professionals and managers of intensive care units (ICUs) is advocated.
Methods: All intensivists, ICU nurses, and managers (n = 142) working at 54 Dutch ICUs who participated in training
sessions to support future implementation of quality indicators completed a questionnaire on perceived barriers and
facilitators. Three types of barriers related to knowledge, attitude, and behaviour were assessed using a five-point Likert
scale (1 = strongly disagree to 5 = strongly agree).
Results: Behaviour-related barriers such as time constraints were most prominent (Mean Score, MS = 3.21), followed by
barriers related to knowledge and attitude (MS = 3.62; MS = 4.12, respectively). Type of profession, age, and type of
hospital were related to knowledge and behaviour. The facilitating factor perceived as most important by intensivists
was administrative support (MS = 4.3; p = 0.02); for nurses, it was education (MS = 4.0; p = 0.01), and for managers, it
was receiving feedback (MS = 4.5; p = 0.001).
Conclusions: Our results demonstrate that healthcare professionals and managers are familiar with using quality
indicators to improve care, and that they have positive attitudes towards the implementation of quality indicators.
Despite these facts, it is necessary to lower the barriers related to behavioural factors. In addition, as the barriers and
facilitating factors differ among professions, age groups, and settings, tailored strategies are needed to implement
quality indicators in daily practice.
Background
Quality indicators are increasingly being used in health-
care to support and guide improvements in quality of
care. The purpose of implementing quality indicators as a
tool to assist quality improvement is to periodically
report and monitor indicator data in order to improve
quality of care. In several countries, the development of
indicators is emerging and examples of sets of indicators
for quality of hospital care are available [1,2]. Although
quality indicators are applied as a tool to guide the pro-
cess of quality improvement in healthcare, hospitals that
adopt quality indicators are faced with problems con-
cerning implementation [3,4]. Successful implementa-
tion, however, is critical to maximise the effect of quality
indicators on the quality of care [5].
Quality management is crucial in intensive care units
(ICUs), and quality indicators can be used as a tool to
assist quality improvement. Morbidity and mortality
rates in ICUs vary widely among hospitals [6]. This varia-
tion is likely to be related to differences in ICU structure
and care processes [7,8]. Understanding of these factors
may reduce variation and ultimately improve patient care.
An evaluation of barriers to and facilitators for using
quality indicators could inform strategies for their imple-
mentation in daily practice [9]. Cabana et al. assessed
potential barriers at each stage of behavioural change for
* Correspondence:
1
Scientific Centre for Transformation in Care and Welfare (Tranzo), University of
Tilburg, PO Box 90153, Tilburg 5000 LE, the Netherlands
Full list of author information is available at the end of the article
de Vos et al. Implementation Science 2010, 5:52
/>Page 2 of 8
guideline implementation and placed them within a
knowledge-attitude-behaviour framework [10]. Success-
ful implementation depends upon three conditions. First,
all healthcare professionals involved have to be familiar
with and aware of quality indicators. Second, they need to
have positive attitudes towards the use of quality indica-
tors as a tool to improve the quality of care. Third, barri-
ers related to behaviour, such as time and organisational
constraints, need to be addressed [9,10]. Although behav-
iour can be changed without knowledge or attitude being
affected, behaviour change based on improving knowl-
edge and attitude is probably more sustainable than indi-
rect manipulation of behaviour alone [10].
In general, little is known about the knowledge, atti-
tudes, and behaviour of physicians, nurses, and managers
regarding the implementation of quality indicators in
daily practice. Some studies have assessed the knowledge,
attitude, and behaviour of ICU staff to specific practice
guidelines or guidelines in general [11-13]. Relatively few
studies have examined attitudes of physicians towards the
use of quality indicators; we are aware of none that have
addressed the intensive care setting [14-17].
In 2006, the Dutch National Society of Intensive Care
Medicine (NVIC) developed a set of quality indicators in
order to evaluate and improve quality at Dutch ICUs [18].
This set of indicators is due to be implemented in all
ICUs from 2008 onwards as part of the Dutch National
Intensive Care Evaluation (NICE) registry. For each ICU,
the implementation process of the indicators started with
a course for ICU staff regarding the collection of data.
This offered the possibility for the current study to
explore barriers to knowledge, attitude, and behaviour
that may affect implementation of quality indicators in
Dutch ICUs, and to assess facilitators for the implemen-
tation of these indicators in daily practice.
Methods
Study population
Included in this study were all intensivists, ICU nurses,
and managers (n = 142) who participated in the NICE
registry course regarding the collection of indicator data
[18] in the period from September 2007 to December
2008. In this study, managers were people working in the
ICU who were not engaged in direct patient care but car-
ried the responsibility of making management decisions
for the ICU based on the indicator scores. Participants
completed the questionnaire at the start of the training
sessions.
Questionnaire content
In close cooperation with the Dutch National Society of
Intensive Care Medicine (NVIC), we developed a ques-
tionnaire that was divided into three sections.
The first part addressed professional as well as demo-
graphic characteristics such as gender, age, profession,
year of graduation, and type of hospital. The second sec-
tion contained statements concerning barriers at each
stage of behaviour change that may affect the implemen-
tation of quality indicators in ICUs. We classified the bar-
riers into three categories using Cabana's framework of
barriers related to knowledge, attitude, and behaviour
[10]. Knowledge-related barriers refer to lack of aware-
ness or familiarity with the term quality indicator in gen-
eral; barriers related to attitude refer to lack of motivation
to implement and use quality indicators, or a lack of con-
fidence in outcome. Behaviour-related barriers concern
external factors such as lack of time and resources, or
organisational constraints that restrict healthcare profes-
sionals' abilities to change their behaviour.
Analogous to this framework, we assessed eleven state-
ments focusing on barriers related to knowledge, attitude,
and behaviour. We used statements from a previously val-
idated instrument designed to assess barriers to change
across different innovations and healthcare settings [19].
The barriers to change in this instrument were based on a
literature review and an expert panel consensus proce-
dure with implementation experts. Studies have used this
instrument successfully to identify barriers to the imple-
mentation of clinical practice guidelines [19,20]. We con-
sulted four healthcare professionals (ICU nurses and
intensivists with special interest in implementation) to
check the relevance of each item on the questionnaire
and whether there were any items missing that should be
included. Several items in the questionnaire that were not
relevant to the context of the ICU setting or to the imple-
mentation of indicators were removed. We performed an
exploratory factor analysis based on current data regard-
ing the eleven statements. This resulted in three factors,
all with reasonably good reliability (Cronbach's alpha
0.73, 0.74 and 0.71) [21]. Factor one comprised two items
that addressed how respondents rated their knowledge
regarding quality indicators with factor loadings 0.70 and
0.81. Factor two contained six statements about their atti-
tude with factor loadings ranging from 0.32 to 0.68, and
the three statements of factor three assessed their behav-
iour with factor loadings 0.48, 0.50, and 0.57 respectively.
The third section of the questionnaire included ques-
tions regarding perceived facilitating factors for health-
care professionals and managers. This was based on
results from a review, including studies dealing with
healthcare professionals' attitude to quality and quality
improvement [22]. These studies assessed healthcare pro-
fessionals' enabling factors for quality improvement in
healthcare.
All statements and items used in the questionnaire
were scored on a five-point Likert scale ranging from '1 =
de Vos et al. Implementation Science 2010, 5:52
/>Page 3 of 8
strongly disagree' to '5 = strongly agree.' An open-ended
question was added for additional suggestions regarding
facilitating factors that might enable the implementation
of quality indicators in daily practice.
Data Analysis
Descriptive statistics were used to characterize the study
sample. The questionnaire contained both positively and
negatively formulated statements. To calculate a mean
score, we recoded the response on the negatively formu-
lated statements. A score of more than 3 on the five-point
scale was indicated as positive, less than 3 as negative and
a score of 3 was indicated as neutral. Data were excluded
from analysis if there was a missing value on one or more
of the items.
Multiple linear regression was used to explain the
scores of the overall knowledge, attitude, and behaviour
scales stratified by professional characteristics and set-
tings. All independent variables were included into the
model simultaneously, adjusting each variable in relation
to the others. The scores of the overall knowledge, atti-
tude, and behaviour scales were calculated based on the
mean scores (MS) of the individual statements. The inde-
pendent variables included in the model were gender,
profession (healthcare professional or manager), and type
of hospital (academic/teaching or non-teaching). For the
purpose of analysis, respondents were divided into three
age groups: <40 years, 40 to 49 years, and ≥50 years of
age. In addition, MS of the reported facilitating factors
among professions (intensivist, ICU nurse, and manager)
were compared using analysis of variance (ANOVA) with
statistical significance defined as p ≤ 0.05. The presence
of multicollinearity was tested by determining the vari-
ance inflation factor (VIF) and tolerance value per vari-
able. Cut-off values were a VIF >4 and tolerance <0.25
[23].
Results
Study population
All 142 professionals attending the training sessions (82
intensivists, 40 ICU nurses, and 20 managers coming
from 54 ICUs in 51 hospitals out of the total of 94 Dutch
ICUs) completed the questionnaire (response rate 100%).
The group of participating ICUs included 36 teaching
hospitals, of which six were academic hospitals (affiliated
to a university), and 15 were non- teaching hospitals. The
characteristics of the respondents are shown in Table 1.
The majority of the 142 respondents were male (66%),
71% graduated after 1990, 50% were between 40 and 50
years of age, and 76% were affiliated to teaching or aca-
demic hospitals.
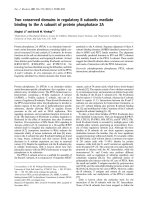
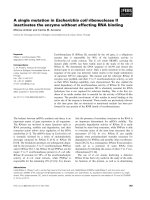
Barriers regarding knowledge, attitude, and behaviour
Figure 1 shows the response to each of the eleven state-
ments. Seventy-seven percent of the respondents were
familiar with the use of quality indicators as a tool to
improve quality of care, and 41% knew about the Dutch
set of ICU quality indicators (statements one and two).
Scores on attitudes varied between 55% of the respon-
dents agreeing that monitoring of quality indicators leads
to reliable benchmark data for ICUs, up to 95% of the
respondents agreeing that receiving feedback on quality
indicators stimulated them to adjust their practice (state-
ments three through eight). More than 90% reported
understanding the importance of using quality indicators
and were willing to implement quality indicators in daily
practice. Approximately 80% agreed with the statement
that they would not resist working with indicators in the
near future and agreed that monitoring of quality indica-
tors stimulates quality improvement.
As shown in Figure 1, 59% percent of all respondents
agreed that monitoring of quality indicators fits into the
daily routines in the hospital setting, 28% agreed that
monitoring does not take too much time, and 30% agreed
that monitoring of quality indicators could be done with-
out huge investments (statements nine through eleven).
Table 1: Study population (n = 142)
Demographics and professional
characteristic
n
(%)
a
Gender
Male 93 (65.5)
Female 49 (34.5)
Age (years)
<40 42 (29.6)
40 to 49 72 (50.7)
>49 28 (19.7)
Profession
Intensivist 82 (57.7)
ICU nurse 40 (28.2)
Management 20 (14.1)
Hospital type
Academic hospital 12 (8.5)
Teaching hospital 96 (67.6)
Non-teaching hospital 34 (23.9)
Year of graduation
1971 to 1990 41 (29.1)
>1990 100 (70.9)
a
Numbers may not add up to 142 and percentages may not add
up to 100% due to missing values
de Vos et al. Implementation Science 2010, 5:52
/>Page 4 of 8
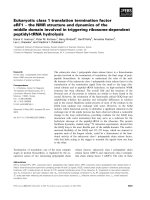
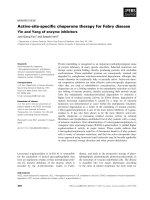
Facilitating factors
In regard to the perceived facilitating factors, respon-
dents reported receiving feedback on quality indicator
data (92% of the respondents), administrative support
(89%), and education (87%) as important facilitating fac-
tors (see Figure 2). Factors related to the intrinsic motiva-
tion of healthcare professionals and managers for
improvement (90%) and possibilities to improve care
(91%) were also considered as important facilitators. The
least perceived as facilitating factors were those related to
external motivation, such as social pressure from hospital
management (14%), pay for performance (57%), social
demand for transparency (58%), and the designation of an
opinion leader (41%).
Of the 142 respondents, 77 reported additional sugges-
tions regarding facilitating factors for the implementation
of quality indicators. Most of the responses revealed fac-
tors relating to the availability of resources such as the
implementation of a patient data management system
(PDMS) coupled with a hospital information system (20%
of 77 respondents) and user-friendly software to register
the indicators (9%). Other suggestions regarding
resources are the appointment of one person responsible
for the coordination and registration of the indicators (for
example, a secretary) (8%), additional staff members for
Figure 2 Response to several items about factors that may facilitate the implementation of quality indicators.
0% 20% 40% 60% 80% 100%
Opinion lead er (n=140)
Quality improvement team (n=140)
Education (n=140)
Reminders for registration (n=140)
Receiving feedback (n=140)
Administrative support (n=141)
Po s s ib ilities to improve care (n =141)
Social pressure from hospital management (n=140)
Social demand for transparency (n=140)
Encouragement from scientific society (n=137)
Intrinsic motivation (n=140)
Pay-for-performance (n=138)
Rules and policy (n=140)
Proportion of responding respondents
Strongly disagree
Disagree
Neutral
Agree
Strongly agree
Figure 1 Response to eleven statements regarding perceived barriers towards implementation of quality indicators.
0% 10% 20% 30% 40% 50% 60% 70% 80% 90% 100%
11) Monitoring of quality indicators does not take too much time (n=139)
10) Monitoring of quality indicators can be done without huge investments (n=140)
9) Monitoring of quality indicators fits into the daily routines in the hospital setting (n=140)
8) Monitoring of quality indicators leads to reliable benchmark data for ICUs (n=140)
7) Monitoring of quality indicators stimulates quality improvement (n=140)
6) Feedback on quality indicators stimulates me to adjust my p ractice (n=142)
5) I am willing to imp lement qualit y indicat ors in daily p ractice (n=141)
4) In general, I do not offer resistance towards working with quality indicators (n=142)
3) I understand the importance of using quality indicators (n=142)
2) I am familiar wit h the Dut ch set of ICU quality indicat ors (n=142)
1) I am familiar wit h the use of qualit y indicat ors as a t ool to imp rove quality of care (n= 142)
Proportion of responding respondents
Strongly disagree
Disagree
Neutral
Agree
Strongly agree
de Vos et al. Implementation Science 2010, 5:52
/>Page 5 of 8
administrative support (10%), additional hours for non-
patient related work such as the registration of the indica-
tors (9%), the establishment of a quality improvement
(QI) team (5%), support from management (4%), and the
appointment of a quality manager at the ICU (3%). In
addition, respondents offered some suggestions regard-
ing education. Most respondents reported the impor-
tance of well-trained personnel for the indicator
registration (14%), availability of information about the
purpose and importance of using indicators (8%), and
education in quality improvement principles (7%).
Regarding feedback, some respondents suggested that
the frequency of the feedback should be quarterly and be
provided by mail (7%), and should also give alerts when
one exceeded predefined targets (3%). With respect to the
content of the feedback, respondents reported that feed-
back should be confidential, independent, and positive
(4%). In addition, the content of the feedback should
include results at ward level with comparison to the
national benchmark and to similar units (3%). Finally,
respondents state that it is important that the recipients
of the feedback include ICU management and healthcare
professionals (2%).
Determinants of knowledge, attitude, and behaviour
Collinearity statistics did not show any variables with a
VIF > 4 or a tolerance < 0.25. Therefore, all previously
described independent variables were included in the
multiple linear regressions. Table 2 illustrates the deter-
minants of self-reported scores on overall knowledge,
attitude, and behaviour determined from regression anal-
yses. The multiple linear regression showed that being a
manager (β = 0.58; p = 0.00) and being between 40 and 49
years old (β = 0.35; p = 0.03) were related to a higher level
of overall knowledge. Managers had a higher level of
knowledge compared to healthcare professionals (MS =
4.1 versus MS 3.5; p = 0.004). Within the group of health-
care professionals, ICU nurses had a lower level of knowl-
edge than intensivists (MS = 3.1 versus MS = 3.7; p =
0.01).
In addition, working in a non-teaching hospital was
associated negatively with overall knowledge (β = -0.32; p
= 0.05) (Table 2). Healthcare professionals and managers
working in non-teaching hospitals had a lower level of
knowledge compared to those working in academic or
teaching hospitals (p = 0.01).
None of the characteristics was statistically significant
related to overall attitude (Table 2). The multiple linear
regression revealed that being older than 49 years (as
compared to colleagues under 40 years of age) positively
affected overall behaviour (β = 0.36; p = 0.01), whereas
working in a non-teaching hospital was negatively associ-
ated with high scores on the overall behaviour scale (p =
0.01).
Determinants of facilitating factors
The perceived facilitating factors differed among the vari-
ous types of professions. Intensivists reported adminis-
trative support as the strongest facilitating factor (MS =
4.3; p = 0.02), ICU nurses reported education as being the
most important (MS = 4.0; p = 0.01), and managers indi-
cated receiving feedback (MS = 4.5; p = 0.001) and oppor-
tunities to improve care (MS = 4.5; p = 0.003) as the most
important facilitating factors. Intensivists, nurses, and
managers perceived social pressure from hospital man-
agement as the least facilitating factor (MS = 2.6; 2.8 and
2.8, respectively).
Discussion
We conducted an exploratory study of self-reported bar-
riers to and facilitators for the implementation of quality
indicators in Dutch ICUs. Our results show that, in gen-
eral, healthcare professionals and managers are familiar
with the concept of using quality indicators to improve
care. Although they have positive attitudes regarding the
implementation of quality indicators, many are less than
confident that these indicators can be fully implemented
Table 2: Determinants of scores on overall knowledge, attitude, and behaviour scale
Overall knowledge* Overall attitude* Overall behaviour*
Beta P-value Beta P-value Beta P-value
Constant 3.37 0.00 4.06 0.00 3.18 0.00
Manager (versus healthcare professional) 0.58 0.00 0.20 0.10 0.07 0.63
Female (versus male) 0.04 0.79 0.05 0.61 -0.03 0.81
Aged between 40 and 49 years (versus aged <40 years) 0.35 0.03 0.01 0.88 0.05 0.65
Aged >49 years (versus aged <40 years) 0.31 0.13 0.16 0.20 0.36 0.01
Non-teaching hospital (versus academic or teaching) -0.32 0.05 -0.09 0.35 -0.29 0.01
Mean values and P-values were obtained by multiple linear regression (n = 142), involving all variables simultaneously.
*Overall = all statements combined
de Vos et al. Implementation Science 2010, 5:52
/>Page 6 of 8
in their daily practice. These findings in the ICU setting
are in line with previous results outside the ICU, which
indicate that even if healthcare professionals are familiar
with indicators and have overall positive attitudes regard-
ing quality indicators, there is no guarantee that they will
change their daily practice [24,25]. Lack of time and
resources can be considered as the most important barri-
ers to the implementation of quality indicators in Dutch
ICUs.
The facilitating factors most frequently mentioned in
this study were related to the availability of resources
such as a PDMS interfaced with a hospital information
system and user-friendly software to register the indica-
tors. Other important factors were the designation of
well-trained persons to carry out the indicator data regis-
tration. These results are similar to the findings of other
international studies [20,22].
Our results show that respondents' profession, age, and
type of hospital were associated with certain aspects of
knowledge and behaviour. Familiarity with the use of
quality indicators as a tool to improve the quality of care
was higher among intensivists and managers, compared
to nurses. Nurses were also less familiar with the Dutch
set of ICU quality indicators. In order to become more
familiar with the set of ICU quality indicators, it may be
necessary to provide them with additional training,
including handbooks and instructions on how to collect
data. Healthcare professionals and managers between 40
and 49 years old and working in academic or teaching
hospitals had a higher overall knowledge level, compared
to those younger than 40 and those working in non-
teaching hospitals. This finding is consistent with a
recently conducted study that reported that older health-
care professionals working in the ICU had more knowl-
edge of guidelines compared to younger healthcare
workers [12]. None of the characteristics included in our
analyses was a significant predictor of overall attitude.
Regarding behaviour-related barriers, higher age and
working at academic or teaching hospitals were signifi-
cant predictors. Healthcare professionals and managers
working at ICUs in academic and teaching hospitals tend
to be more prepared to change behaviour and to actively
work towards implementation compared to healthcare
professionals and managers working in ICUs in non-
teaching hospitals.
In our sample, non-teaching hospitals are slightly
underrepresented compared to the overall proportion of
non-teaching hospitals nationwide in the Netherlands.
This may indicate that the results are somewhat more
positive, because these hospitals showed lower scores on
knowledge and behaviour in our study. However, general-
isability to all Dutch ICUs is not the main objective of the
current study. The study aims to identify barriers as per-
ceived by healthcare professionals who already work with
indicators. In addition, the proportion of non-teaching
hospitals in our study is similar to the proportion of non-
teaching hospitals participating in the Dutch NICE regis-
try, which may indicate that non-teaching hospitals are
less motivated to implement quality indicators in daily
practice. Haagen et al. [26] also found that working in a
non-teaching hospital is related to barriers regarding
motivation.
Several factors can be of importance in facilitating the
implementation of quality indicators. Our study showed
that intrinsic motivation and possibilities to improve care
are considered as very important facilitating factors.
Consistent with results from other studies, factors such
as administrative support and receiving feedback were
also considered as important facilitators [18,27]. Intensiv-
ists, nurses, and managers appear to have different ideas
concerning the perceived facilitating factors. Nurses were
less familiar with quality indicators and reported that
they would like to have some training in the registration
of the indicators. Managers prefer to receive feedback on
indicator scores, and intensivists reported administrative
support as the most important facilitating factor. These
findings imply that in order to implement quality indica-
tors successfully in the ICUs, different strategies for dif-
ferent types of professionals are needed.
This study was a first exploration of barriers to and
facilitators for the implementation of quality indicators in
ICUs. The sample of respondents represented healthcare
professionals who volunteered to attend training sessions
aiming to implement quality indicators at their ICU.
Therefore, the results might give a somewhat more posi-
tive picture than is the case elsewhere because these
respondents may be more motivated compared to the
total population of ICU professionals. In addition,
because the 54 ICUs represented in our sample represent
57% of Dutch ICUs, results may not be generalisable to all
ICUs. However, it serves as a valuable first attempt to
evaluate attitudes of healthcare professionals and manag-
ers towards implementation of quality indicators in daily
practice. Whether these results can be extrapolated to
other countries can only be a matter of speculation. How-
ever, we cannot think of obvious reasons why other devel-
oped countries would yield different results.
This study relies on self-reported perceived knowledge,
attitude, and behaviour. Inevitably there is a risk of social
desirability bias (individuals may wish to present them-
selves or their organisation in a favourable way). Never-
theless, these data provide evidence of the barriers and
facilitators that exist in regard to the implementation of
quality indicators in ICUs and provide useful suggestions
for the implementation. Administrative support, addi-
tional education, and effective feedback of indicator
scores may be effective strategies to lower the barriers. In
addition, special attention needs to be paid to healthcare
de Vos et al. Implementation Science 2010, 5:52
/>Page 7 of 8
professionals working in ICUs in non-teaching hospitals
in order to motivate them to implement quality indica-
tors, and to the education in quality improvement con-
cepts for both those working in ICUs in non-teaching
hospitals and nurses. This difference in focus should be
taken into account when developing implementation
strategies. Tailored strategies have to be developed for
each profession or type of hospital.
Because no validated questionnaires were available on
this subject, we developed our own questionnaire. In this,
we used the well-known framework of Cabana evaluating
the stages of behaviour change. We reformulated the
statements regarding barriers to guideline adherence
because we used the classification within the framework
of identifying barriers to implementing indicators in daily
practice. Although the value of the questionnaire needs
to be confirmed, inspection of the factor loadings and
internal consistency suggests that it could be a useful tool
for future studies.
Summary
In conclusion, the results of this study suggest that even
in a situation in which knowledge and attitude towards
implementation are generally positive, barriers related to
behaviour need to be addressed before healthcare profes-
sionals and managers would be willing to work actively
towards implementation.
Despite the increased interest in using quality indica-
tors in daily practice in order to improve the quality of
care, hospitals often struggle with its implementation
[3,5,28]. The present exploratory study is the first study
with a structured method to identify important barriers
and facilitators that might inform the process of imple-
mentation. It could serve as a starting point for profes-
sionals and organisations to identify local barriers in
more detail and to develop tailored strategies for the
implementation of quality indicators in their organisa-
tion. Moreover, we have used these findings as a part of
the development of a tailored strategy to address these
barriers in order to improve the implementation of qual-
ity indicators in clinical practice.
Competing interests
The authors declare that they have no competing interests.
Authors' contributions
All authors participated in manuscript preparation, and read and approved the
final manuscript.
Acknowledgements
The authors wish to thank all participating intensivists, ICU nurses, and manag-
ers and the Dutch NICE registry for providing the sample of healthcare profes-
sionals and managers of ICUs. We also would like to thank Clare Castledine for
her help in improving the precision and fluency of the manuscript.
Author Details
1
Scientific Centre for Transformation in Care and Welfare (Tranzo), University of
Tilburg, PO Box 90153, Tilburg 5000 LE, the Netherlands,
2
Centre for Prevention
and Health Services Research, National Institute for Public Health and the
Environment, PO Box 1, Bilthoven 3720 BA, the Netherlands,
3
Department of
Medical Informatics, Academic Medical Center, Meibergdreef 15, 1105 AZ,
Amsterdam, the Netherlands,
4
World Alliance for Patient Safety, World Health
Organization, Geneva, Schwitzerland and
5
Department of Intensive Care, Onze
Lieve Vrouwe Gasthuis, Amsterdam, the Netherlands
References
1. Agency for Healthcare Research and Quality. Quality indicators [http:/
/www.qualityindicators.ahrq.gov/introduction.htm]
2. Commission for Health Improvement. NHS ratings [http://
www.chi.nhs.uk/ratings]
3. Beata K, Mattias E, Jan L: Design and Implementation of a Performance
Measurement System in Swedish Health Care Services: A Multiple Case
Study of 6 Development Teams. Quality Management in Health Care
2005, 14:95-111.
4. Bourne M, Neely A, Platts K, Mills J: The success and failure of
performance measurement initiatives: Perceptions of participating
managers. International journal of operations & production management
2002, 22:1288-1310.
5. Weiner BJ, Alexander JA, Shortell SM, Baker LC, Becker M, Geppert JJ:
Quality improvement implementation and hospital performance on
quality indicators. Health Serv Res 2006, 41:307-334.
6. Halpern NA, Bettes L, Greenstein R: Federal and nationwide intensive
care units and healthcare costs: 1986-1992. Crit Care Med 1994,
22:2001-2007.
7. Pronovost PJ, Jenckes MW, Dorman T, Garrett E, Breslow MJ, Rosenfeld BA,
Lipsett PA, Bass E: Organizational characteristics of intensive care units
related to outcomes of abdominal aortic surgery. JAMA 1999,
281:1310-1317.
8. Wunsch H, Angus DC, Harrison DA, Collange O, Fowler R, Hoste EAJ, de
Keizer NF, Kersten A, Linde-Zwirble WT, Sandiumenge A, Rowan KM:
Variation in critical care services across North America and Western
Europe. Crit Care Med 2008, 36:2787-2793.
9. Grol R, Wensing M, Eccles M: Improving Patient Care. In The
Implementation of Change in Clinical Practice London: Elsevier Limited;
2005.
10. Cabana MD, Rand CS, Powe NR, Wu AW, Wilson MH, Abboud PA, Rubin HR:
Why don't physicians follow clinical practice guidelines? A framework
for improvement. JAMA 1999, 282:1458-1465.
11. Pogorzelska M, Larson EL: Assessment of attitudes of intensive care unit
staff toward clinical practice guidelines. Dimens Crit Care Nurs 2008,
27:30-38.
12. Poeze M, Ramsay G, Gerlach H, Rubulotta F, Levy M: An international
sepsis survey: a study of doctors' knowledge and perception about
sepsis. Crit Care 2004, 8:409-413.
13. Dennison CR, Mendez-Tellez PA, Wang W, Pronovost PJ, Needham DM:
Barriers to low tidal volume ventilation in acute respiratory distress
syndrome: survey development, validation, and results. Crit Care Med
2007, 35:2747-2754.
14. Casalino LP, Alexander GC, Jin L, Konetzka RT: General internists' views
on pay-for-performance and public reporting of quality scores: a
national survey. Health Aff (Millwood) 2007, 26:492-499.
15. Young GJ, Meterko M, White B, Bokhour BG, Sautter KM, Berlowitz D,
Burgess JF: Physician Attitudes toward Pay-for-Quality Programs:
Perspectives from the Front Line. Medical care research and review 2007,
64:331-343.
16. Valenstein M, Mitchinson A, Ronis D-L, Alexander J-A, Duffy S-A, Craig T-J,
Barry K-L: Quality Indicators and Monitoring of Mental Health Services:
What Do Frontline Providers Think? American Journal of Psychiatry 2004,
161:146-153.
17. Wilkinson EK, McColl A, Exworthy M, Roderick P, Smith H, Moore M,
Gabbay J: Reactions to the use of evidence-based performance
Received: 2 October 2009 Accepted: 1 July 2010
Published: 1 July 2010
This article is available from: 2010 de Vos et al; licensee BioMed Central Ltd. This is an Open Access article distributed under the terms of the Creative Commons Attribution License ( which permits unrestricted use, distribution, and reproduction in any medium, provided the original work is properly cited.Implementation Science 2010, 5:52
de Vos et al. Implementation Science 2010, 5:52
/>Page 8 of 8
indicators in primary care: a qualitative study. Qual Health Care 2000,
9:166-174.
18. de Vos M, Graafmans W, Keesman E, Westert G, van der Voort PHJ: Quality
measurement at intensive care units: which indicators should we use?
J Crit Care 2007, 22:267-274.
19. Peters MAJ, Harmsen M, Laurant MGH, Wensing M: Room for
improvement? Barriers to and facilitators for improvement in patient
care. 2002 [ />product_112.pdf]. Nijmegen Centre for Quality of Care Research (WOK)
20. Koh SSL, Manias E, Hutchinson AM, Donath S, Johnston L: Nurses'
perceived barriers to the implementation of a Fall Prevention Clinical
Practice Guideline in Singapore hospitals. BMC Health Services Research
2008, 8:105-114.
21. Kline P: The Handbook of Psychological Testing. London: Routledge;
1993.
22. Davies H, Powell A, Rushmer R: Healthcare professionals' views on
clinician engagement in quality improvement. In A literature review
London: The Health Foundation; 2007.
23. Fox J: Regression diagnostics: An Introduction (Sage University Paper
series on Quantitative Applications in the Social Sciences series no.07-
079). Newbury Park, CA: Sage; 1991.
24. Sanazaro PJ: Determining physicians' performance. Continuing medical
education and other interacting variables. Eval Health Prof 1983,
6:197-210.
25. Grimshaw JM, Eccles MP, Walker AE, Thomas RE: Changing physicians'
behavior: what works and thoughts on getting more things to work. J
Contin Educ Health Prof 2002, 22:237-243.
26. Haagen EC, Nelen WLDM, Hermens RPMG, Braat DDM, Grol RPTM, Kremer
JAM: Barriers to physician adherence to a subfertility guideline. Hum
Reprod 2005, 20:3301-3306.
27. Alexander JA, Weiner BJ, Shortell SM, Baker LC, Becker MP: The role of
organizational infrastructure in implementation of hospitals' quality
improvement. Hosp Top 2006, 84:11-20.
28. Shortell SM, Bennett CL, Byck GR: Assessing the Impact of Continuous
Quality Improvement on Clinical Practice: What It Will Take to
Accelerate Progress. Milbank Quarterly 1998, 76:593-624.
doi: 10.1186/1748-5908-5-52
Cite this article as: de Vos et al., Implementing quality indicators in intensive
care units: exploring barriers to and facilitators of behaviour change Imple-
mentation Science 2010, 5:52