báo cáo khoa học: " Validity and usefulness of members reports of implementation progress in a quality improvement initiative: findings from the Team Check-up Tool (TCT)" pot
Bạn đang xem bản rút gọn của tài liệu. Xem và tải ngay bản đầy đủ của tài liệu tại đây (359.7 KB, 13 trang )
RESEARCH Open Access
Validity and usefulness of members reports of
implementation progress in a quality
improvement initiative: findings from the Team
Check-up Tool (TCT)
Kitty S Chan
1*
, Yea-Jen Hsu
1
, Lisa H Lubomski
2
and Jill A Marsteller
1,2
Abstract
Background: Team-based interventions are effective for improving safety and quality of healthcare. However,
contextual factors, such as team functioning, leadership, and organizational support, can vary significantly across
teams and affect the level of implementation success. Yet, the science for measuring context is immature. The goal
of this study is to validate measures from a short instrument tailored to track dynamic context and progress for a
team-based quality improvement (QI) intervention.
Methods: Design: Secondary cross-sectional and longitudinal analysis of data from a clustered randomized
controlled trial (RCT) of a team-based quality improvement intervention to reduce central line-associated
bloodstream infection (CLABSI) rates in intensive care units (ICUs).
Setting: Forty-six ICUs located within 35 faith-based, not-for-profit community hospitals across 12 states in the U.S.
Population: Team members participating in an ICU-based QI intervention.
Measures: The primary measure is the Team Check-up Tool (TCT), an original instrument that assesses context and
progress of a team-based QI intervention. The TCT is administered monthly. Validation measures include CLABSI
rate, Team Functioning Survey (TFS) and Practice Environment Scale (PES) from the Nursing Work Index.
Analysis: Temporal stability, responsiveness and validity of the TCT.
Results: We found evidence supporting the temporal stability, construct validity, and responsiveness of TCT
measures of intervention activities, perceived group-level behaviors, and barriers to team progress.
Conclusions: The TCT demonstrates good measurement reliability, validity, and responsiveness. By having more
validated measures on implementation context, researchers can more readily conduct rigorous studies to identify
contextual variables linked to key intervention and patient outcomes and strengthen the evidence base on
successful spread of efficacious team-based interventions. QI teams pa rticipating in an intervention should also find
data from a validated tool useful for identifying opportunities to improve their own implementation.
Background
Team-based interventions are effective for improving
safety and quality of healthcare for a variety of settings
and patient populations [1]. In fact, substantial reduc-
tions in central line-associated bloodstream infection
(CLABSI) rates for intensive care units (ICUs), shorter
hospital stays for stroke patients, and improvements in
end-of-life care have been reported for team-based
interventions [2-4]. However, significant variation across
teams in the achievement of desired outcomes has also
been observed, even within successful quality improve-
ment (QI) initiatives or co llaboratives (e.g., [5]). For
example, Mills and Weeks reported that the proportion
of successful teams ranged between 51% and 68% for
collaboratives focused on adverse drug events, improv-
ing safety in high risk areas, home-based primary care
* Correspondence:
1
Department of Health Policy and Management, Johns Hopkins Bloomberg
School of Public Health, 624 North Broadway, Baltimore, MD 21205, USA
Full list of author information is available at the end of the article
Chan et al. Implementation Science 2011, 6:115
/>Implementation
Science
© 2011 Chan et al; licensee BioMed Central Ltd. This is an Open Access article distributed under the te rms of the Creative Commons
Attribution License ( which permits unrestricted use, distribution, and reproduction in
any medium, provid ed the original work is properly cited.
for dementia patients, reducing falls and injuries due to
falls, and improving compensation and pensio n exami-
nation processes [6]. Similarly, Lynn et al. reported that
27% and 47% of the teams in two colla boratives on end-
of-life care achieved substantial improvements in out-
comes, even though 85% of the teams reported making
key changes to their systems to improve care [2]. Finally,
Schouten et al. found that the average length of stay
varied substantially across teams, although the colla-
borative realized an overall reduction of five days from
the hospital stay of stroke patients [4].
In these types of interventions, contextual factors,
such as team characteristics and organizational support,
significantly affect the level of implementation success.
In their analysis of the factors contributing to successful
collaboratives, Øvretveit et al. highlighted the role of
effective team functioning, communication, and relation-
ships for successful collaboratives [5 ]. Lemieux-Charles
and McGuire noted in their review that high-function-
ing teams have positive communication patterns, low
levels of interpersonal conflict, and high levels of colla-
boration, coordination, cooperation, and participation
[1]. Furthermore, these processes are positively asso-
ciated with perceived team effectiveness. Greater team
effectiveness can lead to stronger inte rvention effects
and more positive outcomes. Shortell et al.reported
that greater perceived team effectiveness was associated
with a larger number of and deeper changes being made
by teams participating in collaboratives to improve care
for the chronically ill [7]. Schouten et al. found that bet-
ter team functioning was associa ted with sho rter length
of stay and better adherence to recommended stroke
care [4]. In fact, QI team characteristics explained 40%
of the variance in length of hospital stay and 53 % of the
variance in adherence to recommended stroke care.
In addition to teamwork, leadership support and avail-
able resources may be important context variables.
However, team functioning, leadership and organiza-
tional support can vary across teams and, notably,
change over the course of an intervention [6]. Monitor-
ing implementation context can help teams and QI col-
laborative faculty and leadership in addressing problems
that hinder progress. Furthermore, identifying factors
tha t support succe ssful implementation can help ensure
that positive outcomes are achieved when interventions
spread to other settings.
Despite the importance of measuring conte xt, the
science of what domains to measure and how to mea-
sure them remains immature. Qualitative reports of
team activities and perceptions have been used to study
implementation processes in QI collaboratives [8-10].
However, these methods can be burdensome to use on
a routine basis. Validated measur es such as the 38-item
Team Climate I nventory [11] assessing workgroup
innovation and organizational climate are available, but
may not be tailored to the team processes or implemen-
tation concerns of a particular intervention. Given that
data collection is one of the major challenges faced by
teams participating in collaboratives [5], having a mea-
sure that is relevant, evaluates multiple domains, and is
feasible to administer on a routine basis is necessary for
successfully monitoring progress for a given
intervention.
The goal of this study is to demonstrate t hat a short
instrument, the Team Check-up Tool (TCT), can pro-
vide reliable and valid contextual data for monitoring
team progress within a QI intervention. This instrument
and an earlier version have been used to monitor team
progress and implementation context for large-scale QI
interventions to reduce bloodstream infections in the
ICU [12,13]. Evidence of temporal reliability, responsive-
ness and construct validity of the TCT will support its
futur e use as the intervention spreads to additional hos-
pitals and other settings. Finally, the TCT can serve as a
model for developing comparable measures for other
team-based QI interventions.
Methods
Data source
Data for this study were drawn from a multi-centered
clustered randomized controlled trial (RCT) of a team-
based QI intervention conducted in 46 ICUs [13]. Th e
ICUs were located within 35 faith-based, not-for-profit
community hospitals across 12 states. These hospitals
are part of two Adventist health systems. QI teams were
comprised of nurses and physicians from each partici-
pating ICU, and included senior executives from hospi-
tal administration. A nurse manager from the unit, a
nurse educator, or an infection preventionist typically
served as the team leader. The team is expected to
implement the intervention and educate other clinical
staff within the ICU in the targeted safety practices.
Team members completed monthly TCTs. CLABSI data
were obtained monthly from the infection preventio nist
at each hospital. Practice Environment Scale-Nursing
Work Index (PES-NWI) and Team Functioning Survey
(TFS) data, each collected once during the study period,
are used to validate the TCT measures. Study measures
[7,12,14] are described in greater detail below.
The intervention was a phased RCT, with 22 ICUs
(intervention group II) randomized to begin the interven-
tion seven months after the 23 ICUs in intervention
group I initiated the intervention. Another ICU joined
the project after the randomization p rocess had com-
pleted and participated in int ervention group II. Overall,
intervention-I group contributed 19 months of data,
while intervention-II group contributed 12 months of
data. The additional seven months of data from
Chan et al. Implementation Science 2011, 6:115
/>Page 2 of 13
intervention-I group provided a longer longitudinal
assessment of the measure and therefore were retained in
the analysis. Details regarding randomization and other
aspects of the parent study are provided elsewhere [13].
Primary measures
The Team Check-up Tool (TCT) is an original instru-
ment that assesses the following aspects of a QI inter-
vention: intervention activities; perceived unit-level
intervention-related behavior; implementation processes
and context such as leadership support and available
resources; and perceived barriers to team progress. The
TCTwasdevelopedbytheJohnsHopkinsQualityand
Safety Research Group (QSRG) for use in the Ke ystone
ICU project [12] and was later modified for use in the
project described here. It is a brief tool suitable for rou-
tine completion over the course of an intervention to
assess the progress of a specific team-based QI interven-
tion. Each month, ICU QI team leaders collected the
TCT from team members and mailed t hem to the
QSRG using a pa per form provided by the research
team. QI team leaders were asked to provide confidenti-
ality for team members by collecting the surveys folded
and placing them in an envelope without reviewing
them. The research team provided technical support for
data collection through conference calls and meetings,
but no financial incentive was provided for filling out
the tool. In general, participants estimated that it took
seven to ten minutes to complete the TCT. We focus
on the reliability and validity of intervention activities,
perceptions of unit-level behavior, and barriers to team
progress. We did not examine items that were expected
to vary significantly from month to month and for
which data were not available to validate these reports.
These items include queries on the number of times the
team met with each other, the senior leadership or the
board at the hospital, staff turnover, and distracting
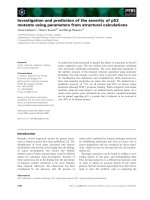
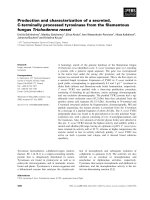
events. The conceptua l framework for the TCT is pre-
sented in Figure 1 and a copy of the TCT is provided in
Additional file 1, Table S1.
Intervention activities
The i ntervention was developed by the QSRG. T he
Comprehensive Unit-based Safety Program (CUSP) as
used in this collaborative was a five-step process
intended to improve safety, teamwork, and communica-
tion [15]. Activities included: morning brief ing, execu-
tive partnership, shadowing, daily goals, learning from a
defect, and a Science of Safety video. Educational activ-
ities provided t o unit staff may have included: internal
seminar, infectious control visit/talk, in-services/demo,
new written policy, posted steps, and putting protocol
on clipboards. Each team ma y participate in one or
more of these activities in any given month. Further
details on the intervention, and the suggested imple-
mentation framework (known as the ‘4Es’ )havebeen
Group Psychosocial Traits
-Valuing individual
contributions
-Cohesion (team unity)
-Goal agreement
-Self-assessed knowledge
Effectiveness
-ICU
-level
CR-BSI rates
Group
Composition
-Team size
-Percent physicians
Organizational
Context
-Teaching status
-Bedsize
Internal Processes
-Conflict
-Communication
-Leadership support/buy
-in
-Dissemination activities
-Participation of team members
Figure 1 Conceptual Framework underlying the Team Check-up Tool.
Chan et al. Implementation Science 2011, 6:115
/>Page 3 of 13
published elsewhere [3,16-18].Wecalculatedasumof
CUSP activities and a sum of educational activities to
reflect two aspects of the intensity of intervention
activity.
Perceived unit-level intervention-related behavior
QI team members were asked to report their perception
of the proportion (i.e., few, some, most, all) of unit staff
that consistently used the five behaviors that the study
intervention sought to increase: appropriate hand
hygiene; chlorhexidine skin preparation; full barrier pre-
cautions during line insertion; subclavian vein place-
ment; and ask daily about removing unnecessary lines.
We examined these items individually and as a sum
across the five behaviors. Unit-level performance for a
behavior was indicated if the member reported most or
all of unit staff consistently performed the activity. A
summed score was then calculated as the number of the
five behaviors performed by the unit.
Barriers to team progress
Team members were asked to indicate the frequency (i.
e., never/rarely, under one-half the time, one-half the
time, over one-half the time, almost always /always) with
which thirteen potential barriers slowed team progress.
These barriers include: insufficient knowledge of evi-
dence base for intervention, low consensus within team
regarding goals, lack of time, lack of QI skills, lack of
buy-in from other staff on the unit, data collection bur-
den, lack of leadership support, insufficient autonomy or
authority, and inability of team to work together. We
examined these items individually and as a summed
score. The summed score was calculated by adding the
number of individual barriers that were each faced one-
half the time or more. The summed score has a range
of 0 to 13. There were also five items (questions 15 m1
to 15m5, see Additional file 1, Table S1) on contributors
to poor team function that participants were asked to
respond to if they indicated the t eam could not work
together more than one -half the time (question 15 m).
These included: insufficient participation by one or
more members; some members do not value contribu-
tion of others; low or no feeling of being a team; per-
sonality conflicts; and poor conflict resolution skills.
Since only team members who reported poor team
functioning responded to these five questions, they were
not included in the summed score or further evaluated
due to insufficient number of responses.
Responses for the TCT are analyzed at the individual
level and at the ICU level in our study. For ICU-level
analyses, team member reports, if there are m ore than
one, are averaged across individual team member
reports for barrier items to obtain a group-level value
for the ICU each month.
Validation measures
Practice environment scale (PES)
The PES is part of the Nursi ng Work Index (NWI) that
was designed to measure organizational factors asso-
ciated with job satisfaction and the quality of nursing
care delivery [14]. The PES measures five components
of hospital culture: nursing participation in hospital
affairs; nursing foundations for quality of care; nurse
manager ability, leadership , and support of nurses; staff-
ing and resource adequacy; and the degree of collegial
nurse/physician relations hips. The five subscales have
been validated through a confirmatory factor analysis
and Cronbach’s alpha reliability estimates range between
0.71 and 0.84 [14]. The PES-NWI was filled out at base-
line by all nurses working in the participating ICUs.
Data from the baseline administration were used to
assess cross-sectional discriminant validity with the TCT
barriers to team progress measures. Data for the T CT
was the average score of the first quarter (March
through May 2007). Only ICUs in the first intervention
group were included because the second intervention
group submitted their first TCT seven months later
when they began implementing the intervention.
Team functioning survey (TFS)
The TFS [7] is adapted from the team effectiveness
instrument originally developed by G. Ross Baker and
colleagues at the University of Toronto, and modified
for use in the Improving Chronic Illness Care Evaluation
Respon-
dents agreed or disagreed, on a scale from 1 to 7, with
statements of how the team worked together and its
environment. There are five subscales for this instru-
ment: information/help available; organizational support;
team self-assessed skill; participation and goal agree-
ment; and team autonomy. This measure has been
shown to have good internal consistency, with Cron-
bach’s alpha for the five subscales ranging from 0.85 to
0.95 [7]. Overall perceived effectiveness was positively
related to both the number and depth of changes made
to improve care for the chronically ill. This instrument
was administered at the end of the intervention period
(August through October 2008). The TCT data used in
the TFS analyses was the average score of the last quar-
ter (July through September 2008).
CLABSI (central line-associated bloodstream infection)
The number of CLABSIs occurring within an ICU and
number of catheter-line days were collected monthly by
the hospital infection preventionist using the Centers for
Disease Control and Prevention’s (CDC) definitions and
standards . These data were reported
via the hospital system’ s corpora te headqua rters. Pri-
mary CLABSIs were determined using the following cri-
teria: bloodstream infections in ICU patients aged 18
years and older with a laboratory confirmed CLABSI
Chan et al. Implementation Science 2011, 6:115
/>Page 4 of 13
who had central lines in place within the 48-hour period
before the development of the infection. Non-ICU
patients, patients without central lines, secondary bloo d-
stream infections, and those present or incubating
within 72 hours of ad mission to the unit were excluded.
The rate of CL ABSI is calculated by dividing the num-
ber of infections by the numb er of catheter-line days
and is c ommonly expressed as the number of CLABSI
per 1000 line days.
Analysis
Measure reliability
To examine temporal stability, we calculated average
Spearman correlation (infection prevention behavior and
team barrier items) and percent agreement (intervention
CUSP, educational activities) during the third quarter of
the intervention, when activities, infection prevention
behaviors, and team progress barrier perceptions should
be stable. We used percent agreement rather than kappa
in our study due to the high expected agreement during
the stable period. An ICU-level agreement statistic for
each measure was determined by averaging the correla-
tions or percent agreement between months seven and
eight and between months eight and nine. Overall
agreement for each measure was calculated by averaging
across all ICUs that submitted enough TCTs for percent
agreement calculation during this period (n = 31). We
also reported internal consistency reliability, using Cron-
bach’s alpha, for perceived group-level behavior and bar-
riers to team progress. We did not calculate alpha for
the CUSP and education activities. Given the nature of
these activities, actively engaged teams may choose to
undertake different activities during different interven-
tion months. Therefore, in a particular month, participa-
tion in these activities may not be positively correlated.
This violates a basic assumption underlying internal
consistency that observed responses are driven by a
latent unidimensiona l cons truct and therefore positively
correlated.
Measure responsiveness
A measure that is expected to be used within QI initia-
tives must be able to reflect change when true change
has occurred, whi le demonstrating stability when little
real change has ta ken place. We examined measure
responsiveness during a high activity perio d during early
implementa tion and a low activity period later on when
intervention implementation and team behavior are
expected to have stabilized. For CUSP and educational
activities, the first quarter is the high activity period and
the third quarter is the low activity period. For each
ICU, an ICU-level value is calculated that summarizes
team member reports for each month. ICUs must have
at least two months of TCT data within the quarter to
be included (n = 31). As behavior is expected to lag
intervention activities, the first two quarters are identi-
fied as the high activ ity period for infection prevention
practices and team progress barriers. The third and
fourth quarters are defined as the stable period. ICUs
must have at least two TCTs in each quarter of the per-
iod to be included (n = 25). For intervention activities,
we calculated the number of activities undertaken per
month. For behavior and barrier measures, we calcu-
lated the average number of practices and barriers in
each quarter. We used a paired t-test at the ICU level to
determine if any of the changes, whether monthly or
quarterly, were significantly different from zero.
To demonstrate the ability of the measure to track
changes over time, we also graphed the bimonthly num-
bers of perceived infection prevention behaviors and the
numbers of team progress barriers over the course of
the intervention. Trends should reflect improved beha-
viors and lower barriers over time as ICU teams learn
to work together and resolve differences within the
team. All ICU-level data available for each month were
used, with 41 ICUs contributing data for this analysis.
For ICUs that had values for both months in a two-
month period, the average of the two months was used.
For those with only one month in a two-month period,
weusedtheavailablevalueasanestimatefortheaver-
age in the two-month period. As intervention group II,
from the phased parent RCT, had data only up to
month 12, the subsequent months include data only
from the 23 ICUs in intervention group I. Correlation
between these two measures over time was calculated.
Measure validity
Construct validity
Construct validity is demonstrated when the measure
under evaluation demonstrates associations that are
expected for the underlying trait based on theory or
prior empirical studies. We evaluated the construct
validity of the intervention activities, unit infection pre-
vention behavior, and perceptions of team progress bar-
riers by examining their interrelatio nships. We
hypothesized that greater concurrent CUSP and educa-
tion activities would be associated with gre ater number
of prevention behaviors undertaken by unit staff. Con-
versely, we hypothesized that a greater number of per-
ceived barriers to team progress would be associated
with lower numbers of prevention behaviors. Because
these measures are all part of the TCT tool, we were
able to perform these analyses using data from indivi-
dual team member reports (n = 1,406).
Convergent and discriminant validity
Convergent validity is demonstrated when measures of
similar constructs show significant associations with
each other. We evaluated the convergent validity for the
sum of team progress barrier items through Pearson
Chan et al. Implementation Science 2011, 6:115
/>Page 5 of 13
correlation with the overall TFS score. Similarly, we
examined the Pearson correlation of specific barrier
items with related TFS subscales. Specifically, we expect:
the barrier item on insufficient autonomy to be related
to the TFS team autonomy subscale; the three leader-
ship support barrier items to be related to the TFS orga-
nizational support subscale; and the barrier items o n
lack of team consensus and inability of team members
to work together to be related to the TFS subscale of
part icipation and goal agreement. Because higher scores
indicate poorer team functioning for both the sum and
individual barrier items, we expect to find significant
negative correlations with the TFS. Twenty-two ICUs
that submitted any TCT in the last quarter and also
submitted the TFS were included in this analysis.
Discriminant validity is demonstrated by the lack of an
association between measures of constructs that are
expected to have little or no relationship with each
other. The PES assesses an overall working environment
that may have only distal, weak linkages to the dynamics
within a specific QI team. Therefore, we hypothesize
that we will find weak to no correlation of the sum of
the barrier items with an overall score for the PES. Simi-
larly, we hypothesize that individual barrier items will
show weak correlation with the PES subscale on staffing
and resource adequacy at the hospital level, which is
expected to be weakly related to the barriers to team
progress experienced w ithin a small group intervention
team. Fifteen ICUs in the intervention group I that sub-
mitted any TCT in the first quarter and also submitted
the PES were included in this analysis. These analyses
were performed at the ICU level because individual
members cannot be link ed between the TCT, TFS, and
PES. Different representatives from the s ame ICU may
have contributed reports for different measures.
Predictive Validity
Predictive validity is demonstrated when an important
outcome or future event that is associated with the mea-
sured construct is observed empirically with the mea-
sure. We used the Cox proportional hazards model to
exami ne predict ive validity. We tested the association of
the summed team progress barriers with: time to the
first three months of no CLABSI, and time to first three
months when five prevention behaviors were consis-
tently performed by unit staff. Time was calculated in
months. We hypothesized that teams with fewer
reported barriers will achieve these desired outcomes in
a shorter period of time. Twenty-two ICUs that sub-
mitted a TCT in the first month of the implementation
were included in the CLABSI analysis. Fifteen ICUs that
submittedaTCTinthefirstmonthandenoughsubse-
quent TCT reports to identify three consecutive months
of unit prevention behaviors contributed to the infection
prevention behavior analysis.
For item-level analyses, where apriorihypotheses
were not proposed, we used the Bonferroni correction
to account for multiple comparisons.
Results
TheICUsincludedinthisstudycomefromhospitals
located in 12 states, with representation from the western
(CA, WA, OR), southern (FL, GA, KS, KY, NC, TN, TX)
and mid-we stern continental states (IL) and Hawaii.
Table 1 presents key characteristics of participating
ICUs. Most of these ICUs were of mixed specialty,
although 18% were coronary/cardiovascular ICUs.
Among the 46 ICUs participating in the multicenter trial,
an average of 51% submitted at least one TCT for each of
the first 12 months of the intervention. Among those
ICUs with at least one submitted TCT, the median num-
ber of TCT submitted by an ICU each month is 4.
Measure reliability and responsiveness
Internal consistency
Cronbach’s alpha was 0.78 for preventive behaviors and
0.91 for team barriers, indicating good reliability for
both sets of items. As noted in methods, the assumption
Table 1 Characteristics of ICU sample
Description of ICUs N = 46
No. of beds* (Mean, SD) 13 (7)
No. of nurses* (Mean, SD) 32 (19)
Type of ICUs*, %
Medical 2
Surgical 2
Mixed 76
Neurosurgical 2
Coronary/Cardiovascular 18
System, %
East 78
West 22
Location, State, %
CA 15
FL 46
GA 4
HI 2
IL 13
KS 2
KY 2
NC 2
OR 2
TN 4
TX 4
WA 2
Median number of TCT reports submitted, across
all ICU-months
4
(min: 1, max: 15)
* Data for these characteristics not available for 1 of the 46 ICUs included in
our analyses.
Chan et al. Implementation Science 2011, 6:115
/>Page 6 of 13
for alpha was not met for the CUSP and educational
items and, therefore, not calculated.
Temporal stability
Temporal stability of individual items, assessed during a
stable period in the third quarter, was good overall. Aver-
age monthly percent agreement ranges between 62% and
92% for individual CUSP activities and between 74% and
97% for educational activities. Average Spearman correla-
tion for infection prevention behaviors, except for hand
hygiene, is 0.58 to 0.71. The correlation for hand hygiene
is -0.15. Further examination of the distribution of this
item suggests that the low variance in this item may have
contributed to this unexpected result. All the values for
hand hygiene were between 3 and 4 for all three months,
with most of the values between 3 and 3.5.
Among the perception of barrier items, the Spearman
correlation ranges between 0.39 and 0.92, with 10 of the
13 items demonstrati ng at least moderate correlation (>
0.50) between mo nth. The lack of dat a precluded
calculation of average month ly correlation for the five
items (questions 15 m1 to 15m5, see Additional file 1,
Table S1) on contributors to poor team function. P arti-
cipants were asked to respond to these questions only if
they indicated the team could not work together more
than one-half of the time. Consequently, only five to
nine ICUs had any responses to these items and only
one to four ICUs had consecutive data to allow agree-
ment statistics to be calculated.
Evidence of temporal stability was also observed in the
lack of signi ficant change during the low activity period
(Table 2).
Measure responsiveness
In general, the measures of interest demonstrated good
responsiveness, with score changes observed in the
expected direction during the early period of implemen-
tation and more stable scores observed later on (see
Table 2). Specifically, the number of intervention (CUSP
and educational) activi ties increased significantly mont h
Table 2 TCT responsiveness and temporal stability*
Change in TCT items and sum scores High Activity (Change) Period Low Activity
(Stable) Period
Number of CUSP activities**
(Range: 0 to 6)
0.88 (p < 0.01)
Monthly,
1
st
quarter
-0.08 (p = 0.70)
Monthly,
3
rd
quarter
Number of Educational activities**
(Range 0 to 6)
0.57 (p = 0.06)
Monthly,
1
st
quarter
-0.28 (p = 0.15)
Monthly,
3
rd
quarter
Number of Infection Prevention Behaviors**
(Range: 0 to 5)
0.52 (p = 0.02)
Quarterly,
1
st
and 2
nd
0.01 (p = 0.92)
Quarterly,
3
rd
and 4
th
Appropriate hand hygiene (Range: 1 to 4) 0.11 (p = 0.08) -0.01 (p = 0.93)
Chlorhexidine skin preparation (Range: 1 to 4) 0.15 (p = 0.34) -0.02 (p = 0.83)
Full-barrier precautions during line insertion (Range: 1 to 4) 0.22 (p = 0.04) 0.06 (p = 0.44)
Subclavian vein placement (Range: 1 to 4) 0.13 (p = 0.14) 0.04 (p = 0.73)
Removing unnecessary lines (Range: 1 to 4) 0.20 (p = 0.04) 0.03 (p = 0.73)
Number of Team Progress Barriers**
(Range: 0 to 13)
-0.62 (p = 0.18)
Quarterly, 1
st
and 2
nd
-0.36 (p = 0.33)
Quarterly, 3
rd
and 4
th
Insufficient knowledge -0.21 (p = 0.15) -0.03 (p = 0.52)
Lack of team consensus -0.28 (p = 0.15) -0.25 (p = 0.13)
Not enough time -0.17 (p = 0.40) -0.01 (p = 0.94)
Lack of quality improvement skills -0.32 (p = 0.11) -0.11 (p = 0.16)
Not enough buy-in from other staff -0.39 (p = 0.03) -0.07 (p = 0.51)
Not enough buy-in from other physician staff -0.35 (p = 0.02) -0.06 (p = 0.78)
Not enough buy-in from other nursing staff -0.33 (p = 0.11) -0.04 (p = 0.63)
Burden of data collection -0.29 (p = 0.22) -0.11 (p = 0.36)
Not enough leadership support from executives -0.15 (p = 0.23) 0.13 (p = 0.43)
Not enough leadership support from physicians -0.21 (p = 0.17) 0.01 (p = 0.96)
Not enough leadership support from nurses -0.27 (p = 0.01) -0.01 (p = 0.94)
Insufficient autonomy/authority -0.23 (p = 0.03) -0.20 (p = 0.24)
Inability of team to work together -0.04 (p = 0.47) -0.04 (p = 0.60)
*Thirty-nine ICUs were included in the analysis (these 39 ICUs did not significantly differ from the seven ICUs excluded from the analyses in # beds, # MD
intensivists, # nurses, type of ICUs, geographic region, nor time to first month of zero infections); Please refer to the Additional file 1, Table S1 for specific
wording and response categories of each item: CUSP (item #1); educational activities (item #2); prevention behaviors (item #3a-e); barriers to team progress (item
#15a to 15 m, 15 m1 to 15m5).
Chan et al. Implementation Science 2011, 6:115
/>Page 7 of 13
to month in the first quarter and were smaller and not
statistically different from zero in the third quarter.
Similarly, the perceived proportion of unit staff that
consistently used infection prevention behaviors
incre ased significantly early in the implement ation stage
(0.52, p = 0.02, from first to second quarter) then stabi-
lized later in the implementation (0.01, p = 0.92, from
third to fourth quarter). At the item level, the changes
were largest for use of full ba rrier precautions (0.22, p =
0.04) and removing unnecessary lines (p = 0.20, p =
0.04).
The change in the sum of perceived barriers to team
progress was in the expected direction, with greater
decrease in barriers between the first two quarters than
in the last two quarters. However, the change score was
not statistically different from 0. Many of the individual
barrier items followed this trend, with larger decrease in
the early implementation stage (change score range:
-0.04to-0.39)andsmallerchangeinthelaterperiod
(change score range: -0.25 to 0.13). None of these
changes were statistically different from zero, except:
not enough buy-in from other unit staff; not enough
buy-in from phys ician staff ; not enough leadership from
nurses; and insufficient autonomy/authority.
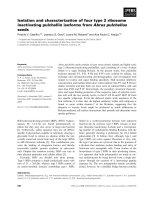
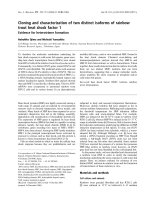
The ability of team member reports to estimate infec-
tion prevention behaviors and progress barriers was
demonstrated by the expected trends in improved per-
ceived group infection prevention behaviors and fewer
team progress barriers over time (Figure 2). Further-
more, similar trends were observed for the two interven-
tion groups, even though intervention group II lagged
intervention group I by seven months. The robustness
of these findings provides additional validation of the
responsiveness and stability properties of the TCT.
Measure validity
Construct validity
Table 3 presents findings from the construct validity
analyses. As hypothesized, we found that the sum of
barriers perceived is negatively associated with the sum
of infection prevention behaviors (Pearson r = -0.35, p <
0.001) . The correlation of individual items with the sum
of infection prevention behaviors ranged between -0 .13
to -0.37 (all p < 0.001). The strongest correlation were
Figure 2 Bimonthly numbers of perceived infection prevention behaviors and team progress barriers.
Chan et al. Implementation Science 2011, 6:115
/>Page 8 of 13
for insufficient buy-in from other staff members (r =
-0.37), other nursing staff (r = -0.36), and other physi-
cian staff (r = -0.34) and insufficient leadership support
from nurses (r = -0.31). Among respondents reporting
poor team function, insufficient participation was signifi-
cantly negatively related to prevention behaviors (r =
-0.19, p = 0.001). The other contributors to poor team
function were not (p = 0.21 to 0.48).
Convergent and discriminant validity
Convergent validity of the TCT barrier items were con-
firmed through a significant negative correlation with
the TFS (r = -0.56, p = 0.007). Discriminant validity was
demonstrated through a non-significant correlation with
the overall PES score (r = -0.12, p = 0.68).
The correlation of the individual barrier items with
their related convergent measure (TFS, various sub-
scales) and discriminant measure (hospital staffing and
resource adequacy subscale from the PES) is presented
in Table 4. At the item level, expected relationships
with TFS-specific subscales were generally confirmed,
reflecting convergent validity. There were two items,
insufficient knowledge of evidence and leadership sup-
port from physicians that did not demonstrate signifi-
cant negative correlation with the hypothesized TFS
subscale. However, the TFS scale on team autonomy
appears to be associated with the barrier items on buy-
in from other staff (r = -0.59, p = 0.004) and other nur-
sing staff (r = -0.57, p = 0.006) in the unit , although we
did not initially hypothesize an association between
these measures. As hypothesized, we did not find signifi-
cant correlation of the PES subscale on hospital staffing
and resource adequacy with any barrier items.
Predictive validity
We predicted that the fewer perceived barriers would be
associated with a shorter time to desired outcomes.
However, our findings did not support this hypothesis
(Table 5). There were small and non-significant relation-
ships between the sum of barriers with the time to first
quarter with no CLABSI and the time to first quarter
when the unit staff consistently performed the five pre-
vention behaviors. It is possible that low variance in
these outcomes may have limited our ability to detect
these associations. Of the 46 ICUs participat ing in the
trial, all achieved zero CLABSI (at some point during
the collaborative) and 25 achieved consistent perfor-
mance in all five prevention behaviors during the inter-
vention period. Twenty-six (57%) were able to achieve
zero CLABSI by month one, with another seven achiev-
ing this goal by month two (15%). Average CLABSI for
Intervention group I fell from 4.71 per thousand line
days in the first month to 0.27 in the fourth month.
Similarly, average CLABSI rate for group II was 5.60 per
Table 3 Construct validity: correlation of infection prevention activities with team progress barriers*
Sum of Infection Prevention Activity Questions
Barrier Questions Pearson correlation coefficient p value
Sum of #15a to #15 m -0.350 < 0.001**
a. Insufficient knowledge -0.205 < 0.001**
b. Lack of team member consensus -0.249 < 0.001**
c. Not enough time -0.262 < 0.001**
d. Lack of quality improvement skills -0.242 < 0.001**
e. Not enough buy-in from other staff members -0.374 < 0.001**
f. Not enough buy-in from other physician staff -0.343 < 0.001**
g. Not enough buy-in from other nursing staff -0.361 < 0.001**
h. Burden of data collection -0.187 < 0.001**
i. Not enough leadership support from executives -0.158 < 0.001**
j. Not enough leadership support from physicians -0.290 < 0.001**
k. Not enough leadership support from nurses -0.306 < 0.001**
l. Insufficient autonomy/authority -0.271 < 0.001**
m. Inability of team members to work together -0.130 < 0.001**
Sum of #15 m1 to #15m5 -0.046 0.412
m1. Insufficient participation -0.191 0.001
m2. Some members do not value the others’ contributions -0.073 0.209
m3. Low or no feeling of being a team -0.054 0.346
m4. Personality conflicts 0.041 0.475
m5. Poor conflict resolution skills -0.068 0.237
*Individual-level data (N = 1,406) were used for these analyses; N = 322 for 15 m1 to 15m5 items as these are asked only if respondent indicates that the team
could not work together more than one-half the time.
** p < 0.00384 (Bonferroni correction to account for multiple comparison was used.)
Chan et al. Implementation Science 2011, 6:115
/>Page 9 of 13
thousand line days in the first month of the implemen-
tation but only 0.12 by the fourth month. There may
also be multiple influences on these outcomes, among
which team perceived barriers may play a relatively
modest role.
Discussion
Implementation success for healthcare quality and safety
interventions can vary significantly across teams. Asses-
sing differences in team context and progress can help
QI team members make adjustmen ts over the course of
the intervention and help researchers design more
effective interventions. In addition, identifying factors
associated with successful teams can increase the likeli-
hood of implementation success for future teams. How-
ever, measures used for these assessments must be
reliable, valid, a nd responsive in order to be useful for
these purposes.
In this study, we examined the measurement proper-
ties of the TCT, a short instrument that has been used
to track implementation progress for an intervention to
reduce bloodstream infections within ICUs [13]. TCT
measures evaluated in this study included participation
in intervention components, perceptions of unit
Table 4 Convergent and discriminant validity: correlation with Team Functioning Survey and Practice Environmental
Scale
Barrier items Convergent Measure
TFS subscale
(n = 22 ICUs)
r Discriminant Measure
PES subscale
(n = 15 ICUs)
r
Insufficient knowledge of evidence Team self-assessed skill -0.20 Staffing/resource adequacy -0.08
Lack of team consensus Participation and goal agreement -0.61** Staffing/resource adequacy -0.15
Not enough time NA Staffing/resource adequacy 0.27
Lack of quality improvement skills Team self-assessed skills -0.52* Staffing/resource adequacy -0.11
Not enough buy-in from other staff Team autonomy╪ -0.59** Staffing/resource adequacy -0.21
Not enough buy-in from other physician staff NA Staffing/resource adequacy 0.08
Not enough buy-in from other nursing staff Team Autonomy╪ -0.57** Staffing/resource adequacy -0.16
Burden of data collection NA Staffing/resource adequacy -0.02
Not enough leadership support from executives Organizational support -0.52* Staffing/resource adequacy -0.33
Not enough leadership support from physicians Organizational support -0.34 Staffing/resource adequacy 0.02
Not enough leadership support from nurses Organizational support -0.43* Staffing/resource adequacy 0.05
Insufficient autonomy/authority Team autonomy -0.61** Staffing/resource adequacy -0.23
Inability of team members to work together Participation and goal agreement -0.45* Staffing/resource adequacy 0.23
* p < 0.05; **p < 0.01; ╪ most strongly significant correlation observed, not initially hypothesized; NA indicates no prior hypothesis regarding relationship
Table 5 Predictive validity: association of TCT barrier questions to infection prevention behaviors and CLABSI
Time to 1st Quarter with
No CLABSI
(n = 22 ICUs)
Time to 1st Quarter with
All 5 Prevention
Behaviors
(n = 15 ICUs)
Barrier questions Coef. P value Coef. P value
Sum of #15a to #15 m (Scores in the first month) -0.019 0.802 -0.020 0.822
a. Insufficient knowledge 0.060 0.801 0.215 0.376
b. Lack of team member consensus -0.074 0.807 0.000 0.999
c. Not enough time 0.090 0.696 -0.475 0.232
d. Lack of quality improvement skills -0.254 0.468 0.050 0.855
e. Not enough buy-in from other staff members -0.044 0.861 -0.004 0.986
f. Not enough buy-in from other physician staff -0.070 0.707 -0.305 0.183
g. Not enough buy-in from other nursing staff -0.057 0.830 -0.075 0.784
h. Burden of data collection -0.204 0.477 0.064 0.827
i. Not enough leadership support from executives -0.176 0.493 0.089 0.787
j. Not enough leadership support from physicians -0.007 0.975 -0.186 0.480
k. Not enough leadership support from nurses -0.010 0.968 -0.500 0.220
l. Insufficient autonomy/authority -0.285 0.336 -0.115 0.726
m. Inability of team members to work together -0.166 0.684 -0.333 0.564
*Based on unadjusted Cox proportional hazard regression models.
Chan et al. Implementation Science 2011, 6:115
/>Page 10 of 13
performance on infection prevention behavior, and ke y
barriers to team progress including lack of leadership
support and physician engagement, which are often cen-
tral to implementation success [6,19-21]. Our study
found support for the temporal stability, construct valid-
ity, and responsiveness of QI team member reports on
intervention activities, perceived unit-level behaviors,
and barriers to team progress from this instrument. At
both the item and aggregate level, the TCT measures
we evaluated were responsive during periods of high
implementation activity and stable during periods of low
implementation activity. Furthermore, the general trajec-
tories in behaviors and barriers were as predicted, with
greater number of prevention behaviors and fewe r bar-
riers observed over the course of the intervention. The
greatest changes took place within the first six months
of the intervention. These findings attest to the value of
these measures for detecting change and tracking the
course of implementation progress.
Construct validity for the evaluated measures was gen-
erally good. A hypothesized overall relationship between
infection prevention behaviors and barriers was sup-
ported by a significant moderate correlation. Individual
barrier items also demonstrated significant associations,
with items related to buy-in from physician, nursing,
and o ther clinical staff being the strongest. This finding
appears reasonable given that improved ICU behavior
depends on the commitment of the entire ICU staff, not
just of the QI team members.
Convergent and discriminant validity results were also
as hypothesized. The TFS [7], which assesses aspects of
team effecti veness, provides a goo d overall match to the
TCT barrier items and the expected association is sup-
ported by a significant and moderately strong correla-
tion. Similarly, moderate to strong correlations were
observed for TCT items to corresponding TFS sub-
scales. Discriminant validity is also good, with the TCT
barrier items demonstrating weak and non-significa nt
association with the overall a nd staffing/resource sub-
scale of the PES, a more general measure of nursing
work environment. Together, these findings indicate
that the TCT barrier items provide valid measures of
team effectiveness and functioning.
However, barriers to team progress at baseline did not
predict time to zero CLABSI rate as hypothesized. Con-
straint in the variance of this outcome may have limited
our ability to detect an association between our TCT
measur es and the key clinical outcome of interest in the
intervent ion. In addition, while barriers on the QI team
very likely affect intervention outcomes, they may not
be the strongest influences. Although these results did
not confirm our original hypothesis regarding predictive
validity, most findings from this study support the relia-
bility, validit y, and responsiveness of the TCT measures
we examined. Furthermore, the low burden of this
instrument, requiring less than 10 minutes to complete
and reporting only once a month, contributes to the
instrument’s feasibility for use in busy clinical settings
such as ICUs.
Demonstration of a practical, valid, and responsive
measure of context is important given the growing
interest in better theoretica l and practical understanding
of how context affects implementation success of effec-
tive QI interventions [5,7,22,23]. Among the contextual
elements that may influence QI success are staffing,
work environment, safety climate, teamwork, implemen-
tation activities, organizational culture, le arning and
mindfulness, leadership support, and engagement of par-
ticipants. The TCT emphasizes key internal processes
and group psychosocial traits of the QI team. Although
there is little consensus around how to define and mea-
sure implementation context, team functioning and
effectiveness have been examined in a number of QI
studies [1]. Unfortunately, few studies of team effective-
ness have used validated instruments.
Additional work to more clearly define and validate
measures of implementation context will be important
for advancing the research in this area. Several instru-
ments, although not specific to healthcare, have be en
validated. Anderson and West developed and validated
the factor structure, internal consistency, predictive
validity, and within-t eam consensus for the Team Cli-
mate Inventory, which focused on the climate for inno-
vation within work groups [11]. Wheelan and
Hochberger developed and validated the Group Devel-
opment Questionnaire, a general measure of the trajec-
tory of group f ormation and development [24]. These
instruments are clear ly valuable to the understanding of
team-based interventions. However, the generalized con-
cepts, while useful for research purposes, may be less
relevant for QI team members seeking opportunities to
achieve success in implementing a specific intervention.
Furthermore, these instruments are often longer and,
the refore, less feasible to complete on a routine basis in
busy clinical settings. Finally, the concepts they measure
may not reflect the rapid changes that take place within
a QI intervention. Teams and col laborative faculty often
need more frequent feedback on the effects of changes
they have made to improve care.
Measures of implementation context specific to QI
collaboratives have been developed and are being vali-
dated, including a 14-item instrument by Dückers et al.
[25] measuring team organizatio n, internal support (lea-
dership and organization), and external support (exter-
nal change age nts). The TFS provides a measure of
team functioning with demonstrated reliability that has
been used to assess team effectiveness in QI collabora-
tive [7]. Our study contributes to this lit erature on team
Chan et al. Implementation Science 2011, 6:115
/>Page 11 of 13
context measures for QI efforts by demonstrating the
responsiveness of the tool to changes in barriers to team
progress and unit-level infection prevention behaviors
over the course of the intervention. We also demon-
strated the impact of team functioning on intervention
effectiveness through the signific ant negative associ ation
between barriers to team progress and unit-level beha-
viors in infection behaviors. Finally, our study demon-
strated reliab ility for TCT through good temporal
stability during a stable phase of the intervention period.
These are critical properties to assess when tracking
progress of a team-based intervention.
Our study has s everal limitations. First, not all items
included in the TCT were evaluated as part of this
study. Validity of items related to the number of times
the teams met with executives and hospital boards, nur-
sing turnove r, and diffusion practi ces are challenging to
assess for t he measurement properties of interest,
because they represent events that may not cons istently
take place from month to month and gold standard data
for validation are not readily available. Second, many
items included in this instrument-such as the elements
of CUSP, educational activities, and infection prevention
behaviors-are specific to the interests and needs of the
target intervention. This will limit the applicability of
this measure and our findings to other QI interventions.
However, there are also benefits of this approach to
assessing implementation context. Specifically, tailoring
measures to QI intervention can make the assessments
more relevant and useful for teams participating in a
specific intervention. F or example, team members can
discuss specific barriers with each other and senior lea-
ders and resolve issues that hamper implementation
progress. As we expect the diffusion of the bloodstream
infection prevention intervention to expand, the findings
from this study should offer useful insights for future QI
teams. Third, the lack of significance for several correla-
tions with absolute r value between 0.21 and 0.33 that
we observed in the discriminant validity analyses may be
due to the small number of ICUs included. However,
giventhatmostofthecorrelationswereweak,we
expect that our overall conclusion would be robust even
if a larger sample of ICUs had been available. Fourth,
the findings of validity analyses that relied solely upon
TCT data (e.g., the association of prevention behaviors
and team barriers) may be a rtificially strengthened due
to common method bias. Fifth, we did not first establish
the convergence of member reports for the team level
measures, because we relied on a conceptual basis for
‘team’ (i.e., assignment to team) rather than an empiri-
cally-driven one that requires substantial correlation of
member reports. We reasoned that me mber perceptions
cannot be assumed to converge because team members
likely have different skills, roles, and experience and,
further, may have different observations of team experi-
ence. Despite these differences, individual members are
core contributors to and observers of the team. There-
fore, their reports, in aggregat e, provi de valid reflections
of team experience, irrespective of their level of conver -
gence. Finally, as a longi tudinal effectiveness project
conducted under naturalistic conditions, data quality
was a concern. Team-level response rate was challenging
to determine because QI team composition can change
over time. There was little assurance that member
responses were not seen by others within or outside the
QI team because conditions were not controlled by the
researc h team. Many ICUs had months when TCT data
were not submitted. This missing data led to the exclu-
sion of some ICUs from temporal stability and respon-
siveness analyses. However, a comparison of the
characteristics and CLABSI outcomes o f included and
excluded ICUs found no significant differences, suggest-
ing that our conclusions regarding the psychometric
properties of the TCT were sound.
Conclusions
Overall, our study provides evidence of measurement
reliability, validity, and responsiveness for a new tool
that can assist researchers and practitioners in better
understanding how context affects implementation suc-
cess. By having validated measures on implementation
context that are practical to administer longitudinally,
researchers can more readily conduct rigorous studies
on time varying contextual factors that affect implemen-
tation success, strengthening the evidence base on suc-
cessful spread of efficacious team-based interventions.
QI teams participating in an intervention should also
find data from a validated tool to be more convincing
and useful for identifying opportunities to improve
impl ementation within their own teams. Given the vari-
able success in QI interventions, the TCT offers a valid
and feasible tool to help improve the probability of suc-
cess and advance the science of QI.
Additional material
Additional file 1: The Team Check-up Tool. A copy of the full Team
Check-Up Tool instrument.
Acknowledgements and funding
This project was supported by a grant from the Robert Wood Johnson
Foundation (Grant # 65248, PI: Marsteller). We thank Dr. Peter Pronovost for
helpful comments on an earlier draft of this paper.
Author details
1
Department of Health Policy and Management, Johns Hopkins Bloomberg
School of Public Health, 624 North Broadway, Baltimore, MD 21205, USA.
2
Department of Anesthesiology and Critical Care Medicine, Johns Hopkins
School of Medicine, 1909 Thames Street, Baltimore, MD 21231, USA.
Chan et al. Implementation Science 2011, 6:115
/>Page 12 of 13
Authors’ contributions
KSC participated in the design of the study, led the development and
implementation of the analytic plan and data interpretation, and drafted the
manuscript. YJH acquired the data, performed all statistical analysis, and
participated in data interpretation and drafting of the paper. LHL
participated in conceptualization and design of the study and provided
critical review of earlier drafts. JAM conceived of the study, participated in its
design and drafting the manuscript, and provided critical review of earlier
drafts. All authors read and approved the final manuscript.
Authors’ information
KSC is an Associate Professor in the Department of Health Policy and
Management at the Johns Hopkins Bloomberg School of Public Health. JAM
is an Associate Professor in the same department and also has a joint
appointment with the Department of Anesthesiology and Critical Care
Medicine at Johns Hopkins School of Medicine. LHL is Assistant Professor
with the Department of Anesthesiology and Critical Care Medicine at Johns
Hopkins School of Medicine. YJH is currently a doctoral candidate in the
Department of Health Policy and Management at the Johns Hopkins
Bloomberg School of Public Health.
Competing interests
The authors declare that they have no competing interests.
Received: 4 October 2010 Accepted: 3 October 2011
Published: 3 October 2011
References
1. Lemieux-Charles L, McGuire WL: What do we know about health care
team effectiveness? A review of the literature. Med Care Res Rev 2006,
63:263-300.
2. Lynn J, Schall MW, Milne C, Nolan KM, Kabcenell A: Quality improvements
in end of life care: insights from two collaboratives. Jt Comm J Qual
Improv 2000, 26:254-267.
3. Pronovost P, Needham D, Berenholtz S, Sinopoli D, Chu H, Cosgrove S,
Sexton B, Hyzy R, Welsh R, Roth G, et al: An intervention to decrease
catheter-related bloodstream infections in the ICU. N Engl J Med 2006,
355:2725-2732.
4. Schouten LM, Hulscher ME, Akkermans R, van Everdingen JJ, Grol RP,
Huijsman R: Factors that influence the stroke care team’s effectiveness in
reducing the length of hospital stay. Stroke 2008, 39:2515-2521.
5. ØVretveit J, Bate P, Cleary P, Cretin S, Gustafson D, McInnes K, McLeod H,
Molfenter T, Plsek P, Robert G, et al: Quality collaboratives: lessons from
research. Qual Saf Health Care 2002, 11:345-351.
6. Mills PD, Weeks WB: Characteristics of successful quality improvement
teams: lessons from five collaborative projects in the VHA. Jt Comm J
Qual Saf 2004, 30:152-162.
7. Shortell SM, Marsteller JA, Lin M, Pearson ML, Wu SY, Mendel P, Cretin S,
Rosen M: The role of perceived team effectiveness in improving chronic
illness care. Med Care 2004, 42:1040-1048.
8. Hroscikoski MC, Solberg LI, Sperl-Hillen JM, Harper PG, McGrail MP,
Crabtree BF: Challenges of change: a qualitative study of chronic care
model implementation. Ann Fam Med 2006, 4:317-326.
9. Newton PJ, Halcomb EJ, Davidson PM, Denniss AR: Barriers and facilitators
to the implementation of the collaborative method: reflections from a
single site. Qual Saf Health Care 2007, 16:409-414.
10. Pearson ML, Wu S, Schaefer J, Bonomi AE, Shortell SM, Mendel PJ,
Marsteller JA, Louis TA, Rosen M, Keeler EB: Assessing the implementation
of the chronic care model in quality improvement collaboratives. Health
Serv Res 2005, 40:978-996.
11. Anderson NR, West MA: Measuring climate for work group innovation:
development and validation of the team climate inventory. J Organiz
Behav 1998, 19:235-258.
12. Lubomski LH, Marsteller JA, Hsu YJ, Goeschel CA, Holzmueller CG,
Pronovost PJ: The team checkup tool: evaluating QI team activities and
giving feedback to senior leaders. Jt Comm J Qual Patient Saf 2008,
34
:619-623, 561.
13. Marsteller JA, Sexton B, Hsu YJ, Hsiao CJ, Pronovost PJ, Thompson DA: A
multicenter, phased cluster-randomized controlled trial to reduce central
line-associated blood stream infections. Johns Hopkins Bloomberg School
of Public Health and Johns Hopkins School of Medicine July 2010, submitted
to a peer-reviewed journal .
14. Lake ET: Development of the practice environment scale of the Nursing
Work Index. Res Nurs Health 2002, 25:176-188.
15. Pronovost P, Weast B, Rosenstein B, Sexton JB, Holzmueller CG, Paine L,
Davis R, Rubin HR: Implementing and validating a comprehensive unit-
based safety program. J Patient Safety 2005, 1:33-40.
16. Pronovost PJ, Berenholtz SM, Goeschel C, Thom I, Watson SR,
Holzmueller CG, Lyon JS, Lubomski LH, Thompson DA, Needham D, et al:
Improving patient safety in intensive care units in Michigan. J Crit Care
2008, 23:207-221.
17. Pronovost PJ, Berenholtz SM, Goeschel CA, Needham DM, Sexton JB,
Thompson DA, Lubomski LH, Marsteller JA, Makary MA, Hunt E: Creating
high reliability in health care organizations. Health Serv Res 2006,
41:1599-1617.
18. Sawyer M, Weeks K, Goeschel CA, Thompson DA, Berenholtz SM,
Marsteller JA, Lubomski LH, Cosgrove SE, Winters BD, Murphy DJ, et al:
Using evidence, rigorous measurement, and collaboration to eliminate
central catheter-associated bloodstream infections. Crit Care Med 2010,
38:S292-298.
19. Caverzagie KJ, Bernabeo EC, Reddy SG, Holmboe ES: The role of physician
engagement on the impact of the hospital-based practice improvement
module (PIM). J Hosp Med 2009, 4:466-470.
20. Heenan M, Higgins D: Engaging physician leaders in performance
measurement and quality. Healthc Q 2009, 12:66-69.
21. Strasser DC, Burridge AB, Falconer JA, Herrin J, Uomoto J: Measuring team
process for quality improvement. Top Stroke Rehabil 2010, 17:282-293.
22. Helfrich CD, Weiner BJ, McKinney MM, Minasian L: Determinants of
implementation effectiveness: adapting a framework for complex
innovations. Med Care Res Rev 2007, 64:279-303.
23. Powell AA, Gravely AA, Ordin DL, Schlosser JE, Partin MR: Timely follow-up
of positive fecal occult blood tests strategies associated with
improvement. Am J Prev Med 2009, 37:87-93.
24. Wheelan SA, Hochberger JM: Validation studies of group development
questionnaire. Small Group Research 1996, 27:143.
25. Dückers ML, Wagner C, Groenewegen PP: Developing and testing an
instrument to measure the presence of conditions for successful
implementation of quality improvement collaboratives. BMC Health Serv
Res 2008, 8:172.
doi:10.1186/1748-5908-6-115
Cite this article as: Chan et al.: Validity and usefulness of members
reports of implementation progress in a quality improvement initiative:
findings from the Team Check-up Tool (TCT). Implementation Science
2011 6:115.
Submit your next manuscript to BioMed Central
and take full advantage of:
• Convenient online submission
• Thorough peer review
• No space constraints or color figure charges
• Immediate publication on acceptance
• Inclusion in PubMed, CAS, Scopus and Google Scholar
• Research which is freely available for redistribution
Submit your manuscript at
www.biomedcentral.com/submit
Chan et al. Implementation Science 2011, 6:115
/>Page 13 of 13