Composite Materials Handbook Part 9 pptx
Bạn đang xem bản rút gọn của tài liệu. Xem và tải ngay bản đầy đủ của tài liệu tại đây (171.91 KB, 15 trang )
MIL-HDBK-17-4
111
3.
MATERIALS PROPERTIES DATA
3.1
GENERAL INFORMATION
3.1.1
INTRODUCTION
3.1.2
PURPOSE, SCOPE, AND ORGANIZATION OF SECTION
3.1.3
DATA PRESENTATION FORMAT AND ORGANIZATION
3.1.3.1
Manuals
3.1.3.2
Electronic
3.2
REINFORCEMENT PROPERTIES
3.2.1
INTRODUCTION
The following information pertains to the mechanical properties of various fiber reinforcements. These
properties are based on material of varying maturity and should be considered experimental in nature.
“Typical” values are listed for approximate rule-of-mixtures calculations, but should not be used for final
design purposes. These “typical” values are based on as-received properties and some change in prop-
erties should be anticipated as a result of the composite manufacturing process.
3.2.2
ALUMINA FIBERS
3.2.3
BORON FIBERS
3.2.4
BORON CARBIDE FIBERS
3.2.5
CARBON AND GRAPHITE FIBERS
3.2.6
SILICON CARBIDE FIBERS
3.2.7
STEEL FIBERS
3.2.8
TUNGSTEN FIBERS
3.2.9
OTHER FIBERS
3.2.10
OTHER REINFORCEMENTS
3.3
PROPERTIES OF MATRIX MATERIALS
3.3.1
INTRODUCTION
Section 3.3 contains data for the properties of the neat matrix materials. These monolithic metals are
not manufactured by conventional techniques such as standard forging, rolling, and casting operations
(whose properties would be found in Mil-Handbook 5), but rather are uniquely processed to mimic the
processing operation which is used when making the composite. Common processing techniques for the
neat matrix are hipped foil and hipped sheet. With these types of processing techniques, the properties of
the neat matrix should be as close as possible to those of the
in-situ
matrix in the composite. Note, how-
ever, that the reinforcement may affect the
in-situ
properties of the matrix due to either residual stresses
MIL-HDBK-17-4
112
and/or reaction of the reinforcement and matrix and corresponding diffusion/depletion of the elements in
either constituent.
Property data taken from the neat matrix material (Section 3.3) and reinforcement (Section 3.2) can
be used with micromechanical analyses to aid in composite design. This is especially helpful to predict
composite properties for cross-ply laminates, for which limited information is currently given in this Hand-
book. Additionally, there are many types of composite properties for which limited or no data are available.
In such cases, composite properties can be estimated from the constituent properties using analytical re-
lationships. Note that matrix properties taken from conventionally processed alloys will be different from
those taken from the neat matrix, and, therefore, any estimation of composite properties based on con-
ventionally processed materials rather than those of the neat matrix should be done with caution.
3.3.2
ALUMINUMS
3.3.3
COPPERS
3.3.4
MAGNESIUMS
3.3.5
TITANIUMS
3.3.5.1
Ti-15V-3Cr-3Al-3Sn (NASA-LeRC)
The material was manufactured by Textron through consolidation of sheets or foils to yield plates ap-
proximately 0.4” thick. The plates were cut into specimens and heat treated in vacuum for 24 h at 1292°F
(700°C). Tensile tests were conducted according to test methods in Section 1.9.2.1. Direct induction
heating was used for testing at elevated temperatures. Test were generally performed in air. Some tests
were performed at Marshall Space Flight Center to assess the effects (and very little were observed) of
high pressure hydrogen on this material. These tests were either run in 5 ksi helium or 5 ksi hydrogen.
The majority of the Ti-15-3 tests were conducted to characterize various viscoplastic models. There-
fore, the failure of the specimen was not required and these tests were unloaded after a given amount of
strain. Hence, many of the failure strains in the raw data table in Appendix B have a “>” sign preceding the
strain at which unloading occurred. For the same reason, many of the UTS values are missing. For inter-
rupted tests, only those UTS values are given where the specimen had already reached a maximum
stress and subsequently softened until the specimen was unloaded.
The table of average tensile properties for room temperature tests is shown in Tables 3.3.5.1(a) and
(d). Since strain rate does not play a significant role at room temperature for this material, and neither did
testing in high pressure hydrogen or helium, all of these data were combined to give the room temperature
information in this table. The term “lot” in this table refers to one plate of material.
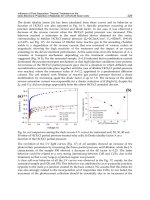
The UTS is given in Figure 3.3.5.1(a) as a function of temperature and strain rate. There is approxi-
mately a factor of two decrease in the UTS between 75°F (24°C) and 1000°F (538°C). At 1000°F (538°C)
the UTS is very dependent upon the strain rate.
The elastic modulus is plotted as a function of temperature and strain rate in Figure 3.3.5.1(b). The
data points in this figure are not means but are values from individual tests. The Figure shows that the
modulus generally decreases 13% between room temperature and 1000°F (538°C). Up to 800°F (427°C)
there is little effect of strain rate on modulus. Above 800°F (427°C), the modulus rapidly decreases with
increasing temperature for specimens tested at the slower strain rate. This is not depicted in this figure,
but can be ascertained by examining the raw data in Appendix B.
The proportional limit, 0.02% and 0.2% yield strengths are plotted in Figures 3.3.5.1(c) – (e) as a
function of temperature and strain rate. There is approximately a factor of two decrease in the yield
strengths between 75°F (24°C) and 1000°F (538°C). At temperatures greater than or equal to 600°F
MIL-HDBK-17-4
113
(316°C), the yield strengths become highly strain rate sensitive. The slower the strain rate, the lower is the
yield strength and the lower is the temperature at which a rapid drop-off in the yield strength occurs with
increasing temperature.
Tensile curves are plotted as a function of strain rate for three different temperatures: 400°F (204°C)
(Figure 3.3.5.1(f)), 800°F (427°C) (Figure 3.3.5.1(g)), and 1000°F (538°C) (Figure 3.3.5.1(h)). At 400°F
(204°C) there is minimal strain rate sensitivity. However, at 800°F (427°C), strain rate has a large effect on
the tensile behavior. At a temperature of 800°F (427°C), a strain rate of 1x10
-5
s
-1
is slow enough to induce
softening after the attainment of the UTS. At still slower strain rates, dynamic strain aging is active, which
leads to hardening as the tests progress.
At 1000°F (538°C) the temperature is high enough to induce softening after attaining the UTS. At a
strain rate of 1x10
-6
s
-1
, the material exhibits dynamic strain aging, but not to the extent of that observed at
800°F (427°C). Dynamic strain aging results in the hardening effect observed in the initial part of the
stress-strain curve.
Figures 3.3.5.1(i) and (j) show the effect of temperature on the tensile behavior at two different strain
rates: 1x10
-4
and 1x10
-6
s
-1
. The maximum stress in each curve decreases with increasing temperature.
Additionally, dynamic strain aging results in some anomalous behavior in some of the curves (see, for ex-
ample, the curves at 800°F (427°C) and 1000°F (538°C) at a strain rate of 1x10
-6
s
-1
).
MIL-HDBK-17-4
114
3.3.5.1 Ti-15V-3Cr-3Al-3Sn HIP sheet/foil*
Ti
MATERIAL:
Ti-15V-3Cr-3Al-3Sn HIP sheet/foil
Ti-15-3
Summary
MATRIX: Ti-15V-3Cr-3Al-3Sn MANUFACTURER: Textron
PROCESS SEQUENCE: Hipped Sheet or Foil
PROCESSING: SOURCE: NASA LeRC
Date of matrix manufacture Date of data submittal 6/98
Date of testing 5/96-7/97 Date of analysis 8/98
MATRIX PROPERTY SUMMARY
Temperature 75°F 400°F 600°F 800°F 900°F 1000°F
Environment Air
(1)
Air Air Air Air Air
Tension
SS-SSSS -S SSS -S SSS -S SSS SS SSS SS SSS
(1) Some testing at 5 ksi Helium and 5 ksi Hydrogen, results pooled.
Classes of data: F - Fully approved, S - Screening in order: Strength/Modulus/Poisson’s Ratio/Strain-to-failure/Proportional
Limit/0.02-offset-strength/0.2-offset-strength.
* Raw data tables are presented in Appendix B.
MIL-HDBK-17-4
115
MATERIAL: Ti-15V-3Cr-3Al-3Sn HIP sheet/foil
Table 3.3.5.1(a)
Ti HIP sheet/foil
Ti-15-3
TEST METHOD: Sec. 1.9.2.1 MODULUS Least squares analysis up
Tension
CALCULATION: to proportional limit
75, 400, 600
Air
PRE-TEST EXPOSURE: Vacuum 1292
°
F, 24 hr SOURCE: NASA LeRC
Screening
NORMALIZED BY: N/A
Temperature (°F) 75 400 600
Environment Air (1) Air Air
Strain Rate (1/s) (3) (3)
1
x
10
-
4
Mean 124
Minimum 120
Maximum 127
C.V.(%) 1.83
B-value (2)
F
tu
Distribution ANOVA
(ksi) C
1
2.89
C
2
12.9
No. Specimens 7
No. Lots 2
Approval Class Screening
Mean 12.4 12.3 11.4
Minimum 11.9 12.0
Maximum 13.0 12.6
E
t
C.V.(%) 3.39
(Msi) No. Specimens 8 3 1
No. Lots 3 2 1
Approval Class Screening Screening Screening
Mean
ν
m
No. Specimens
No. Lots
Approval Class
Mean 19.3
Minimum 16.8
Maximum 22.1
C.V.(%) 10.7
B-value (2)
ε
tu
Distribution Normal
(%) C
1
19.3
C
2
2.06
No. Specimens 7
No. Lots 2
Approval Class Screening
(1) Some testing at 5 ksi Helium and 5 ksi Hydrogen, results pooled.
(2) B-basis values appear for fully-approved data only.
(3) Strain rates pooled (1/s): 1
x
10
-
6
, 8.3
x
10
-
5
, 1
x
10
-
4
, 2
x
10
-
3
.
MIL-HDBK-17-4
116
MATERIAL: Ti-15V-3Cr-3Al-3Sn HIP sheet/foil
Table 3.3.5.1(b)
Ti HIP sheet/foil
Ti-15-3
TEST METHOD: Sec. 1.9.2.1 MODULUS Least squares analysis up
Tension
CALCULATION: to proportional limit
800
Air
PRE-TEST EXPOSURE: Vacuum 1292
°
F, 24 hr SOURCE: NASA LeRC
Screening
NORMALIZED BY: N/A
Temperature (°F) 800 800 800 800
Environment Air Air Air Air
Strain Rate (1/s)
1
x
10
-
8
1
x
10
-
6
1
x
10
-
5
1
x
10
-
4
Mean
Minimum
Maximum
C.V.(%)
B-value
F
tu
Distribution
(ksi) C
1
C
2
No. Specimens
No. Lots
Approval Class
Mean 17 10.8 10.8 11.3
Minimum
Maximum
E
t
C.V.(%)
(Msi)No. Specimens1111
No. Lots 1111
Approval Class Screening Screening Screening Screening
Mean
ν
m
No. Specimens
No. Lots
Approval Class
Mean
Minimum
Maximum
C.V.(%)
B-value
ε
tu
Distribution
(%) C
1
C
2
No. Specimens
No. Lots
Approval Class
MIL-HDBK-17-4
117
MATERIAL: Ti-15V-3Cr-3Al-3Sn HIP sheet/foil
Table 3.3.5.1(c)
Ti HIP sheet/foil
Ti-15-3
TEST METHOD: Sec. 1.9.2.1 MODULUS Least squares analysis up
Tension
CALCULATION: to proportional limit
900, 1000
Air
PRE-TEST EXPOSURE: Vacuum 1292
°
F, 24 hr SOURCE: NASA LeRC
Screening
NORMALIZED BY: N/A
Temperature (°F) 900 1000 1000 1000
Environment Air Air Air Air
Strain Rate (1/s)
1
x
10
-
4
1
x
10
-
6
1
x
10
-4
1
x
10
-
3
Mean 75 24 43 67
Minimum
Maximum
C.V.(%)
B-value
F
tu
Distribution
(ksi) C
1
C
2
No. Specimens1111
No. Lots 1111
Approval Class Screening Screening Screening Screening
Mean 10.8 5.3 10.5 11
Minimum 10.7
Maximum 10.9
E
t
C.V.(%)
(Msi)No. Specimens2111
No. Lots 2111
Approval Class Screening Screening Screening Screening
Mean
ν
m
No. Specimens
No. Lots
Approval Class
Mean
Minimum
Maximum
C.V.(%)
B-value
ε
tu
Distribution
(%) C
1
C
2
No. Specimens
No. Lots
Approval Class
MIL-HDBK-17-4
118
MATERIAL: Ti-15V-3Cr-3Al-3Sn HIP sheet/foil
Table 3.3.5.1(d)
Ti HIP sheet/foil
Ti-15-3
TEST METHOD: Sec. 1.9.2.1 MODULUS Least squares analysis up
Tension
CALCULATION: to proportional limit
75, 400, 600
Air
PRE-TEST EXPOSURE: Vacuum 1292
°
F, 24 hr SOURCE: NASA LeRC
Screening
NORMALIZED BY: N/A
Temperature (°F) 75 400 600
Environment Air (1) Air Air
Strain Rate (1/s) (3) (3)
1
x
10
-
4
Mean 103 75.3 69
Minimum 94 65
Maximum 111 81
C.V.(%)
B-value
F
pl
Distribution
(ksi) C
1
C
2
No. Specimens 2 3 1
No. Lots 2 2 1
Approval Class Screening Screening Screening
Mean 113 85.3 78
Minimum 108 84
Maximum 117 87
C.V.(%)
B-value
F
ty0 02.
Distribution
(ksi) C
1
C
2
No. Specimens 2 3 1
No. Lots 2 2 1
Approval Class Screening Screening Screening
Mean 115 95.7 87
Minimum 110 95
Maximum 124 96
C.V.(%) 3.64
B-value (2)
F
ty0.2
Distribution ANOVA
(ksi) C
1
5.74
C
2
5.75
No. Specimens 8 3 1
No. Lots 3 2 1
Approval Class Screening Screening Screening
(1) Some testing at 5 ksi Helium and 5 ksi Hydrogen, results pooled.
(2) B-basis values appear for fully-approved data only.
(3) Strain rates pooled (1/s): 1
x
10
-
6
, 8.3
x
10
-
5
, 1
x
10
-
4
, 2
x
10
-
3
.
MIL-HDBK-17-4
119
MATERIAL: Ti-15V-3Cr-3Al-3Sn HIP sheet/foil
Table 3.3.5.1(e)
Ti HIP sheet/foil
Ti-15-3
TEST METHOD: Sec. 1.9.2.1 MODULUS Least squares analysis up
Tension
CALCULATION: to proportional limit
800
Air
PRE-TEST EXPOSURE: Vacuum 1292
°
F, 24 hr SOURCE: NASA LeRC
Screening
NORMALIZED BY: N/A
Temperature (°F) 800 800 800 800
Environment Air Air Air Air
Strain Rate (1/s)
1
x
10
-
8
1
x
10
-
6
1
x
10
-5
1
x
10
-
4
Mean 5.2 20 56 59
Minimum
Maximum
C.V.(%)
B-value
F
pl
Distribution
(ksi) C
1
C
2
No. Specimens 1 1 1 1
No. Lots 1 1 1 1
Approval Class Screening Screening Screening Screening
Mean 40 29 69 73
Minimum
Maximum
C.V.(%)
B-value
F
ty0 02.
Distribution
(ksi) C
1
C
2
No. Specimens 1 1 1 1
No. Lots 1 1 1 1
Approval Class Screening Screening Screening Screening
Mean 43 83 84
Minimum
Maximum
C.V.(%)
B-value
F
ty0.2
Distribution
(ksi) C
1
C
2
No. Specimens 1 1 1
No. Lots 1 1 1
Approval Class Screening Screening Screening
MIL-HDBK-17-4
120
MATERIAL: Ti-15V-3Cr-3Al-3Sn HIP sheet/foil
Table 3.3.5.1(f)
Ti HIP sheet/foil
Ti-15-3
TEST METHOD: Sec. 1.9.2.1 MODULUS Least squares analysis up
Tension
CALCULATION: to proportional limit
900, 1000
Air
PRE-TEST EXPOSURE: Vacuum 1292
°
F, 24 hr SOURCE: NASA LeRC
Screening
NORMALIZED BY: N/A
Temperature (°F) 900 1000 1000 1000
Environment Air Air Air Air
Strain Rate (1/s)
1
x
10
-
4
1
x
10
-
6
1
x
10
-4
1
x
10
-
3
Mean 54 6 23 50
Minimum 50
Maximum 57
C.V.(%)
B-value
F
pl
Distribution
(ksi) C
1
C
2
No. Specimens 2 1 1 1
No. Lots 2 1 1 1
Approval Class Screening Screening Screening Screening
Mean 65 6 33 60
Minimum
Maximum
C.V.(%)
B-value
F
ty0 02.
Distribution
(ksi) C
1
C
2
No. Specimens 2 1 1 1
No. Lots 2 1 1 1
Approval Class Screening Screening Screening Screening
Mean 74.5 8 42 67
Minimum 74
Maximum 75
C.V.(%)
B-value
F
ty0.2
Distribution
(ksi) C
1
C
2
No. Specimens 2 1 1 1
No. Lots 2 1 1 1
Approval Class Screening Screening Screening Screening
MIL-HDBK-17-4
121
20
40
60
80
100
120
140
0 200 400 600 800 1000 1200
2x10
-3
1x10
-3
1x10
-4
8.3x10
-5
1x10
-6
F
tu
(ksi)
Temperature (
o
F)
Strain Rates (1/s)
FIGURE 3.3.5.1(a)
Ultimate tensile strength as a function of temperature and strain rate.
10.0
10.5
11.0
11.5
12.0
12.5
13.0
13.5
0 200 400 600 800 1000 1200
E
t
(Msi)
2x10
-3
1x10
-3
1x10
-4
1x10
-5
8.3x10
-5
1x10
-6
Temperature (
o
F)
Strain Rates (1/s)
FIGURE 3.3.5.1(b)
Tensile modulus as a function of temperature and strain rate.
MIL-HDBK-17-4
122
0
20
40
60
80
100
120
0 200 400 600 800 1000 1200
2x10
-3
1x10
-3
1x10
-4
1x10
-5
1x10
-6
1x10
-8
F
pl
(ksi)
Temperature (
o
F)
Strain Rates (1/s)
FIGURE 3.3.5.1(c)
Proportional limit as a function of temperature and strain rate.
0
20
40
60
80
100
120
0 200 400 600 800 1000 1200
2x10
-3
1x10
-3
1x10
-4
1x10
-5
1x10
-6
1x10
-8
F
ty0.02
(ksi)
Temperature (
o
F)
Strain Rates (1/s)
FIGURE 3.3.5.1(d)
0.02-offset-yield-strength as a function of temperature and strain rate
MIL-HDBK-17-4
123
0
20
40
60
80
100
120
140
0 200 400 600 800 1000 1200
2x10
-3
1x10
-3
1x10
-4
8.3x10
-5
1x10
-5
1x10
-6
F
ty0.2
(ksi)
Temperature (
o
F)
Strain Rates (1/s)
FIGURE 3.3.5.1(e)
0.2-offset-yield-strength as a function of temperature and strain rate.
0
20
40
60
80
100
120
0 0.01 0.02 0.03 0.04 0.05 0.06 0.07 0.08
1x10
-4
1x10
-3
1x10
-6
Stress (ksi)
Strain
Strain Rate (1/s)
FIGURE 3.3.5.1(f)
Tensile curves at 400°F (204°C) as a function of strain rate.
MIL-HDBK-17-4
124
0
20
40
60
80
100
120
0 0.005 0.01 0.015 0.02 0.025 0.03 0.035 0.04
1x10
-4
1x10
-5
1x10
-6
1x10
-8
Stress (ksi)
Strain
Strain Rate (1/s)
FIGURE 3.3.5.1(g)
Tensile curves at 800°F (427°C) as a function of strain rate.
0
10
20
30
40
50
60
70
0 0.01 0.02 0.03 0.04 0.05 0.06 0.07 0.08
1x10
-3
1x10
-4
1x10
-6
Stress (ksi)
Strain
Strain Rate (1/s)
FIGURE 3.3.5.1(h)
Tensile curves at 1000°F (538°C) as a function of strain rate.
MIL-HDBK-17-4
125
0
20
40
60
80
100
120
140
0 0.01 0.02 0.03 0.04 0.05 0.06 0.07 0.08
Stress (ksi)
Strain
1000
o
F
900
o
F
800
o
F
600
o
F
400
o
F
75
o
F
FIGURE 3.3.5.1(i)
Tensile curves at a strain rate of 10
-4
s
-1
as a function of temperature.
0
20
40
60
80
100
120
0 0.01 0.02 0.03 0.04 0.05 0.06 0.07 0.08
Stress (ksi)
Strain
400
o
F
800
o
F
1000
o
F
FIGURE 3.3.5.1(j)
Tensile curves at a strain rate of 10
-6
s
-1
as a function of temperature.
3.3.6
OTHERS