Conductive Polymers and Plastics in Industrial Applications Part 4 pptx
Bạn đang xem bản rút gọn của tài liệu. Xem và tải ngay bản đầy đủ của tài liệu tại đây (378.41 KB, 20 trang )
Custom rheometry plates were made to
enable electrical resistivity and shear modu-
lus to be measured simultaneously as seen in
Figure 1. Ceramic plates were sandwiched
between standard aluminum plates (that fit
in the RMS disposable plate fixture) and
brass plates which contact the sample. Steel
screws were used to secure the plates to-
gether and make electrical contact with the
leads. These screws were insulated from the
disposable plate fixture by ceramic spacers.
The leads were connected to a Fluke
multimeter with which resistance measure-
ments were made.
RESULTS
The elastic shear modulus (G') as a function
of dynamic strain amplitude is shown for
composites of 2.5 to 40v% unmodified car-
bon black in Figure 2. Figure 3 is the corre-
sponding graph for composites of 10v% to
40v% surface modified carbon black. G'
values for the composites with less than
17v% carbon black are independent of
strain up to about 5% strain and all lie within
experimental error of each other. The noise
seen at the lower strains was due to low
torque values. Above about 18v% carbon
black, G' becomes increasingly dependent
on strain amplitude as the carbon black
loading increases. At the low strain limit
(about 0.5% strain) G' is at a maximum and
independent of strain. Both the unmodified
and modified carbon black composites
show increased G'(low strain) at about
18v% carbon black which is consistent with a percolation theory.
4
At 25v% carbon black and
58 Conductive Polymers and Plastics
Figure 1. Electrical-rheological plate fixture for Rheometrics
RMS-705 rheometer.
Figure 2. Effect of unmodified carbon black loading on G' strain
dependence. Bohlin VORM, 10 radians/sec., 190
o
C.
above, the G'(low strain) and the strain dependence of G' were much greater for the surface
modified carbon black composite than for the unmodified carbon black composites.
Resistance measurements were made concurrent with G' measurements (using the RMS
custom plates) as a function of strain amplitude. In Figure 4, the resistivity increases and G'
decreases with increasing strain amplitude for the unmodified 35v% carbon black composite.
This result is consistent with the findings of Voet and Cook
5
for carbon black in rubber com-
posites.
The resistivity decreased with decreasing temperature while G'(low strain) increased.
The sharp change below 130
o
C was due to crystallization of the composite.
Shear creep compliance for the unmodified 35v% carbon black composite for the curves
from 32 to 128 Pa are within experimental error. The creep compliance increases between
shear stresses of 128 Pa and 256 Pa. This indicates yield stress behavior. The exponential
shape of the curves is as expected for an uncrosslinked entangled polymer.
6
No yield stress behavior is seen and there is an apparent linear relationship between the
compliance and time. This linear relationship was unexpected. Exponential curves are typical
for entangled polymers.
6
Rheological Characterization 59
Figure 3. Effect of surface modified carbon black loading on
G' strain dependence. Bohlin VORM, 10 radians/sec., 190
o
C.
Figure 4. Simultaneous G' and resistivity measurements of
35v% unmodified carbon black composite with increasing
strain amplitude. RMS-705, 10 radians/sec., 190
o
C using
electrical-rheological fixture.
CONCLUSIONS
Above a critical volume fraction of carbon black, the G' of the composite is very strain de-
pendent. The critical volume fraction dependence is consistent with percolation theory and
the strain dependence agrees with that recorded in the literature for other systems. These re-
sults support the theory that a carbon black network (possibly secondary agglomeration) is
being measured.
Simultaneous electrical and rheological measurements show a correlation between
G'(low strain) and resistivity. Increased strain amplitude or temperature results in decreased
G'(low strain) and increased resistivity. This correlation supports the theory that the strain de-
pendence of G' is due to the breaking of a carbon black network. The surface modified carbon
black composite showed significantly greater G'(low strain) and strain dependence of G' than
did the unmodified carbon black composite. This indicates a stronger interaction between the
surface modified carbon black particles.
The linear relationship between shear creep compliance and time at constant stress for
the surface modified carbon black composite also indicates a strong influence of the carbon
black network. The low compliance at short times (low strain) is consistent with the high G' at
low strains. With time (and strain), the carbon black network breaks down, and the creep
compliance increases linearly. The unmodified carbon black composite shows more typical
polymeric behavior. The creep compliance increases exponentially with time due to the relax-
ation of chain entanglements. This increased “polymeric” behavior may be due to lower
carbon black network interaction, or a greater polymer interaction with the carbon black net-
work.
ACKNOWLEDGMENTS
The composites were provided by Mark Wartenberg, Larry Smith, Art Lopez and Joe
Pachinger of Raychem Corporation in conjunction with their research projects.
REFERENCES
1 A.I. Medalia, Rubber Chem. Technol., 60, 45-61 (1987).
2 A.R. Payne, J. Appl. Polym. Sci., 8, 2661-2686 (1965).
3 M. Gerspacher, in Carbon Black Science and Technology, 2nd ed., Edited by J-B. Donnet, R.C. Bansal, and M-J. Wang,
Marcel Dekker, Inc., New York, Chap. 11 (1993).
4 R.D. Sherman, L.M. Middleman, S.M. Jacobs, Polym. Eng. Sci., 23(1), 36-46 (1983).
5 A. Voet, F.R. Cook, Rubber Chem. Technol., 41, 1207-1215 (1968).
6 J.D. Ferry, Viscoelastic Properties of Polymers, 3rd ed., John Wiley and Sons, Inc., New York, 37-39 (1980).
60 Conductive Polymers and Plastics
Estimation of the Volume Resistivity of Conductive
Fiber Composites by Two New Models
Mark Weber
Research and Technology Centre, Calgary, Alberta, Canada
M. R. Kamal
Department of Chemical Engineering, McGill University, Montreal, Quebec, Canada
INTRODUCTION
Polymers reinforced with electrically conductive particles can be used in applications where
electromagnetic interference (EMI) shielding is required.
1-4
The modelling of the electrical
properties of conductive composites increases the understanding of the relationship between
fiber properties and composite behavior. There exist several models and theories which pre-
dict electrical conductivity. Foremost among these is the percolation theory. The essence of
percolation theory is to determine how a given set of sites, which may be regularly or ran-
domly positioned in some space, is interconnected.
5
Inherent to the theory is the fact that at
some critical probability, called the percolation threshold, a connected network of sites is
formed which spans the sample, causing the system to “percolate”. The fraction of fibers or
fillers required to achieve percolation can be modelled by a Monte Carlo method.
5-10
Predic-
tions have shown agreement with experimental data,
9-11
but the results are dependent on many
variables, including lattice size, particle-particle penetration, tunneling effects, and particle
dimensions.
Although the percolation theory has received the greatest attention as a predictor of elec-
trical conductivity, other models have also been proposed. Bueche
12
considered the problem
of conductive particles in a nonconducting matrix as analogous to the concept of polymer
gelation, as proposed by Flory. D’Ilario and Martinelli
13
attempted to fit experimental data for
poly(p-phenylene sulfide) reinforced with iron and graphite particles with the Bueche model.
The calculated thresholds did not agree with the experimental results. Nielsen
14
extended the
equations from the theory of elastic moduli to calculate the electrical and thermal conductivi-
ties of two-phase systems. Fiber and matrix conductivities are required, and the maximum
packing fraction of particles must be estimated. Bigg
15
and Berger and McCullough
16
used
the Nielsen model to predict the resistivity of aluminum particle composites. The discrepancy
between model predictions and experimental data was very large. McCullough
17
modified a
generalized combining rule for transport properties for application to percolation transport
mechanisms. The equation predicts the composite conductivity in either the longitudinal,
transverse, or normal directions Berger and McCullough
16
found that the generalized com-
bining rule equation showed good agreement with experimental data for an aluminum
powder-polyester composite. Ondracek
18
derived a model for field properties of multiphase
materials which are at equilibrium and whose microstructure is homogeneous. A model struc-
ture is assumed to be similar to the real structure. Excellent agreement was obtained between
model predictions and experimental data when the matrix and particle conductivities were of
similar magnitudes. When the fiber conductivity was much greater than the matrix conductiv-
ity, the agreement was much worse. Another proposed model is the effective medium theory,
which replaces the inhomogeneous medium found in an actual composite with a homoge-
neous “effective” medium. For a conductive composite, the original lattice consisting of
randomly distributed conductances is replaced by a lattice of similar symmetry. The conduc-
tances are regularly placed so that the electrical properties are, on average, identical in each
case.
19
The model does not predict a percolation threshold and is insensitive to changes in the
fiber aspect ratio.
In general, predictions from the above models are only in agreement with experimental
data when the fiber and matrix conductivities are similar. The percolation theory is able to ac-
curately predict the percolation threshold in a conductive composite, but cannot predict the
actual conductivity of such a sample. In this paper, two models are proposed which predict the
electrical properties of conductive fiber composites using microstructural data. Background
information on each is provided, along with the relevant equations. Predictions from the mod-
els are compared to experimental data for nickel-coated graphite fiber-polypropylene
composites.
THEORETICAL
END-TO-END MODEL
Starting from basic principles, a relation between electrical conductivity and microstructural
parameters is derived for a sample consisting of connected “strings” of fibers in a polymer
matrix. The fibers are assumed to be connected end-to-end. The matrix conductivity is very
small, so the composite conductivity is determined by the fiber conductivity. For more infor-
mation regarding these derivations, refer to the thesis of Weber.
20
Figure 1 shows conductive fibers embedded in a polymeric matrix. The fibers have a
length l and a diameter d, and are aligned at an angle
θ
which describes their orientation rela-
62 Conductive Polymers and Plastics
tive to the test direction. They are contained
in a composite sample with an overall length
L, width W, and thickness T. Since the ma-
trix does not contribute to the conductivity
of the composite, the latter is determined by
the fiber contribution. When the fibers have
such an alignment, the sample size becomes
important. If the sample is too small or nar-
row, it is possible that no fibers will traverse
the test direction, and the composite conduc-
tivity will be zero. For the present
derivation, it is assumed that the sample is
always large enough so that it is conductive.
It should be emphasized that, in many com-
posite samples, the fibers will have a range
of orientations. Therefore, there will gener-
ally be a significant volume fraction of fibers
that contribute to the conductivity. Thus, the
composite conductivity in the x-direction,
σ
c long
, is proportional to the fiber conductivity,
σ
f
,
and is dependent on the number of conductive strings. By relating the number of strings of
conductive fibers to the volume fraction of fibers in the sample,
φ
, the following relationship
for the resistivity in the longitudinal direction can be obtained:
ρ
ρ
φθ
c long
f
=
cos
2
[1]
Using a similar derivation, the resistivity in the transverse direction can be calculated as:
ρ
ρ
φθ
c trans
f
=
sin
2
[2]
When the fibers are perfectly aligned parallel to the test direction,
θ
is zero, the longitudinal
resistivity becomes inversely proportional to the fiber volume fraction, and the resistivity in
the transverse direction (Equation 2) is zero. Similarly, when the fibers are perfectly aligned
parallel to the sample width,
θ
is 90
o
, and Equation 2 becomes 1/
φ
. These equations give the
lower bounds for resistivity in the longitudinal and transverse directions.
Estimation of the Volume Resistivity 63
Figure 1. Sample containing connected strings of fibers,
oriented at angle
θ
to the test direction.
FIBER CONTACT MODEL
Most of the existing resistivity models do not accurately predict the volume resistivity of a
composite because they do not account for particle-to-particle contact. It is usually assumed
in these models, as well as in the model described in the previous section, that the resistivity
of the connected string is equal to the resistivity of the fiber. However, this is an idealized case
and only gives a lower bound for the resistivity. The contacts between fibers are rarely
end-to-end; they are usually end-to-body or, most likely, body-to-body. The area of contact
for these situations is much smaller than in perfect end-to-end alignment, and thus will have
an effect on composite resistivity.
21,22
Therefore, a model which accounts for realistic con-
tacts is needed. Batchelor and O’Brien
23
have derived a model for the thermal or electrical
conduction through a granular material consisting of conducting particles in a matrix. The
conductivity of the particles is very high, and the ratio of particle to matrix conductivity is
much greater than one. The model derived in this paper applies the Batchelor and O’Brien
model, which was developed for thermal conductivity, to electrical conductivity and extends
its application to fiber-filled composites. Refer to the work of Weber
20
for further details re-
garding the mathematical derivation of the equations.
For composites, where the conductivity of the inclusion is large compared to that of the
matrix, essentially all of the current flows through the inclusions. The potential gradient
within a particle is very small, except near points of contact with other particles. In the vicin-
ity of these points, the magnitude of the current density and the gradient of potential are large
compared to values far from a contact point. Therefore, the conditions near the contact points
determine the total current through the particle. The following model assumes a small, flat
circle of contact between the fibers, and accounts for the percolation threshold. The resistivity
in the longitudinal and transverse directions are derived as:
ρ
πρ
φθ
c long
f
pc
dX
dl
=
2
2
4cos
[3]
ρ
πρ
φθ
c trans
f
pc
dX
dl
=
2
2
4sin
[4]
where: d = fiber diameter,
ρ
f
= volume resistivity of fiber, X = factor related to fiber contacts,
φ
p
= volume fraction of fibers participating in conductive strings, d
c
= diameter of circle of
contact, l = fiber length,
θ
= average angle of orientation
Equations 3 and 4 show the dependence of the resistivity on fiber length, orientation, and
volume fraction, as well as the area of contact. The predicted relationship between composite
64 Conductive Polymers and Plastics
volume resistivity and fiber orientation and volume fraction is identical to that found in the
simple model derived in the previous section. These equations represent a percolation type of
model, and include quantitative parameters which can account for the orientation, length, and
concentration of the fibers, as well as the nature of particle-particle contact.
RESULTS AND DISCUSSION
END-TO-END MODEL
The end-to-end model predicts that the
resistivity is dependent on test direction
and fiber orientation. Predictions from
the model are compared to experimental
data for nickel-coated graphite fi-
ber-reinforced polypropylene, processed
by compression molding, extrusion, and
injection molding.
20
The effect of sample
size is again omitted. For the compres-
sion molded and extruded samples, the
experimental data has shown that the re-
sistivity is independent of the size of the
samples. The injection molded speci-
mens are assumed to be large enough rel-
ative to the length of the fibers so that
sample size effects will be negligible.
The orientation of the fibers in the com-
posites is needed in the Equations and
was determined as follows. An average
orientation parameter is calculated using
the data from all the fibers in the sam-
ple.
20
From this, an average angle of orientation, is found. Therefore, the actual
microstructure in a sample is replaced by an “effective” microstructure. Each fiber in the sam-
ple is assumed to be connected end-to-end and has the same effective fiber orientation, length,
and diameter. The average fiber length is for the entire sample. Table 1 summarizes the effec-
tive microstructure in the composites.
The anisotropy of the composites can be determined by a ratio of transverse to longitudi-
nal resistivity. Figure 2 compares experimental data to model predictions for compression
molded, extruded, and injection molded samples. The model predictions are obtained by di-
viding Equation 2 by Equation 1, to give
Estimation of the Volume Resistivity 65
Figure 2. Comparison between aligned fiber model predictions of
sample anisotropy and experimentally determined anisotropy.
ρ
ρ
θ
c trans
c long
= cot
2
[5]
The ratio given by Equation 5 is independent of volume fraction. As seen in Figure 2, the
ratio of the experimental resistivities is also independent of fiber concentration. Agreement
between the predictions and experimental results is good for all processing methods. The sim-
ple model derived from basic principles predicts the general behavior of the conductive
composites and gives the correct relation between resistivity and fiber concentration and ori-
entation.
FIBER CONTACT MODEL
Volume resistivity predictions in the longitudinal and transverse directions are made using
Equations 3 and 4. The fibers in the composites are assumed to have a flat circle of contact.
Table 1 presents the values of the parameters used in the equations for the compression
molded, extruded, and injection molded nickel-coated graphite fiber composites.
20
For all
cases, the number of contacts, m, was assumed to vary from a minimum of 2 to a maximum of
15. The ratio of the contact diameter to the fiber diameter, d
c
/d, was held constant at4x10
-5
.
Figure 3 compares the experimental resistivity values and model predictions in the longitudi-
nal direction, while Figure 4 gives similar results in the transverse direction. The prediction of
the longitudinal and transverse resistivities by the fiber contact model are in agreement with
the experimental results. The difference between the predictions and experimental data is
very small in both the extruded and injection molded composites. The predictions for the
compression molded plaques are also similar to the experimental data, but disagree slightly
near the percolation threshold. The assumptions in the model are only valid above the critical
66 Conductive Polymers and Plastics
Table 1. Values of parameters used in fiber contact model
Sample
Fiber
length, mm
Fiber
diameter, mm
Angle of
orientation, q
f
c
b
Compression molded
Longitudinal alignment
Transverse alignment
394 7.6 45.2 0.01
0.01
25
25
Extruded
Longitudinal alignment
Transverse alignment
819 7.6 27.2 0.003
0.005
34
22
Injection molded
Longitudinal alignment
Transverse alignment
278 7.6 33.6 0.009
0.011
24
25
concentration, so the model predictions in this vicinity are expected to show the greatest devi-
ation. Using microstructural data in the model equations, along with the concepts of a perco-
lation threshold and fiber contact, produces excellent results.
CONCLUSIONS
The ability of existing theories to predict electrical properties of conductive fiber composites
has been shown to be lacking. Few models account for microstructural details, percolation
threshold, and fiber-fiber contacts. Two models which predict the resistivity of a composite
from microstructural data are presented. Starting from basic principles, the first model pre-
dicts the general behavior and anisotropy of the composite. Fiber orientation and concentra-
tion are accounted for. Due to the assumptions made, this model provides lower bounds for
the composite resistivity. To obtain more realistic predictions, the effect of fiber-fiber contact
must be considered. The second model accounts for these contacts, and includes the effect of
fiber length. Predictions from this model are in excellent agreement with experimental data.
Both models extend our understanding of the relationship between electrical properties and
microstructure of conductive composites.
Estimation of the Volume Resistivity 67
Figure 3. Comparison between fiber contact model
predictions and experimental data (longitudinal direction).
Figure 4. Comparison between fiber contact model predictions
and experimental data (transverse direction).
REFERENCES
1 D.M. Bigg, Adv. Polym. Technol., 4, 255 (1984).
2 T. Katsura, M.R. Kamal, and L.A. Utracki, Adv. Polym. Technol., 5, 193 (1985).
3 B.A. Luxon and M.A. Murthy, SPE ANTEC Tech. Papers, 32, 233 (1986).
4 L. Li and D.D.L. Chung, Composites, 25, 215 (1994).
5 G.E. Pike and C.H. Seager, Phys. Rev. B: Solid State, 10, 1421 (1974).
6 N. Ueda and M. Taya, J. Appl. Phys., 60, 459 (1986).
7 M.T. Kortschot and R.T. Woodhams, Polym. Compos., 9, 60 (1988).
8 I. Balberg and N. Binenbaum, Phys. Rev. B: Condens. Matter, 28, 3799 (1983).
9 E.A. Holm and M.J. Cima, J. Am. Ceram. Soc., 72, 303 (1989).
10 S.F. Wang and A.A. Ogale, Compos. Sci. Technol., 46, 93 (1993).
11 A. Dani and A.A. Ogale, SPE ANTEC Tech. Papers, 40, 1392 (1994).
12 F. Bueche, J. Appl. Phys., 43, 4837 (1972).
13 L.D’Ilario and A. Martinelli, J. Mater. Sci. Lett., 10, 1465 (1991).
14 L.E. Nielsen, Ind. Eng. Chem. Fundam., 13, 17 (1974).
15 D.M. Bigg, Polym. Eng. Sci., 17, 842 (1977).
16 M.A. Berger and R.L. McCullough, Compos. Sci. Technol., 22, 81 (1985).
17 R.L. McCullough, Compos. Sci. Technol., 22, 3 (1985).
18 G. Ondracek, Rev. Powder Metall. Phys. Ceram., 3, 1205 (1987).
19 R.D. Sherman, L.M. Middleman, and S.M. Jacobs, Polym. Eng. Sci., 23, 36 (1983).
20 M.Weber, Ph.D. Thesis, McGill University, Montreal, Quebec, Canada (1995).
21 C. Rajagopal and M. Satyam, J. Appl. Phys., 49, 5536 (1978).
22 B. Bridge, J. Mater. Sci. Lett., 7, 663 (1988).
23 G.K. Batchelor and R.W. O’Brien, Proc. R. Soc. London, Ser. A:, 355, 313 (1977).
68 Conductive Polymers and Plastics
Effect of Thermal Treatment on Electrical
Conductivity of Polypyrrole Film Cast from Solution
J.Y. Lee, D.Y. Kim, and C.Y. Kim
Polymer Materials Lab., Korea Institute of Science and Technology, Seoul, Korea
K.T. Song, S.Y. Kim
Dept. of Fiber and Polymer Science, Seoul National Univ., Seoul, Korea
INTRODUCTION
Polymers containing conjugated double bonds are very attractive since the materials show the
characteristics of a semiconductor and become electrically conductive on doping. The dis-
covery of electrically conductive polymers
1-4
generated excitement to show a great potential
in applications. Polypyrrole (PPy) is successfully used as a key material in an electrolytic ca-
pacitors.
5,6
Polyaniline has been tried as an electrode in a polymer battery
7
and as an electro-
magnetic interference shielding material in polyvinyl chloride.
8
Polyphenylenevinylene is
semiconductive and capable of emitting light.
9
Despite many attractive properties, electrically conductive polymers had a shortcomings
in processability since the materials were infusible or insoluble. Soluble polymers with con-
jugated double bonds have been developed by modification of the monomers but showed
poor electrical conductivities.
10,11
Polyaniline soluble in organic solvents has been finally de-
veloped to produce a film or sheet.
12-15
Soluble PPy is also introduced without sacrificing the
conductivity.
16,17
Electrical conductivity of the conducting polymer must be stable upon heating since the
polymer is used or processed at elevated temperatures in the most cases. The present work ex-
amined the effect of thermal treatment on electrical conductivity of the PPy film cast from the
solution in chloroform. Electrical conductivities of the films with various thickness were
monitored upon heating in air or nitrogen. UV-VIS-NIR spectroscopy was carried out to cor-
relate the electrical property with changes in the chemical structure of the polymer.
EXPERIMENTAL
Pyrrole (Aldrich) was dried with CaH
2
for 24 hours, followed by distillation under reduced
pressure. Ammonium persulfate (APS, Kanto Chemical Co. Inc.) as an oxidant and
dodecylbenzene sulfonic acid (DBSA, Janssen Chimica) as a dopant were used as received.
A typical polymerization process is as follows. 0.15 mol DBSA and 0.3 mol pyrrole
were dissolved in 500 ml distilled water with vigorous stirring. To the above solution of
which temperature was controlled with an accuracy of ±0.1
o
C, 0.03 mol APS in 100 ml of
distilled water was slowly added. Reaction was carried out for 24 hours at -2
o
C and then ter-
minated by pouring excess methanol. The resultant PPy powder was filtered and washed
sequentially with distilled water, methanol and acetone, followed by filtering and drying in a
vacuum oven at 25
o
C for 12 hours.
PPy powder obtained (1 g) was completely dissolved by ultrasonification in 25 ml of
chloroform with additional1gofDBSA, and filtered througha1µmTeflon membrane filter.
The solution was transferred onto a glass plate and the solvent was dried, resulting in an ex-
cellent quality of free-standing films with the thickness of 35 and 100 µm. A thin film with the
thickness of 4 µm was obtained by using the spin-casting technique. The film cast from the
chloroform solution was washed with acetone to leach out the extra DBSA. Intrinsic viscosity
of the PPy solution in chloroform was measured by using a Ubbelohde viscometer. Electrical
conductivity of the free-standing film was measured by the four-probe method for the bulk
conductivity and by the two-probe method for the surface resistivity.
A Perkin-Elmer System 2000 NIR FT-Raman spectrometer was used to investigate
the absorption characteristics of the resulting PPy in the NIR range. UV-VIS spectrum up to
820 nm was recorded by a Hewlett Packard HP 8452A diode array spectrometer. The two
spectra were combined at 800 nm, leading to UV-VIS-NIR spectrum from 300 nm to 3000
nm. TGA was carried out using a DuPont 2950 Thermogravimetric Analyzer under nitrogen
or air with the scan rate of 20
o
C/minute.
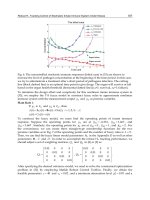
RESULTS AND DISCUSSION
Molecular weight of PPy is known to be dependent on the polymerization conditions such as
the concentration of the oxidant and the polymerization time. There seems to be the critical
molecular weight for a good electrical conductivity as shown in Figure 1. The conductivity
increases by three decades with an increase of the intrinsic viscosity from 0.072 to 0.094 dl/g.
A further increase in the viscosity raises the conductivity by less than one decade. The con-
ductivity of the pellet pressed from PPy powder generally increases with an increase of the
oxidant concentration. However, PPy formed chemically with a higher concentration of the
oxidant failed to be soluble.
70 Conductive Polymers and Plastics
Changes in electrical conductivity of a 100 µm thick PPy film upon isothermal heating at
different temperatures are shown in Figure 2. The conductivity jumps rapidly by up to one de-
cade in the beginning of the heating to the set temperature. The increase in the conductivity is
larger when the set temperature is higher. The polymer shows no decrease in the conductivity
during isothermal heating at up to 200
o
C for one hour. The conductivity of PPy slowly de-
creases when heated at 250
o
C.
It is interesting to note that the conductivity is improved when the polymer is cooled to
room temperature after heating and the higher the heating temperature the higher the conduc-
tivity unless the conductivity decreases during the heat treatment. Higher conductivity at
room temperature after heating than the original value indicates that there must be rearrange-
ment of the polymer molecules on heating to show an improvement in the conductivity.
18
It
would be improved stacking in molecules to enhance the planarity and the conductivity. The
shrinkage of the polymer on cooling to room temperature disturbs just a little the planarity im-
proved in the bulk on heating to decrease the conductivity but not completely. Heating the
polymer to 250
o
C probably causes chemical reaction in it to break the conjugation in the mol-
ecules. The polymer loses the conductivity by about three decades after being heated at 250
o
C
for one hour and then cooled to room temperature.
Effect of Thermal Treatment 71
Figure 1. Electrical conductivity of PPy film as a function of
intrinsic viscosity.
Figure 2. Electrical conductivity changes of 100
µ
m thick PPy
film cast from chloroform solution with heating time at various
heating temperatures.
It must be emphasized that the PPy film cast from the solution stands the heat treatment
at up to 200
o
C for 60 minutes without losing the conductivity. The material may be used in
polymer compounding processes as well as in electronic devices.
UV-VIS-NIR spectra of a PPy film with the thickness of 1 µm upon heating at 200
o
C for
different periods of time are shown in Figure 3. The absorption at 1560 nm is considered as
the electronic transition from the valence band to the bipolaron band
19
and the peak height
may be correlated with electrical conductivity. The absorbance at 1560 nm changes little with
the heating time of up to 15 minutes at 200
o
C. However, the absorbance decreases signifi-
cantly after heating the polymer for 30 minutes, while the change in electrical conductivity of
a 100 µm thick PPy film is not observed as shown in Figure 2.
Figure 4 shows the thicker a PPy film the more stable the conductivity on the thermal
treatment at 200
o
C. The 35 and 4 µm thick PPy films gain the conductivities on heating at
200
o
C as much as that of the 100 µm thick PPy film does in the beginning. However, the con-
ductivities of the thinner films decrease rather rapidly with time of the treatment while the
conductivity of 100 µm thick film decreases little with the treatment time. The conductivities
of the films always drop significantly when cooled to room temperature after heating and the
drop becomes larger with a thinner PPy film.
72 Conductive Polymers and Plastics
Figure 3. UV-VIS-NIR spectra of PPy film spin-cast from
chloroform solution upon thermal heating at 200
o
C for (a)
untreated, (b) 5, (c) 15, (d) 30 and (e) 60 minutes,
respectively.
Figure 4. Electrical conductivity changes of PPy film with
various thicknesses upon isothermal heating at 200
o
C.
The PPy film seems to be very sensitive to oxygen as shown in Figure 5. The 4 µm thick
PPy film gains the conductivity on the initial heating at 200
o
C in nitrogen atmosphere as
much as in air. The film heated at 200
o
C for 60 minutes in nitrogen shows higher conductivity
at room temperature than that of the untreated film, while the conductivity of the film heated
in air is lower than that of the untreated film by two decades. It is generally known that the
carbon at the position of 3 or 4 in the pyrrole ring is vulnerable to oxygen and the hydrogen on
the carbon is easily substituted by oxygen to cause the conjugation moiety to brake.
20-22
The mechanism of the oxygen substitution is proposed as shown in Figure 6. The hydro-
gen bound to the carbon at the position 3 is extracted on heating to leave a free radical on the
carbon. Oxygen is attached to the carbon with the free radical to make a peroxide group. Rear-
rangement of the peroxide group releasing an oxygen free radical leads to a carbonyl group.
The conjugation in the polymer is then broken to show a lower electrical conductivity.
Even though the conductivity of a 100 µm thick PPy film changes a little on heating at
200
o
C in either air or nitrogen, the surface resistivity of the PPy film changes significantly
when the film is treated in air at 200
o
C as shown in Figure 7. The surface resistivity drops
while heating to 200
o
C either in nitrogen or air, indicating an increase of the conductivity.
However, the resistivity increases faster on heating the specimen in air whereas the heating in
Effect of Thermal Treatment 73
Figure 5. Changes in surface resistivity of 4
µ
m thick PPy cast
film on heating at 200
o
C in (a) air, (b) nitrogen.
Figure 6. Chemical structural changes of PPy on heating in air.
nitrogen causes no effect on the surface resistivity. The conductive polymer is a basically sta-
ble material but reactive to oxygen at elevated temperature.
The NIR spectra in Figure 3 indicated that there were changes in the chemical structure
on heating the PPy film at 200
o
C. It is clear now that the thermal treatment in air damages the
PPy film and the damage diffuses into the bulk from the film surface, while nitrogen causes
no damage in the polymer on heating and the conductivity is preserved.
PPy doped with DBSA anion loses weight just a little until heated to 230
o
C while no
change in weight of DBSA is detected on heating to the same temperature as shown in Figure
8. Since no weight change of the doping acid is observed on heating to 200
o
C, the slight
weight loss in the polymer must be due to degradation of the polymer to release fragmented
molecular segments. The decrease in the conductivity on heating in air, therefore, should not
be correlated with decomposition of the dopant. The change in the conductivity on heating
must be directly related to the conjugation length in PPy due to oxidation.
74 Conductive Polymers and Plastics
Figure 7. Changes in surface resistivity of 100
µ
m thick PPy
cast film upon heating at 200
o
C in air and nitrogen.
Figure 8. TGA curves of PPy cast film (a) in nitrogen and (b) in
air and DBSA, (c) in air and (d) in nitrogen.
CONCLUSIONS
The concentration of the oxidant in polymerization controls molecular weight of PPy which
has to exceed a critical point to show metal-like electrical conductivity. Heating the PPy film
cast from the solution raises electrical conductivity and the higher the temperature up to
200
o
C the better the conductivity. The conductivity changes little with the heating time of 60
minutes at the isothermal temperature of up to 200
o
C. Thermal treatment of the polymer at
250
o
C raises the conductivity even higher at the early stage but lowers the conductivity grad-
ually to that at 200
o
C in 60 minutes. Cooling the specimens to room temperature lowers the
conductivity but still higher than the original one except the specimen treated at 250
o
C. The
heating effect on the decrease of the conductivity is only observed when the polymer is heated
in air and no change in the conductivity is observed when treated in nitrogen. The dopant is
found to be very stable on heating to 200
o
C and shows no effect on the decrease in the conduc-
tivity on heating. It is proposed that the carbon at the position 3 in the pyrrole ring is vulnera-
ble to oxygen and the attack by oxygen disturbs the conjugation in the polymer. The rate of
the conductivity decrease seems to be controlled by diffusion of oxygen into the polymer.
REFERENCES
1 A.G. MacDiarmid, C.K. Chiang, C.R. Findher Jr., Y.W. Park, A.J. Heeger, H. Shirakawa, E.J. Louis, and S.C. Gau, Phys.
Rev. Lett., 39, 1098(1997).
2 K. Kanazawa, A.F. Diaz, R.H. Geiss, W.D. Gill, J.F. Kwak, J.A. Logan, J.F. Robolt, and G.B. Steet, J. Chem. Soc., Chem.
Commun., 1979, 854(1979).
3 G. Tourillon and F. Ganier, J. Electroanal. Chem. Interfacial Electrochem., 135(1), 173(1982).
4 A.G. MacDiarmid, J.C. Chiang, A.F. Richter, and A.J. Epstein, Synth. Met., 18, 285(1987).
5 Y. Kudoh, S. Tsuchiya, T. Kojima, M. Fukuyama, and S. Yoshimura, Synth. Met., 41, 1133(1991).
6 L.G.M. Krings, E.E. Havinga, and J.J.T.M. Donkers, Synth. Met., 54, 453(1993).
7 T. Fuse, Electronics, 1987, 38(1987).
8 Incoblend Product Information Sheet (Zipperling-Kessler, Germany and Americhem, USA).
9 J.H. Burroughes and R.H. Friend, Proc. of Mat., Res. Soc., Symp., 173, 425(1990).
10 H. Masuda, S. Tanaka, and K. Kaeriyama, J. Chem. Soc., Chem. Commun., 11, 725(1989).
11 P. Audebert, P. Aldebert, N. Girault, and T.Kaneko, Synth. Met., 53, 251(1993).
12 M. Angelpoulos, A. Ray, A.G. MacDiarmid, and A.J. Epstein, Synth. Met., 21, 21(1987).
13 A. G. MacDiarmid and A.J. Epstein, Science and Applications of Conducting Polymers, edited by D.T. Clarke and
E.J. Samuelson, IOP Publishing Ltd., Bristol, 1990, pp. 117.
14 Y. Cao, G.M. Treacy, P. Smith, and A.J. Heeger, Appl. Phys. Lett., 60, 271(1992).
15 A.G. MacDiarmid and A.J. Epstein, Synth. Met., 65, 103(1994).
16 J.Y. Lee, D.Y. Kim, and C.Y. Kim, Synth. Met., 74, 103(1995).
17 J.Y. Lee, D.Y. Kim, K.T. Song, S.Y. Kim, and C.Y. Kim, Mol. Cryst. Liq. Cryst., accepted.
18 Y. Wang and M.F. Rubner, Synth. Met., 41, 1103(1991).
19 G.B. Street, Handbook of Conducting Polymers, Vol. 1., edited by T.A.Skotheim, Marcel Dekker, New York, Chap. 8,
1986, pp. 284.
20 L.A. Samuelson and M.A. Druy, Macromolecules, 19, 824(1986).
21 W. Liang, J. Lei, and C.R. Martin, Synth. Met., 52, 227(1992).
22 H.H. Kuhn, A.D. Child, and W.C. Kimbrell, Synth., Met., 71, 2139(1995).
Effect of Thermal Treatment 75
Creation of Electrically Conducting Plastics by
Chaotic Mixing
Radu I. Danescu and David A. Zumbrunnen
Laboratory for Materials Processing and Industrial Mixing, Department of Mechanical
Engineering, Clemson University, Clemson, SC, USA
INTRODUCTION
Electrically conducting plastics are commonly made by adding conductive fillers such as me-
tallic powders or carbon black. When particulate additives are mechanically mixed with mol-
ten polymers, particle chains may arise by chance as a result of the random positions of
individual particles. Such chains, or networks, provide conducting pathways. High shear rate
flows, which characterize ordinary compounding methods, such as extrusion or batch mix-
ing, lead to random and nearly uniform particle distributions. The likelihood for extended
conducting pathways to form is accordingly low at small particle concentrations. If the parti-
cle concentration is higher than a certain value called the percolation threshold,
1
these associ-
ations among particles yield a network that spans the material and the solidified composite
becomes electrically conductive.
Means to reduce the percolation threshold are of significant practical importance, as the
addition of particles can degrade the desirable properties of plastic materials, introduce pro-
cessing complexities, and fillers are in general costly. Creating a structured filler distribution
is an effective way to reduce the percolation threshold since the particle density in some re-
gions is higher than average. Structured distributions can be created by adding a conductive
filler, such as carbon black, to a two-phase polymer blend where the filler becomes concen-
trated selectively in one phase or at interfaces.
2
Results were reported regarding
polyethylene/polystyrene blends filled with carbon black.
3
A percolation threshold of 1.5
wt% was found where particles became concentrated in one phase and of only 0.5 wt% where
the particles accumulated at interfaces. The processing conditions in the latter case are how-
ever very restrictive. Where particles concentrate in one phase, the conductivity depends
appreciably on the blend morphology.
It has been shown that nearby fluid elements can be made to follow unique trajectories
within cavities where fluid motion is laminar and induced solely by the simple, slow, periodic
motion of bounding surfaces.
4
Deformable minor phase bodies become repeatedly stretched
and folded and exhibit within physical space responses characteristic of chaotic behavior. For
this reason, the collective motion of fluid elements in such conditions is generally referred to
as chaotic mixing. Fibrous and lamellar microstructures of less than 1 micron diameter or
thickness have been formed in this manner within polymer melts beginning with large minor
phase bodies of about 4 mm diameter.
5,6
The microstructures have been associated with en-
hanced physical properties due to internal interconnections and morphological
complexities.
7-9
Chaotic advection has been widely studied in an eccentric cylindrical cavity
formed between two offset rotating cylinders.
10
Theoretical and experimental results are
available regarding the processing conditions under which advection is chaotic.
11,12
This paper reports results of an experimental investigation aimed to create electrically
conductive polymer composites at low filler concentrations by chaotic mixing. Conductive
carbon black was added to a polystyrene melt contained in an eccentric cylinder cavity and
very fine-scale structures were created which were captured by rapid solidification. Micro-
graphs of the composite structures and the electrical measurements are presented.
EXPERIMENTAL PROCEDURES
Conducting networks were formed by progressively stretching and folding by chaotic mixing
initial minor phase bodies that were much larger than the ultimate characteristic dimension in
the composites. These initial minor phase bodies were produced by blending in a batch mixer
Rheomix 600 (Haake Inc., Saddle Brook, NJ) atactic polystyrene (Novacor Chemical, Inc.)
and carbon black Printex XE-2 (Degussa Corporation, Akron, OH). This carbon black is
characterized by a high porosity and a highly extended, bulky nature of aggregates, with con-
siderable branching and chaining.
13
The carbon black content was 6 wt%, which was more
than twice the percolation threshold for electrical conductivity (i.e., 2.8 wt%) for this carbon
black in polystyrene.
14
After blending, the material was pelletized in a grinder, and pellets
varying in size from 1 to 1.4 mm were retained using a series of standard sieves of decreasing
hole size. In parallel, pure polystyrene, which was originally in a 2.5x4mmgranular form,
was also ground. Pellets of 1 to 1.4 mm size were sorted using the same procedure. Filler-rich
and filler-free pellets were combined at the desired overall carbon black content by shaking
known masses of each in a plastic bag. Batches with a carbon black loading C varying from
0.4 to 2.5 wt% were produced. In this manner, normal mixing was relied upon to achieve
compositional uniformity and chaotic mixing was used to develop structure in situ.
Two-dimensional chaotic mixing was achieved using an apparatus recently developed in
conjunction with a prior study
15
and modified for the purposes of the present work. A 130 mm
78 Conductive Polymers and Plastics