High Temperature Strain of Metals and Alloys Part 2 pptx
Bạn đang xem bản rút gọn của tài liệu. Xem và tải ngay bản đầy đủ của tài liệu tại đây (180.68 KB, 15 trang )
10
1 Macroscopic Characteristics of Strain of Metallic Materials at High Temperatures
6. The various directions of research are somewhat separated from each
other.
7. The physical nature of the creep deformation behavior of industrial superalloys has not been investigated sufficiently. Quantitative physical theories
are still being worked out.
I consider that the essence of the problem of the physical fundamentals of
high-temperature strain consists in structural evolution under specific external conditions. My approach to the problem is based on the concept that the
effect of applied stresses upon the crystal lattice at high temperatures results
in distinctive structural changes and these specific changes lead to the definite macroscopic behavior of a material, especially, to the strain rate and to
the stress resistance.
A key to the problem is the response of the structural elements of a material.
In some way the situation is in accordance with the Le Chatelier rule. The
changes in a metallic system which take place under the influence of external
conditions are directed so as to relax this influence. The formation of an
ordered dislocation structure is just an evolution process which tries to act
against applied stresses. The point is that the high temperature conditions
give the possibility of supplying the dislocation rearrangement with energy
and which results in the substructure formation.
That is why our aim is first to investigate quantitatively and in detail the
interaction of dislocations with each other, the formation of subgrains, the
interactions between dislocations and particles in superalloys, and only then
to conclude a physical mechanism for the process.
The nature of microscopic processes should be revealed as a result of experiments that enable one to observe the events on the atomic, microscopic
scale, and not on the basis of the general properties of crystal lattice defects
nor on the basis of mechanical tests.
This approach enables us to find unequivocal and explicit expressions for
the high-temperature steady-state strain rate. These expressions contain substructural characteristics, physical material constants and external conditions.
The essence of this approach is defined as the physics of the processes, which
are the structural background and the kinetic basis of the macroscopic deformation of metals and solid solutions in the interval (0.40–0.70) Tm , where Tm
is the absolute melting temperature. Superalloys operate at higher temperatures.
Thus, the planned path can be shown schematically as follows. Systematic
investigations of the structure of metals strained at high-temperature. ⇒ The
determination of the physical mechanism of strain, which should be based
upon experimental data. ⇒ Calculation of the macroscopic strain rate on the
basis of this mechanism. ⇒ Comparison with experiment.
11
This plan demands first an efficient structural investigation and detailed
proofs of correctness of physical models.
An in situ investigation of metals is necessary in order to address the problem of the physics of the high-temperature deformation.
13
2
The Experimental Equipment and the in situ X-ray Investigation
Technique
2.1
Experimental Installation
The experimental installation for direct measurements of substructural changes
in the massive metallic specimens during deformation at high temperatures
must meet the following requirements.
1. The sensors used to measure stress and elongation of the specimen must
be compact because of the relatively small distance between the axis and the
slits of an X-ray goniometer (for example, a typical distance may be 65 mm).
2. It is advantageous to mount a loading mechanism on the frame of the
chamber in order to provide rotation of the specimen around the axis of
the goniometer during its exposure to X-rays. The mechanism must be able
to create a load of the order of thousands of Newtons while preserving the
vacuum.
3. The windows in the chamber should be arranged in such a way that they
are transparent to X-rays. Recording of the scattered irradiation must be provided in the interval of the Bragg angles that is important for measurements.
Figure 2.1 shows a set-up of an experimental installation designed according to these requirements [13]. A specimen 1 is fastened in holders 2 and 3.
A double-shovel shaped specimen with gauge diameter 1.5 to 3.0 mm and
gauge length up to 20 mm is used. The lower holder 3 is fastened rigidly to the
frame of the chamber. The upper holder 2 can move along the axis direction.
Movement of the upper holder is achieved with an electric motor, a reducer
and a worm-and-worm gear 5. The gear rotates on the external thread of a
hollow rod 6. The speed of the holder 2 may be continuously adjusted with
the electric motor. One may also use different reducer gears. The speed may
be varied from 5 × 10⁻⁷ to 3 × 10⁻³ s−1 . Silphon 7 enables one to move the
rod relative to the chamber while preserving the vacuum.
Due to the motion of the rod 6 it is possible to apply a load of up to 2000N to
the specimen. A special dynamometer 8–12 is used to measure the stress. It
High Temperature Strain of Metals and Alloys, Valim Levitin (Author)
Copyright c 2006 WILEY-VCH Verlag GmbH & Co. KGaA, Weinheim
ISBN: 3-527-313389-9
14
2 In situ X-ray Investigation Technique
consists of a frame 8 and an electronic valve 9 (a so-called diode mechanotron).
Deformation of the frame because of stress is transmitted through the screw
10 to the stem of the valve. The elongation of the specimen is measured with
a clock indicator 14 with an accuracy of 0.01 mm.
The chamber 18 and covers 17 have special windows 19 made of beryllium.
The initial beam enters and the scattered irradiation leaves through this window. The location and the size of the window enables one to measure angles
of 2θ in the interval from 50◦ to 165◦ . The Wilson packing 24 enables one to
rotate the chamber around the goniometer axis during X-ray irradiation. The
second cover has a window made of glass in order to measure the temperature
of the specimen with an optical pyrometer. The temperature can also be measured with a thermocouple fastened to the specimen. The chamber 18 and
covers 17 are cooled with flowing water. Adjustment of the chamber relative
to the initial X-ray beam is provided by sledges 22, 23 in two perpendicular
directions.
The specimen 1 is heated by electrode 16 by passing an alternating current. The electrode is cooled with flowing water. The specified temperature is
maintained with an electric circuit with an accuracy of 5K.
A mechanical pump and sorption pump ensure, through the hollow rod 6,
a vacuum level in the chamber of less than 1.33 × 10⁻⁴ Pa (1 × 10⁻⁶ torr).
Fig. 2.1 The experimental installation for
the X-ray structural investigations of metallic
specimens during high-temperature tests.
2.2 Measurement Procedure
2.2
Measurement Procedure
Polycrystal specimens of metals and alloys are investigated. A method for
measuring the irradiation intensity which is diffracted with separate crystals
has been worked out. Dependence of the X-ray intensity upon the double
Bragg angle, I(2θ), is recorded.
The measurement procedure is as follows: the specimen is placed between
holders in the chamber. The thermocouple is fastened to the operating point
of the specimen. The specimen is then adjusted relative to the initial beam;
the vacuum is established in the chamber and the heating is turned on.
First it is necessary to choose a number of crystals to be monitored and
to determine the exact coordinates of their reflections. There are three angle
values that enable one to define a reflecting position of a crystal: the rotation of
the specimen with the chamber around the goniometer axis (angle ω) and the
rotation of the detector of the scattered X-rays in the meridianal plane (angle
ψ). These two rotations make possible the selection of reflecting crystals when
the detector is installed in advance in the horizontal plane at the double Bragg
angle 2θ relative to the initial X-ray beam. It is possible to obtain the maximum
of intensity as a control point by means of thorough adjustment of all three
angles.
The monochromatic irradiation Kβ of an X-ray tube is used. X-ray irradiation is performed before loading the specimen, then straight after loading
and subsequently at the regular intervals. Recording of a diffraction curve
usually takes from 5 to 10 min and is repeated three times.
In Fig. 2.2 the formation of diffracted radiation is presented. Sections of the
Evald sphere are shown. A projection of the reflecting plane is seen as a short
line segment at the center of Fig. 2.2(c). A node of a so-called reciprocal lattice
is in a reflected position, i.e. on the surface of the Evald sphere. Three angles
conform to this position: angle ω of the crystal rotation and the two angles, 2θ
and ψ, of the detector motion. Angles ω and 2θ are measured in the equatorial
(horizontal) plane of the goniometer and angle ψ in the meridianal (vertical)
plane. The diffracted beam is recorded permanently with a fixed scintillation
detector with a rectangular split.
The dimensions of the node in the reciprocal lattice are known to be dependent upon the misorientation angle δ of subgrains (cells) in the metal
under examination, the divergence χ of the initial X-ray beam, the interval
between wavelengths and the crystal dimensions. The divergence results in
the appearance of a stroke χ, which is formed by the ends of the diffracted
beam vectors. This stroke is directed to the reciprocal crystal lattice vector H
at an angle θ.
15
16
2 In situ X-ray Investigation Technique
Fig. 2.2 Formation of the diffracted
beam for the method of investigation:
(a) the Evald sphere; s0 and s are unit
vectors of the initial and of the diffracted
beams, respectively; H is the reciprocal
lattice vector; EP, MP are equatorial and
meridianal planes, respectively. (b) The
reflection strip (shaded) at the intersection of a node of the reciprocal lattice and
the Evald sphere. (c) Directions of erosion
of the reciprocal lattice node due to the
divergence of the initial beam χ and to
the finite size, l, of the studied crystal.
The experimental technique that has been worked out by us enables one to
study structural changes in the same crystallites of the polycrystalline specimens during high-temperature deformation. For this purpose the angular
dependence of the diffracted intensity, I(2θ), is measured.
The most typical range of conditions was chosen: temperatures in the interval from 0.40 Tm to 0.80 Tm , stresses between 104 à and 2 ì 103 à, where
Tm is the melting temperature and µ is the shear modulus.
2.3 Measurements of Structural Parameters
2.3
Measurements of Structural Parameters
It was revealed that the high-temperature deformation does not result in a
broadening of the X-ray reflections. Therefore dynamic effects were used to
obtain data about the material structure. The multiple wave reflections from
parallel crystalline planes of the same crystal lead to a reduction in the wave
energy. This phenomenon is called primary extinction. The X-ray intensity
loss depends upon the number of reflecting planes, i.e. upon the subgrain
size. Measurements of a relation between irradiated and initial intensities
make it possible to determine the dimensions of the reflecting crystal.
According to the classical theory of Darvin [14] the decrease in intensity
factors of irradiation due to primary extinction is given by
f=
tanh(nq)
nq
(2.1)
where n is the number of the parallel reflecting planes in the crystal, q is the
so-called reflection power of the crystal plane.
q=
e2
N |F |λ csc θ
mc2
(2.2)
where e is the charge of an electron, m is the mass of an electron, c is the
velocity of light, N is the number of elementary cells in the unit of irradiated
volume, F is the structural amplitude and θ is the Bragg angle.
The size of a subgrain is equal to
D = nd
(2.3)
where d is the interplane spacing in the crystal lattice.
A screening effect is also observed. Internal subgrains are screened with
subgrains which are situated in external layers of the material. This phenomenon is called secondary extinction. Secondary extinction results in an
increase in the absorption coefficient, µ. The increment of X-ray absorption
is equal to gQ, where
1
g= √
(2.4)
2 πη
Q=
e2
mc2
2
λ3
1 + cos2 2θ
|F |2
a6
2 sin 2θ
(2.5)
where η is the mean angle of misorientation of neighboring subgrains, Q
is the reflectivity of the crystal, λ is the wavelength, a is the crystal lattice
17
18
2 In situ X-ray Investigation Technique
parameter. Measurements of subgrain dimensions should be performed in
conditions where secondary extinction does not play a considerable part. Thus,
we can write the following conditions:
f < 1; gQ
µ
(2.6)
Q
Lλ3
(2.7)
Assume that gQ = 0.1µ. It follows that
nq = 2Dd
where L is the angle coefficient, which appears in Eq. (2.5).
Inequalities (2.6) are satisfied when nq > 0.59.
Therefore the following inequality must also be satisfied:
Dd
µη
> 0.495
Lλ3
(2.8)
Consequently, interferences with a large interplane spacing d should be
chosen for measurements of subgrain sizes. For example, the minimum
values of D to be measured are equal to 0.29, 0.34, 0.13µm for Ni, Fe, W,
respectively.
We have used the following method to calculate the values of substructure
parameters. The full power of a diffracted X-ray beam, which is scattered by
a crystal, is expressed as
I = I0
1
f QV
2(µ + gf Q)
(2.9)
where I0 is the power of the initial beam, V is the crystal volume, the other
variables have been described above.
Denote the intensity (power) of a beam diffracted by a crystal in the initial
strainless state by Iin , after high-temperature deformation by IT , after strong
deformation at room-temperature by Id . It follows from the general formula
(2.9) that
1
(2.10)
Iin = I0
fin QV
2(µ + gin fin Q)
Strong “cold” deformation of a specimen results in an increase in the density of dislocations and other crystal lattice defects. Under these conditions
both types of extinction are suppressed, and fd = 1; gd fd Qd
µ. Thus Id
can be expressed as
QV
(2.11)
Id = I0
2µ
2.3 Measurements of Structural Parameters
We have
IT = I0
1
fT QV
2(µ + gT fT Q)
(2.12)
We may neglect the difference between values Qin and QT because the
increase in temperature influences Q and the fraction in Eq. (2.9) in opposite
directions.
Measurements of Iin and Id as well as Iin and IT are performed for the
same crystallite. Therefore taking the ratios in pairs we obtain the following
equations for calculation:
Iin
fin µ
(2.13)
=
Id
µ + gin fin Q
Iin
fin (µ + gT fT Q)
=
IT
fT (µ + gin fin Q)
(2.14)
The order of calculation is as follows. First values of gin , gT are calculated.
In order to be able to compute gin , gT from Eq. (2.4) one needs the values of
the angles η. These have to be found from independent measurements. Then
Eq. (2.13) is used to calculate fin . Next one calculates fT from Eq. (2.14) and
finally calculates the subgrain sizes D from Eqs. (2.1) and (2.3). This method
of measurement gives a relative accuracy of 5–7%.
In Fig. 2.3 the distribution curves for misorientation angles δ in the subgrain are presented. These data were obtained by rotating the specimen
around the axis of the goniometer while the detector was motionless. It goes
without saying that monochromatic irradiation was used.
Fig. 2.3 Distribution of angle misorientations of subgrains
in nickel. Symbols correspond to the Gaussian distribution.
Solid curves are the experimental dependences. Test
temperature 1073K. 1, stress 20MPa; 2, stress 14MPa.
19
20
2 In situ X-ray Investigation Technique
This distribution was found to be a Gaussian distribution as was verified
by means of a the so-called Kolmogorov test. In Fig. 2.3 the theoretical dependence is marked with symbols.
From the fact that the distribution of misorientations conforms with the
Gaussian law one may calculate the mean angle between adjacent subgrains:
η = 0.35δ
(2.15)
The density of dislocations within subgrain walls may be estimated as [15]
ρs =
η
bD
(2.16)
2.4
Diffraction Electron Microscopy
High-resolution transmission electron microscopy (TEM) enables the direct
observation of metal structure and therefore has an advantage over other
methods.
There are some typical difficulties one faces when using TEM: the field
of view is relatively small; the specimen must be thin enough, of the order
of 100 nm, so that it is transparent to the electron beam; it is possible to
deform thin foils during preparation. It is appropriate to apply both the X-ray
method and TEM so that they complement each other and this combination
is particularly valuable for studying high-temperature strain.
Electron waves are scattered by the thin crystal specimen. The electron
intensity distribution in the specimen brings about a variable brightness on
the screen of the microscope. The direct beam generates a so-called lightfield image. Deflection of the diffracted beams from the optical axis of the
microscope is about 20 mrad. Diffracted beams are usually absorbed with an
aperture.
Crystal lattice defects cause displacements of atoms from their equilibrium positions. These distorted areas scatter electron waves differently, and
a diffraction contrast can be seen on the screen of the instrument. Diffracted
beams also form images. To study them one has to decline the illuminating
system of the microscope in order to shift the image to the center of the screen,
where result dark-field images are formed. Thus a diffraction contrast from
defects is observed if the aperture passes either the direct or the diffracted
electron beam.
Atomic displacements, which are parallel to a reflecting crystal plane do
not contribute to the diffraction contrast but perpendicular displacements of
atoms lead to a contrast image.
2.5 Amplitude of Atomic Vibrations
Dislocations as line defects of the crystal lattice cause regular, ordered displacements of atoms from their equilibrium positions. The equality
(g · b) = 0
(2.17)
is the condition for disappearance of the contrast. Here g is the vector that is
perpendicular to the reflecting plane (vector of the reciprocal lattice); b is the
Burgers vector (i.e. vector of atomic displacements). The dislocation becomes
visible if this scalar product differs from zero: (g · b) = 0.
Equation (2.17) is used to determine the Burgers vectors. Modern electron
microscopes are supplied with a goniometric holder, which enables one to
incline and to rotate the foil in order to change diffraction conditions. The
chosen dark-field image can be placed in the center of the screen and studied
as well. (g · b) analysis as a method of determination of Burgers vectors is
described in detail in, for example, [16].
In our work discs were cut from the tested specimens for transmission
electron microscope analysis. A special machine was used to cut off thin
plates from the specimens. An artificial filament is applied as a working
element. The moving filament carries a chemical agent. Afterwards the plates
of 0.1–0.4 mm thick were electropolished; naturally, the composition of the
electrolyte depends on the material of the specimen.
Thin foils were examined in an electron microscope operating at 200keV.
Light-field- and dark-field pictures in 3 or 4 reflections of the diffracted beams
were examined. The dislocation structures observed in the micrographs were
analyzed with respect to the Burgers vector b. The images were also used to
determine the associated slip planes of the dislocations.
The dislocation density, N , in the specimens was measured after the interrupted high-temperature tests by means of the intercept method. The number of intersections of dislocations in a foil with a square grid was calculated.
From 10 to 15 pictures of total area 200µm2 , of each specimen were used for
computation. This method of measurement has an accuracy within 15–25%.
2.5
Amplitude of Atomic Vibrations
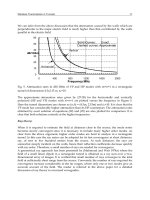
Atom and ions, which are bonded with each other by considerable interatomic forces, are not motionless; due to the constant vibrations, they permanently deviate from their equilibrium positions. A typical order of the
atomic vibration amplitudes is 10−11 m and that of the frequency 1013 Hz.
The amplitude–frequency characteristics of the vibrating spectrum strongly
influence, in particular, the heat-resistance of metals and alloys. This fact is
21
22
2 In situ X-ray Investigation Technique
explained as being due to a relation between atomic amplitudes and diffusion
parameters. The smaller the amplitudes of the atomic oscillations the smaller
is the diffusion mobility of the atoms and the greater the resistance to applied
stresses. Therefore measurements of amplitudes of atomic oscillations are of
great interest.
The wavelength of electromagnetic radiation in the X-ray range is of the
same order as the interatomic distances in solids. When a crystal is irradiated,
the X-rays excite the electrons in the atomic shells. They are forced to vibrate
with a frequency equal to that of the electric field intensity vector of the initial
electromagnetic wave. The reflected beams interfere with each other and the
resulting electromagnetic vibration propagates in certain selective directions.
The result of the interference depends on the distance between the atoms.
The heat vibration motion of atoms has a great influence on the interference
pattern.
The intensity of the scattering of the X-rays by a group of atoms subjected
to independent heat vibrations is weakened by the factor exp(−2M ), where
−2M = −
16 2 2 sin2 θ
π u
3
λ2
(2.18)
In Eq. (2.18) θ is the Bragg angle, λ is the wavelength, u2 is the mean-square
atom amplitude. The vibrating displacements of atoms from equilibrium positions occur in different directions. The arithmetic mean of the atomic displacements is equal to zero, because all directions of displacements of atoms
from the equilibrium positions in the crystal lattice are equiprobable. By introducing the mean-square atom amplitude u2 one can eliminate negative
values of displacements. Displacements are directed along perpendicular to
the reflecting crystal plane.
The mean-square amplitude is measured as follows. A specimen of a metal
or an alloy is studied at a range of high temperatures as well as at room
temperature. From formulas for the intensities of scattered X-rays at two
temperatures one can obtain an expression for the intensity ratio
ln
I
16
sin2 θ
= − π 2 (u2 − u2 ) 2
I
3
λ
(2.19)
where the primed quantities refer to a high temperature and those without primes refer to room temperature. Thus, for calculation of the vibration
amplitudes in conformity to Eq. (2.19) one should measure the ratio of intensities at two temperatures. The method allows one to determine the difference
∆u2 = u2 − u2 in the mean-square displacements of atoms at two temperatures.
2.6 Materials under Investigation
The amplitude of atomic vibrations increases with increasing temperature.
For instance, in iron at 673K u2 = 21.0 pm. At T = 873K the amplitude
increases to 28.1pm.
The experimental technique of the X-ray measurement of amplitudes is
described by the present author elsewhere [17].
2.6
Materials under Investigation
The materials under investigation were pure metals, binary substitutional
solid solutions and superalloys. Metals with face-centered and body-centered
crystal lattices were examined: nickel, copper, iron, vanadium, niobium and
molybdenum. Nickel and iron are two of the most important materials for
practical use and are applied as the base for numerous alloys for high-temperature operation. Vacuum-melted materials of 99.99% purity were used.
Binary nickel-based alloys contained about 10at.% of the second component: chromium, aluminum, tungsten or cobalt.
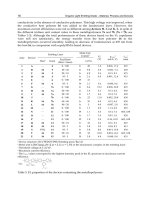
The compositions of the superalloys studied are presented in Table 2.1.
They were melted in industrial vacuum furnaces. The specimens for hightemperature tests were prepared from hot-rolled rods. A standard heat-treatment of every superalloy included the solution treatment and one-step or
two-step ageing followed by air cooling.
The amount of the hardening phase and the creep strength increase in
the sequence EI437B → EI698 → EP199 → EI867. Intermetallic compounds
Ni3 Al and Ni3 (Al,W) were vacuum-melted in a laboratory furnace.
Refractory metals (niobium and molybdenum) were produced in industrial arc-heating and electron-beam furnaces. Refractory materials were of
commercial purity.
Tab. 2.1 Chemical composition (wt.%) of superalloys under investigation.
Alloy
Ni3 Al
Ni3 (Al,W)
EI437B
EI698
EI867
EP199
C
Cr
Al
Ti
W
Mo
Co
B
Nb
Ni
–
–
0.06
0.08
0.02
0.05
–
–
20.1
14.0
9.5
19.8
12.64
9.29
0.70
1.65
4.47
2.14
–
–
2.52
2.70
–
1.42
–
9.90
–
–
5.26
9.10
–
–
–
2.99
9.82
4.54
–
–
–
–
5.12
–
–
–
0.006
0.003
0.020
0.008
–
–
–
2.04
–
–
87.36
80.81
rest
rest
rest
rest
23
24
2 In situ X-ray Investigation Technique
2.7
Summary
An experimental installation has been developed for in situ X-ray investigations of metals and alloys directly during high-temperature deformation. The
method of measurement of the irradiation intensities, which are diffracted
by separate crystallites of the investigated material, has been worked out.
Dynamic effects are used to obtain data concerning the material structure.
The sizes of subgrains and the angles of subgrain misorientations have been
measured.
The structural peculiarities of the high-temperature strained metals have
also been studied by transmission electron microscopy. A combination of
these two methods sheds light on the physical microscopic processes that are
the basis of the macroscopic strain behavior.
The values of the mean-square amplitudes of atomic vibrations have been
determined by the X-ray method at high temperatures.
Pure metals, solid solutions and nickel-based superalloys have been studied.
25
3
Structural Parameters in High-Temperature Deformed Metals
3.1
Evolution of Structural Parameters
In situ X-ray studies allow conclusions to be drawn concerning the effect of
stresses at high temperatures on the evolution of structure in metals. The
diffractometer curves change in shape after a stress is applied to a specimen.
As a rule, the integral intensity of reflections grows and the angle width of
the curve base increases appreciably, Figs. 3.1 and 3.2. The increase in the
diffracted irradiation energy indicates that the reflecting structural elements
become smaller.
In Fig. 3.3 the lower curve, ε(t), is typical for the creep of nickel specimens.
The primary and steady-state stages of deformation are seen. Variations in
Fig. 3.1 Change in the X-ray (111) reflection during high-
temperature strain. Copper tested at 610K under stress
14.7MPa. (a) Before loading, (b) the end of the primary
stage, the integral intensity has increased.
High Temperature Strain of Metals and Alloys, Valim Levitin (Author)
Copyright c 2006 WILEY-VCH Verlag GmbH & Co. KGaA, Weinheim
ISBN: 3-527-313389-9