Optoelectronics Materials and Techniques Part 2 pptx
Bạn đang xem bản rút gọn của tài liệu. Xem và tải ngay bản đầy đủ của tài liệu tại đây (3.12 MB, 30 trang )
Optoelectronics - Materials and Techniques
20
that the RDF practically does not depend on the amount of hydrogen in the sample.
Furthermore, all the calculated RDF agree reasonably well with the most recent and accurate
RDF measurement for a-Si with no hydrogen. This reflects the fact that the most probable
distance between neighboring atoms is equal to a sum of the atoms’ covalent radii. Even
when hydrogen passivates the dangling bonds, this does not modify the Si–Si bond length.
On the other hand, atomic vibrations do depend on microscopic bonding (bonds), their
angular distribution, distortion or breaking. In fact, the experimental measurements
demonstrate a variety of spectral features that obviously require microscopic theoretical
interpretation.
Furthermore, in order to further verify the validity of the model, the authors have also
studied the special case of metastable Si-H-Si bonds, observed experimentally by Darwich
et
al
. (1995), and have confirmed Darwich’s claim within experimental error. Gaspari et al.
(2009) indicate that the decrease in the vibrational frequency with respect to that of a stable
mono-hydride bond is due to the sharing of the hydrogen electron density between two Si
atoms. This decreases the Si–H bond strength, increases the bond length and results in
reduction of the vibrational frequency. Therefore, the band in the 1500-1800 cm
-1
region can
be interpreted as the signature of hydrogen metastable bonds, including the TCB bond, with
variations in the frequency due to the different overlap between the H and the Si electron
wave functions.
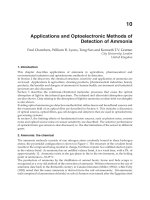
Fig. 10. Hydrogen stretch vibrations for a-Si64-H10 system at high frequency (Kupchak
et al.,
2008). The solid black line shows all H-associated stretching vibrations, including dihydride
modes (blue, short dash) and monohydride modes (red, long dash). Note the very close
agreement with data by Lucovsky
et al. (1989).
Optoelectronic Properties of Amorphous Silicon
the Role of Hydrogen: From Experiment to Modeling
21
Fig. 11. Time dependent frequencies for a “good” sample. Note the absence of vibrations
between the two main modes (2000 cm
-1
and 640 cm
-1
) indicating stability of the bonds. The
colour scale is related to the peak intensity, that is, white represents the strongest signal
(peak), while black represents no vibrational signal (Kupchak
et al., 2008).
The investigation led by this author has proven that in order to validate the simulation of
complex structure, bonding, and diffusion, a protocol needs to be established for the
verification of the “realism” of the simulated models. Using hydrogenated amorphous
silicon as an example, Gaspari
et al. (2009, 2010) have unambiguously demonstrated that
reproduction of the radial distribution function, used commonly in numerical simulations, is
not sufficient and must be complemented with verification of other, more complex,
macroscopic properties. By focusing on the vibrational modes of the amorphous system, it
was proven that the vibrational spectra represent a crucial testing tool for non-crystalline
materials because of their complexity and sensitive link to structure and bonding
configuration. Successful reproduction of all the experimentally observed vibrational
features for a-Si:H has proven the validity of the algorithm and indicates that hydrogen
structure and dynamics are extremely sensitive to the parameters of the model. In order to
correctly apply a numerical model to extract such important macroscopic parameters as
density of states, optical gaps, and migration dynamics, the accuracy should be verified first
by the derivation of the standard vibrational modes and comparison with experimental
observation.
Indeed, the importance of hydrogen distribution and its connection to hydrogen mobility is
demonstrated by recent investigations, both experimental and theoretical, on the role of
hydrogen in a-Si:H. For instance, Fehr
et al. (2010) investigated the distribution of hydrogen
Optoelectronics - Materials and Techniques
22
atoms around native dangling bonds in a-Si:H by electron-nuclear double resonance
(ENDOR). The authors suggest that the hydrogen distribution is continuous and
homogeneous and there is no indication for a short-range order between hydrogen atoms
and dangling bonds. This is in contrast with current understanding that hydrogen is
distributed as a succession of clustered and diluted phases (Gaspari
et al., 2010; Tuttle &
Adams, 1997). Such controversies can only be addressed by using a rigorous, realistic model
to simulate properties and dynamic processes.
6. Conclusions
Hydrogenated Amorphous Silicon (a-Si:H) has been the subject of intensive investigation for
over 30 years. The main role of hydrogen in amorphous silicon is the passivation of the Si
dangling bonds (DBs) to restore a proper energy gap and the semiconducting properties,
thus enabling extensive application of a-Si:H in the microelectronics and the photovoltaic
industry. Due to the importance of hydrogen, many experimental methods have been used
to characterize the DBs passivation, bonding chemistry and related mechanisms of
degradation of the material. Among the numerous experimental techniques used to study a-
Si:H and the role of hydrogen, the Fourier Transform Infrared Spectroscopy (FTIR) is used
extensively to analyze vibrational spectra of a-Si:H. Although FTIR represents one of the
most common and powerful techniques, no microscopic links between the observed
vibrational features of the hydrogen and the microscopic properties of a-Si:H can be yet
established by any experimental means.
A number of other important fundamental issues remain unresolved for a-Si:H as well.
Microscopic atom dynamics, for instance, influences atomic structure, chemical bonding,
diffusion and vibrations, and are difficult to study both experimentally and theoretically.
However, the microscopic details of disordering, hydrogen migration and bonding within
the amorphous silicon network is crucial for the understanding of a-Si:H, and for the
improvement of the overall quality of the material.
The Staebler-Wronski effect epitomizes this need. It is generally accepted that a-Si:H light-
soaking degradation, observed by Staebler and Wronski, is caused by Si-H bonds breaking
during illumination. However, the microscopic details of the SW effect are still controversial
and it is not clear how to experimentally predict the stability of a-Si:H films, grown at
particular temperature and hydrogen concentration, with respect to light induced
degradation. Furthermore, a number of alternative techniques have been used to create
dangling bonds, and the same dynamics has been observed in the curing (annealing) phase.
That is, no matter how the dangling bonds were formed, a similar curing process occurs
during annealing. This might be due to diffusion of hydrogen atoms, structural
readjustment, or a combination of the two.
In this chapter I have briefly summarized how the optical and electronic properties of a-Si:H
are dependent on the hydrogen content and pointed out that the challenge of uncovering
the microscopic details of hydrogen bonding and distribution and their correlation with
hydrogen dynamics cannot be answered by standard experimental techniques.
On the other hand, with the continuous improvement of computational capacity and
software quality, the simulation of realistic structures is becoming ever more feasible. In
particular,
Ab Initio Molecular Dynamics (AIMD) allows highly accurate simulation of the
dynamical properties of various systems, including amorphous materials.
Optoelectronic Properties of Amorphous Silicon
the Role of Hydrogen: From Experiment to Modeling
23
The goal of such simulations is to be able to reproduce dynamic processes and follow the
diffusion of hydrogen, the bond breaking processes, and the structural reorganization of the
material, following external perturbations. The DB creation process in tritiated amorphous
silicon can provide a simple and convenient source of experimental data that can be used as
a basis for such simulations, since the tritium decay process is well understood, and its effect
on a-Si:H can be treated as the simple removal of an hydrogen atom from an existing Si—H
bond.
The main challenge is of course to make sure that the simulated structure is indeed a
realistic one. The author of this chapter has shown that several models lack the necessary
realism, since the validation of the model is based on the radial distribution function of the
Si—Si bonds. The author has also shown that the reproduction of the vibrational modes of a-
Si:H represents a much better validation test for a realistic structure. As the continuous
advances in computational science will allow for the use of bigger simulated structures, the
future direction of these studies should aim at reproducing other fundamental properties,
such as the band-gap, the density of states, etc. By achieving this goal, it will be possible
then to simulate dynamic processes too, such as the SW effect, and to shed light both on the
formation phase of the dangling bonds and on the curing phase.
7. Acknowledgment
The work by the author was supported by the Shared Hierarchical Academic Research
Computing Network (SHARCNET) and Natural Sciences and Engineering Research Council
of Canada (NSERC).
The author would also like to thank Dr. A. Chkrebtii for his invaluable contribution and
leadership in the development of the AIMD algorithm. Thanks go also to Dr. J.M. Perz, Dr.
S. Zukotynski, and Dr. N. P. Kherani for their support and helpful discussions spread over
20 years.
8. References
Abtew, T.A., Drabold, D.A. (2006) Phys. Rev. B, Vol. 74, 085201.
Adler D., (1984)
AIP Conference Proceedings, n 120, 70-77.
Akkaya,A., & Akta,G. (1995).
Mater. Lett., Vol. 22, 271.
Baranovski, S. (2006).
Charge transport in disordered solids with applications in electronics. John
Wiley $ Sons, ISBN: 9780470095041, New York.
Biswas, R., Li, Q., Pan, B.C., Yoon, Y. (1998) Phys. Rev. B, Vol. 57, 2253.
Biswas, R., Pan, B.C. (2003) Solar Energy Materials and Solar Cells, Vol. 78, 447.
Branz, H.M., Asher, S.E., Nelson, B.P., (1993)
Phys. Rev. B Vol. 47, 7061.
Branz, H.M. (1999)
Phys. Rev. B Vol. 59, 5498.
Branz, H.M., Asher, S.E., Gleskova, H., Wagner S., (1999)
Phys. Rev. B Vol. 59, 5513.
Bruno, G., Capezzuto P., Madan A., (Eds.) (1995)
Plasma Deposition of Amorphous Silicon-
Based Materials.
Academic Press, ISBN: 9780121379407, Burlington, MA.
Cheong, H.M., Lee, S.H., Nelson, B.P., Mascarenhas, A., Deb, S.K., (2000)
App. Phys. Lett. B
Vol. 77, 2686.
Cody, G.D., Tiedje, T., Abeles, B., Brooks B., Goldstein, Y. (1981
) Phys. Rev. Lett. Vol. 47,
1480.
Optoelectronics - Materials and Techniques
24
Costea, S., Gaspari, F., Kosteski, T., Zukotynski, S., Kherani, N. P., Shmayda, W.T. (2000)
Mat. Res. Soc. Symp. Proc, Vol. 609, A27.4 (2000).
Costea, S., Pisana, S., Kherani, N.P., Gaspari., F., Kosteski, T., Shmayda, W.T., Zukotynski,
S. (2005)
Fusion science and technology Vol. 48, 712.
Danesh, P., Pantchev, B., Vlaikova, A. (2005)
Nuclear Instruments and Methods in Physics
Research
B, Vol. 239, 370.
Daouahi, M., Ben Othmane, A., Zellama, K., Zeinert, A., Essamet, M.,Bouchriha, H. (2001)
Solid State Communications Vol. 120, 243.
Darwich, R., Roca I. Cabarrocas, P., Vallon, S., Ossikovski, R., Morin, P., Zellama, K. (1995)
Phil. Mag. B, Vol. 72, 363.
Dubeau, J., Hamel, L.A., Pochet, T., (1996)
Phys. Rev. B 53, 10 740
Fehr, M., Schnegg, A., Teutloff, C., Bittl, R., Astakhov, O., Finger, F., Rech, B., Lips, K. (2010)
Physica Status Solidi A, Vol. 207, 552.
Gaspari, F., O’Leary, S.K., Zukotynski, S., Perz, J. (1993) J. Non-Cryst. Solids Vol. 155, 149.
Gaspari, F., Kosteski, T., Zukotynski, S., Kherani, N. P., Shmayda, W. (2000)
Phil. Mag. B,
Vol. 80, 561.
Gaspari, F., Shkrebtii, A., Kupchak, I., Perz, J.M. (2009)
Phys. Rev. B Vol 79, 224203.
Gaspari, F., Shkrebtii, A., Kupchak, I., Teatro, T., Ibrahim, Z.A. (2010)
35th IEEE Photovoltaic
Specialists Conference Proceedings
, Honolulu Hawaii, June 20-25, 003671-75.
Ishimaru, M. (2002)
J. Appl. Phys. Vol. 91, 686.
Izumi,
S., Hara, S., Kumagai, T., Sakai, S. (2005) J. Cryst. Growth Vol. 274, 47.
Jackson, W.B., Tsai, C.C. (1992)
Phys. Rev. B, Vol. 45, 6564.
Jackson, W.B., Santos, P.V., Tsai, C.C. (1993)
Phys. Rev. B, Vol. 47, 9993.
Jeffrey, F.R., Shanks, H.R., Danielson, G.C. (1979)
Appl. Phys. Lett. Vol. 50, 7034.
Kasap, S. (2005)
Principles of Electronic Materials and Devices. McGraw-Hill, retrieved from
.
Kato, S., Aoki, T. (1985)
J. Non-Cryst. Solids Vols. 77&78, 813.
Kherani, N.P., Liu, B., Virk, K., Kosteski, T., Gaspari, F., Shmayda, W.T., Zukotynski, S.,
Chen, K.P. (2008)
J. Appl. Phys. Vol. 103, 024906.
Knights, J.C., Lujan, R.A. (1979)
Appl. Phys. Lett. Vol. 35, 244.
Kosteski, T., Gaspari, F., Hum, D., Costea, S., Zukotynski, S., Kherani, N.P., Shmayda, W.T.
(2000
) Mat. Res. Soc. Symp. Proc. Vol. 609, A30.1.
Kosteski, T., Stradins, P., Kherani, N.P., Gaspari, F., Shmayda, W.T., Sidhu, L., Zukotynski,
S. (2003)
IEE Proc. Circuits, Devices and Syst., special issue on Amorphous and
Microcrystalline Semiconductor Devices, Vol. 150 no. 4, 274.
Kupchak, I. M., Gaspari, F., Shkrebtii, A. I., Perz, J. M. (2008
) J. Appl. Phys. Vol. 104, 123525-1
Laaziri, K., Kycia, S., Roorda, S., Chicoine, M. Robertson, J. L., Wang, J., Moss, S. C. (1999)
Phys. Rev. Lett. Vol. 82, 3460.
Ley, L. (1983) “Photoemission and Optical properties”, in
The Physics of Hydrogenated
Amorphous Silicon
, Vol II, Eds. J.D. Joannopoulos & G. Lucovski, Springer-Vderlag,
ISBN: 0387128077, New York.\
Longeaud, C., Roy, D., Teukam Hangouan, Z. (2000)
App. Phys. Lett. Vol. 77, 3604.
Lucovski, G., Davidson, B.N., Parsons, G.N., Wang, C. (1989)
J. Non-Cryst. Solids Vol. 114,
154.
Malik, S. M., O'Leary, S. K. (2004)
J. Non Cryst. Solids, Vol. 336, 64.
Optoelectronic Properties of Amorphous Silicon
the Role of Hydrogen: From Experiment to Modeling
25
Morigaki, K., Hikita, H. (2007) Phys. Rev. B 76, 085201
Morigaki, K., Takeda, K., Hikita, H., Ogihara, C., Roca i Cabarrocas, P. (2008)
J. Non-Cryst.
Solids
, Vol. 354, 2131.
Mott, N. (1983) “Conductivity, Localization, and the Mobility Edge”, in
The Physics of
Hydrogenated Amorphous Silicon
, Vol II, Eds. J.D. Joannopoulos & G. Lucovski,
Springer-Verlag, ISBN: 0387128077, New York.
O'Leary, S.K., Sidhu, L.S., Zukotynski, S., Perz, J.M. (1996)
Canadian Journal of Physics, Vol.
74, S256-9.
Powell, M.J., Deane, S.C., (1996)
Phys. Rev. B, Vol. 53, 10121.
Rui, Y., Mei, J., Xu, J., Yang, L., Li, W., Chen, K. (2005)
Proceedings of SPIE - The International
Society for Optical Engineering
, Vol. 5774, 279.
Santos, P.V., Johnson, M.N., Street, R.A. (1991)
Phys. Rev. Lett. Vol. 67, 2686.
Santos, P.V., Johnson, N.M., Street, R.A., (1992)
Mat. Res. Symp. Proc. Vol. 258, 353.
Santos, P.V., Johnson, M.N., Street, R.A. (1993)
J. Non-Cryst. Solids Vols. 164-166, Part I, 277.
Schneider, U., Schröder, B. (1990)
Photovoltaic Specialists Conference. Conference Record of the
Twenty First IEEE
, vol. 2, 1521.
Searle, T. (Ed.) (1998)
Amorphous Silicon and its Alloys, INSPEC, ISBN: 0852969228, London.
Sholz, A., Schröder, B., Oechsner, H. (1994)
Mat. Res. Symp. Proc. Vol. 336, 293.
Sidhu, L. S., Kosteski, T., Zukotynski, S., Kherani, N. P. (1999)
J. Appl. Phys. Vol. 85, 2574.
Singh, R., Prakash, S., Shukla, N., Prasad, R. (2004)
Phys. Rev. B Vol. 70, 115213.
Smets, A.H.M., van de Sanden, M.C.M. (2007)
Phys. Rev. B, Vol. 76, 073202.
Staebler, D.L., Wronski, C.R. (1977)
Appl. Phys. Lett. Vol. 31, 292.
Street, R.A., Biegelsen, D., Stuke, J., (1979)
Philos. Mag. B Vol. 40, 451.
Street, R.A. (1980)
Phys. Rev. B, Vol. 21, 5775.
Street, R.A. (1991)
Hydrogenated Amorphous Silicon, Cambridge University Press, ISBN:
0521371562, New York.
Street, R.A. (Ed.) (2000)
Technology and Applications of Amorphous Silicon, Springer Verlag,
ISBN: 3540657142, New York.
Street, R.A., Tsai, C.C. (1988)
Philos. Mag. Vol. B57, 663.
Stutzmann M., Jackson W.B., Tsai, C.C. (1985), Phys. Rev. B, Vol. 32, n 1, 23-47
Stutzmann M., (1991) in
Amorphous and Microcrystalline Amorphous Devices, Vol. II, Ed. J.
Kanicki, Atech House, Boston, p. 129.
Tauc, J., Grigorovici, R., Vancu, A. (1966)
Phys. Status Solidi, Vol. 15, 627.
Thevaril, J.J., O’Leary, S.K. (2010)
J. Appl. Phys., Vol. 107, 083105.
Tuttle, B., Adams, J. B. (1997)
Phys. Rev. B Vol. 56, 4565.
Ukpong, A.M. ((2007)
Turkish Journal of Physics, Vol. 31, 317.
Van de Walle, C.G., Street, R.A. (1994)
Phys. Rev. B, Vol. 49, n 20, 14766-9.
Van de Walle, C.G., Street, R.A. (1995)
Mat. Res. Soc. Symp. Proc., Vol. 377, 389.
Yelon, A., Fritzsche, H, Branz, H.M., (2000)
J. Non-Cryst. Sol. Vols. 266-268, 437.
Ju, T., Whitaker, J., Zukotynski, S., Kherani, N., Taylor, P.C., Stradins, P. (2007)
Mat. Res. Soc.
Symp. Proc
. Vol. 989, 9.
Whitaker
J., Viner, J., Zukotynski, S., Johnson, E., Taylor, P.C., Stradins, P. (2004) Mat. Res.
Soc. Symp. Proc
. Vol. 808, 153.
Zanzucchi, P.J., Wronski, C.R., Carlson, D.E. (1977)
J. Appl. Phys. Vol. 48, 5227.
Optoelectronics - Materials and Techniques
26
Zeman, M. (2006) “Advanced Amorphous Silicon Solar Cell Technologies”, in Thin Film
Solar Cells: Fabrication, Characterization and Applications
, Eds. J. Poortmans & V.
Arkhipov, John Wiley & Sons, New York.
Zhang, S.B., Branz, H.M., (2001)
Phys. Rev. Lett. Vol. 87, 105503
Zukotynski, S., Gaspari, F., Kherani, N., Kosteski, T., Law, K., Shmayda, W.T., Tan, C.M.
(2002)
J. Non-Cryst. Solids Vols. 299-302, 476.
2
Silicon–Rich Silicon Oxide Thin Films
Fabricated by Electro-Chemical Method
Pham Van Hoi, Do Thuy Chi, Bui Huy and Nguyen Thuy Van
Vietnam Academy of Science and Technology,
Vietnam
1. Introduction
Porous silicon (PS) has attracted increasing research interest in basic physics as well as
applications since 1990 when Canham reported on the efficient visible photoluminescence
(PL) of porous silicon (Canham, 1990). Structurally, PS consists of many pores and silicon
residuals and usually can be described as a homogeneous mixture of silicon, air and, even
silicon dioxide. Based on porosity, PS can be classified into three types: nano, meso- and
macro-pores. In the case of PS nano-pores, the size of both the silicon residuals and the air
voids (pores) can be in the range of few nanometers. The exciton Bohr radius in Si is around
4.3 nm, so that quantum confinement can occur and change the electronic structure of those
silicon nanocrystals. On the other hand, because the value of porosity is directly linked to
the effective index of refraction of the PS layer, this layer appears as an effective medium,
where the refractive index has a tunable value between the index of refraction of bulk Si and
that of the air (pores). Those changes in the electronic structure and refractive index of PS
when compared with bulk Si make it fascinating as both a low-dimensional material and an
optical one. The considerable and controllable changes in the electronic structure and
refractive index of PS fabricated by electrochemical anodization make it a promising
material for photonics in comparison with bulk silicon and/ or pure silica. Using the
oxidation process in O2 environment at high temperature, the PS samples become silicon-
rich silicon oxides (SRSO), which has high chemical instability and avoids the aging of the
PS that is important condition for optical devices such as planar optical waveguides, optical
interference filters, micro-cavities, etc (Bettotti et al., 2002). During the last decade, Erbium
(Er)-doped silicon-rich silicon oxide has attracted much interest due to its big potential
application in Si-based optoelectronic devices for telecom and optical sensors. The Er-ions
implanted in SRSO materials produce light emission at around wavelength range of 1540
nm, which corresponds to minimum light absorption in silica-based glass fibers. In this
regard, a lot of studies have been carried out to improve the luminescence efficiency of this
material. Such studies have revealed that co-implantation of Er and O
2
induce a strong
enhancement in the Er-ions related emission at range of 1540 nm. In first case, samples were
prepared by co-implanting Si and Er into silica thin films or co-sputtering Si, Er
2
O
3
and SiO
2
on the silicon substrate (Shin et al., 1995). In second case, samples were prepared by
implanting Er-ions into SiO
2
films containing Si-nanocrystals (nc-Si) and/or by Er-ion
electrochemical deposition on silicon-rich oxide (SRSO) layers. The room temperature
luminescence emission at the range of 1540 nm from Er-electrochemically doped porous
Optoelectronics - Materials and Techniques
28
silicon was first reported by Kimura T. et al in 1994 (Kimura et al., 1994) and then followed
by some other authors. The strong luminescence emission around 1540nm-range of Er-
doped SRSO layers at room temperature can be explained by energy transfer from excitons
confined in the nc-Si to Er-ions and the evidence of energy transfer had been revealed in
photo-luminescent excitation spectra in visible and infrared region when the exciting
wavelength was not equalized to resonant absorption wavelength of Er-ions. Up to now,
there are very few evidences of energy transfer given in the case of Er-electrochemically
doped SRSO layers.
In this book chapter, we will discuss the electrochemical method for preparing SRSO based
on PS layers and Er-doped SRSO thin films for waveguide, optical filter and micro-cavity. In
concentrating on the controllable changes in the refractive index of PS, we would like to use
SRSO as a material for photonic devices such as optical interference filters, micro-cavities,
etc. As an optical material, we present the fabrication method and properties of planar
optical waveguides, active optical waveguides and optical interference filters operated in
the range of infrared wavelengths. The advantage of optical waveguide amplifier based on
Erbium-doped SRSO is the efficient energy transfer from electron-hole pairs generated in
the Si nanocrystals to their neighbor erbium ions, which decay by emitting light at 1540nm
(Bui Huy et al., 2008). The excitation cross-section of Er-ions in Er-doped SRSO is strongly
increased in comparison of this one in the Er-doped silica glasses, so that the pump
efficiency in Er-doped SRSO waveguides can be very high. The effect of energy transfer in
elaborated Er-doped SRSO waveguides has also been explored. In order to design and
predict the properties of the optical interference filters and micro-cavity based on SRSO
multilayer, a simulation program based on the Transfer Matrix Method (TMM) was set up
and the possible causes the difference in reflectivity spectra from this simulation and that
from elaborated filters and/or cavity have been also given (Bui Huy et al., 2011). The
structure and optical properties of SRSO layers are characterized by FE-SEM (Hitachi S-
4800), M-line spectroscopy (Metricon 2010/M) and luminescent measurement. The energy
transfer effect between silicon nanocrystals and Er ions in the SRSO layers has been obtained
from experiments.
With the above-mentioned aim in mind, this chapter consists of the following sections:
Section 2 presents the electrochemical method for preparing PS samples, Section 3 shows
SRSO bi-layers based on PS annealed in oxygen environment at high temperature as a
passive and active waveguides, Section 4 shows PS and/or SRSO multilayer with periodical
refractive index change as an optical filter, Section 5 presents PS and/or SRSO multilayer
with DFB configuration as micro-cavity, and Section 6 gives conclusions.
2. Electrochemical method for making SRSO thin films
The porous silicon thin films were formed from silicon wafers by electrochemical etching in
hydro-fluoric acid, without the necessity of any deposition process (Smith et al., 1992).
During this anodization process a part of the silicon is dissolved and the remaining
crystalline silicon forms a sponge-like structure with porosity between some tens percent up
to more than 90%. The microstructure of the PS depends on the doping level of the silicon
wafers: the use of low doped p-type substrates results in nanoporous silicon (with pore and
crystallite size less than 2 nm) and the use of highly doped substrates in mesoporous silicon
(size of 2-50 nm) (Herino et al., 1987). In the both cases the structures are much smaller than
the wavelength of visible light and the materials appear as a homogenous, effective optical
Silicon–Rich Silicon Oxide Thin Films Fabricated by Electro-Chemical Method
29
medium. The effective refractive index of the porous silicon thin films is mainly determined
by the porosity which can be varied by several anodization parameters. The most suitable
way is changing the anodization current density, with high current densities resulting in
high porosities and low refractive indices.
A porous silicon thin film consisting of void spaces in silicon is created as a result of the
electrochemical dissolution process in hydrofluoric acid, which can be expressed as in
Equation (Valance, 1997):
2
62
Si 4HF 2F 2h SiF H 2H
−+ − −
+++→ ++ (1)
The mass transport of positive charge carriers (h
+
) in the substrate and reactant fluorine ions
(F
-
) in the electrolyte are key components in the dissolution process. As described in the
model by Lehmann and Gösele (Lehman & Gösele, 1991), dissolution begins when holes
reach the silicon surface under anodic bias and enable a fluorine ion to replace a hydrogen
atom bonded to silicon. Due to the polarizing influence of the bound fluorine ion, further
reaction are initiated in which fluorine ions continue to bind to the silicon atom and
hydrogen gas is formed. When all four silicon bonds are broken, the silicon atoms become
soluble and leave behind an atomic size corrugation in the former atomically flat surface.
Pore formation continues at the surface irregularity where the electric field is concentrated
and holes are available. The interpore space is depleted of holes, inhibiting sidewall
dissolution.
In general, the preparation process of Er-doped silicon-rich silicon oxide layers can be
divided into 3 steps: making a porous silicon (PS) layer by anodic etching of a Si-crystalline
wafer in a HF solution; Er-ion deposition on the PS layer in Er content solution; and using
thermal annealing at high temperature in oxygen and/or inert gases to obtain SRSO
materials. The PS sample preparation is carried out in two approaches: keeping the current
and/or the potential at a constant value during the electrochemical deposition (ECD)
process. The difference between these two methods is that in the constant potential ECD, an
n-type Si-crystalline wafer is usually used without annealing steps while in the constant
current ECD, p-type Si-wafers are used and need thermal annealing. In our work we used
both ECD methods for making PS layers on n- and p-type Si-crystalline wafers.
2.1 Experimental procedure
In the electrochemical method for fabrication of porous silicon thin films, silicon wafer acts
as the anode and is situated at the bottom of the Teflon cell. The silicon wafer was coated
Au-thin film in back-side and contacted to HF-resistant metallic electrode in the form of the
disk. This electrode disk enables a uniform contact on the whole area of silicon wafer. The
electrolyte is a mixture of hydrofluoric acid and ethanol (C
2
H
5
OH) at different
concentrations and poured into the Teflon cell. The platinum wire, which is also chemically
resistant to HF, acts as the cathode. The shape of the cathode is critical to ensuring
homogeneous samples, because it must promote a uniform electric field while allowing
hydrogen bubbles formed during the anodization process to escape. The Teflon cylindrical
tube with diameters of 10-15mm was placed between the upper and lower parts of the
Teflon cell. Finally, a stainless steel ring and nuts are used to hold the cell together. We can
use either current or voltage source for the anodization process. In our experiments, we
used the electrochemical system Autolab PGS-30 as the electric current source, which can
control the current with the nano-Amper range. Figure 1 presents the experimental setup for
Optoelectronics - Materials and Techniques
30
making porous silicon thin films. The computer-controlled electric source used for the
electrochemical process, so precise control over current density and etching time were
achieved, and then it is resulting in a good control of the refractive index and thickness over
the individual layers forming the multilayer. The program is a LabView virtual instrument
realized to control the fabrication process of monolayer and multilayer of porous silicon
with a friendly interface. The program controls the different parameters of the
electrochemical process via GPIB. Those parameters include two current steps (to form
layers with different refractive indices), duration time of each step (to determine the
thickness of each layer), delay time (time between two consecutive electrochemical
currents), and number of period (number of multilayer structure).
Fig. 1. Electrochemical etching setup for fabricating PS layers
2.2 Silicon samples
The initial Si-crystalline wafers, n-type with resistivities of 1-5 Ω.cm and p-type with
resistivities of 0.01-1 Ω.cm, were used for constant potential and constant current ECD,
respectively. For the case of n-type silicon substrates we need to illuminate the back side of
silicon wafers. Resistivity of silicon wafer strongly affects on quality of porous silicon layers.
High resistivity wafer often makes porous silicon layers with rough surface and easily
peeled off from Si-substrate during fabrication or drying process, while the low resistivity
sample have more flat surface of porous silicon layers. In order to form Ohmic contacts on
the samples, we deposited pure gold (Au) and/or aluminum (Al) on the back faces of the n-
and the p-type samples, respectively. The Si-crystalline wafers were anodic etched in a HF-
ethanol solution with HF concentrations from 10% to 30% at a constant current density of
10-60 mA.cm
-2
for time durations from some seconds to 15 minutes for controlling the
refractive index of the PS layers. If the current density is modulated during the anodization,
alternating layers of different porosities are formed as the silicon dissolution occurs
primarily at the etched front PS/silicon substrates (Frohnhoff et al., 1995). Although the
interface roughness between stacks is about 10-20nm, light scattering at these interfaces
turned out to be very low. For this reason such layer stacks can act as optical waveguides
and/or interference filters if the refractive indices are chosen properly (Krüger et al., 1998).
Silicon–Rich Silicon Oxide Thin Films Fabricated by Electro-Chemical Method
31
3. Active waveguide based on SRSO thin films
Initially, Canham proposed that the up-shift of the luminescence spectrum into the visible was
due to quantum confinement in the silicon crystalline wire structure and that the hydride
passivation of the Si wire was the reason for the high efficiency of the observed
photoluminescence (PL). For a short time after that, spectroscopic studies conducted
particularly on the polarization of the PL (Kovalev et al., 1996) and on features observed under
conditions of resonant excitation (Calcott et al., 1993) have provided strong positive
confirmation of the quantum confinement model. However, there were a lot of spectroscopic
phenomena that can not be explained by the simple quantum confinement model. As such,
numerous models have been put forward as alternative explanations for the PL from PS such
as hydrogenated amorphous silicon, surface hydrides, defects, molecules, surface states
(Amato & Rosenbauer, 1997). It is well known that in PS the surface to volume ratio is very
large, so the surface effects are expected to have a significant influence on the material
properties, especially optical ones (Kanemitsu et al., 1993). Because the Si atoms in Si
nanocrystals are either at the surface or a few lattice sites away, the arrangement of interfacial
atomic bonds, i.e. the passivation with Si-H or Si-O bonds, strongly affects the energy
distribution of electronic states (Wolkin et al., 1999). In order to study PS as low-dimensional
photonic materials, we elaborate on the effect of ageing on the spectral, intensity and lifetime
of PL from the silicon nanocrystals in PS. Experimental results show that the effect of ageing
on the spectral, intensity and PL lifetime of PS depends on the size of silicon nanocrystals. We
focus our attention on strong emission properties and employ PS as a material for light
emission sources, i.e. light emitting diodes and micro-cavity lasers operated in the visible
region. In concentrating on the controllable changes in the refractive index of PS, we would
like to use PS as a material for photonic devices such as planar optical waveguides, optical
waveguide amplifier, optical interference filters, etc. As an optical material, we present the
fabrication method for silicon rich silicon oxides (SRSO) thin films and properties of planar
optical waveguides, active optical waveguides and optical interference filters operated in the
range of infrared wavelengths. The advantage of optical waveguide amplifier based on
Erbium doped SRSO is the efficient energy transfer from electron-hole pairs generated in the Si
nanocrystals to their near erbium ions, which decay by emitting light at 1540nm. The excitation
cross-section of Er-ions in Er-doped SRSO is increased more than two orders in comparison of
this one in the Er-doped silica glasses (Friolo et al., 2001), so that the pump efficiency in Er-
doped SRSO waveguides can be very high.
3.1 Porous silicon as a low-dimension photonic material
In the first part of this section we explain the effect of surface states on the PL properties of PS
based on the ageing process in air. In the last part, we present the reason for the intense and
stable luminescence of blue region which has been of great interest in recent studies
(Gorelkinskii et al., 2008). Previous studies on the interaction of oxygen in air on the as-
prepared PS (Wolkin et al., 1999) show that: I) the as-prepared samples were well passivated
by hydrogen and free of oxygen, ii) after exposure to air the samples were gradually
passivated by oxygen, and the red-shift of PL spectral occurred as samples exposure to air and
was nearly completed after ageing of 24 h. It was suggests that the ageing process can be
divided into two periods: the first one in which the transition of the luminescence mechanism
occurs after exposing the sample to air for a short time, and the second one in which the non-
radiative center concentration is changed by oxygen passivation (Bui Huy et al, 2003).
Optoelectronics - Materials and Techniques
32
Fig. 2. PL spectra of the as-prepared samples and after exposure to air for 1-month; samples,
denoted as 1,2 and 3, were prepared by the anodic etching in 20%, 13% and 10% HF
solution, respectively. (a) sample 1, (b) sample 2 and (c) sample 3
In order to investigate the effect of surface passivation on the size of Si nanocrystals, a series
of PS samples denoted as 1, 2 and 3 were prepared by anodic etching in 20%, 13% and 10%
HF solution respectively. As seen in figure 2, the PL peaks of the as-prepared samples 1, 2
and 3 have energy levels of 1.73, 1.84 and 2.00 eV respectively. This is related to a decrease
of particle size in the considered samples. The figure also reveals that the ageing produces a
pronounced increase in PL intensity in sample 1 and only a slightly increase in samples 2
and 3. As seen in figure 3, the decay rate of the as-prepared samples (the curves 1a, 2a and
3a) shows that the concentration of non-radiative centers in sample 1 is higher than those in
samples 2 and 3. The pronounced increase in intensity (in figure 2) as well as the
pronounced decrease in decay rate (in figure 3) of sample 1 could be caused by the oxygen
passivation of non-radiative defects. In samples 2 and 3 containing smaller particles, the
initial passivation degree is higher, therefore the ageing is expected to induce a small change
both in intensity and decay rate. The data comparison from curves 2a and 2c in figure 3
reveals that the modification of emission mechanism has no effect on the decay rate as well
as its energy dependence τ
-1
(E). This result seems to indicate that the replacement of Si-H
bond by a Si-O one acting as a radiative center has no effect on the lifetime.
Fig. 3. Evolution of decay rate as a funtion of emission energy from sampes after
preparation, curves 1a, 2a, 3a and after exposure to air for 1-month, curves 1b, 2b. Curve 2c
coresponds to sample 2 for 24 h (Bui Huy et al., 2003).
Energy (eV)
Intensity (a.u)
After 1 month
As-prepared
Silicon–Rich Silicon Oxide Thin Films Fabricated by Electro-Chemical Method
33
Figure 2 and 3 established the relation between the size of particle, intensity and decay rate
during ageing. In the sample containing larger nanocrystals, the change in intensity and
decay rate, i.e. the luminescence lifetime, is much larger compared with that of the smaller
nanocrystals during ageing process.
Figure 4 shows the evolution of PL spectra, measured at the end of an excited pulse after
different exposure times. The figure reveals that the blue zone with the PL emission peaked
at 470 nm is only observed after 72 hours of exposure to air. Furthermore, the figure also
reveals that the PL intensity increases with increasing air exposure time. These observations
differ from those reported by Volkin et al. (Wolkin et al., 1999) in which the intensity of blue
emission from the as-prepared sample containing the small Si particles was shown to
decrease as the exposure time increased. This result indicates that the blue-light emission
observed in the present work does not originate from very small nanocrystals. Curve 4im
shows the PL spectrum of a sample, which was exposed to air for 94 hours and then
immersed in HF: ethanol solution. In comparing curves 4 and 4im, one can state that the
blue zone in the PL spectrum observed for the sample after 94 hours of exposure to air is
completely quenched. This quenching clearly relates to the fact that the silicon oxide layers
in the exposed sample have been removed. The above results indicate that the intense and
stable emission in the blue zone of the PL spectra observed in the considered samples relates
to defects in silicon oxide layers.
Wavelength (nm)
Intensity
Energy (eV)
Fig. 4. Evolution of PL spectral measured at the end of excitation pulse from a PS sample
after different exposure time (1): as-prepared, (2; 3; 4): after 26, 72 and 94 h of exposure to
air, respectively, (4im): corresponding to sample exposed to air for 94 h. and then immersed
in 5% HF: ethanol solution for 10 sec (Bui Huy et al., 2006).
3.2 Fabrication and characteristics of SRSO planar and active optical waveguides
In this section, before elaborating on the fabrication method and properties of planar optical
waveguide, active optical waveguides, and optical interference filters based on SRSO thin
films we explain the method of production for the PS multilayer which forms the basis for
these devices.
The production of PS multilayer is possible because: (i) the etching process is self-limited
(i.e. once porous layer is formed, the electrochemical etching of this layer stops); (ii) the
Optoelectronics - Materials and Techniques
34
etching occurs mainly in correspondence between the pore tips; (iii) the porosity depends
only upon the current density once the other etching parameters are kept fixed; and (iv) the
refractive index of PS depends on its porosity (Mazzoleni & Pavesi, 1995). Therefore, by
varying the current density during the etching process, it is possible to vary porosity in the
etching direction. In this way, the formation of a stack of PS layers of different porosities
(and hence, different refractive indices) results in a dielectric multilayer.
Our process for preparing an optical planar waveguide consists of 2 steps: making a PS film
which contained a core layer and a cladding one, and stabilizing the waveguide structure by
thermal annealing at high temperature in oxygen ambient for obtaining SRSO. In the
process of fabricating an active optical waveguide, a step of deposition of Er ion into the PS
film was carried out before thermal annealing. The high temperature treatment can cause an
optical activation of Er ions in SRSO.
The PS films were formed by electrochemical etching of 1Ωcm p-type Si wafers in 30%HF:
ethanol solution. The top core layer was fabricated by applying current density of
15mA/cm
2
for 7 min. The cladding was formed in the same way, with current density of
65mA/cm
2
for 3 min. These conditions allowed the core and cladding to have a porosity of
about 60% and 65%, respectively. For Er-deposition on the PS layer, the PS layers were
immersed in an Er-content solution, and a negative bias, relative to a platinum electrode,
was applied to the PS samples for a certain time so that Er-ions were drawn into the pores of
the PS. In the constant current ECD method, an ErCl
3
–ethanol solution with an Er-
concentration of 0.2 mol / liter was used, and the drift current was changed from
0.17mA.cm
-2
to 0.45mA.cm
-2
to obtain different Er-concentrations in the PS layers. To enable
the optical activation of Er ions distributed in the pores of the PS layer, the sample was
annealed at 400
0
C for 2 h. For making the SRSO layers, we thermally annealed the samples
at 800
0
- 950
0
C in oxygen ambient for a short time (5-30 min.) and kept samples for a longer
time in nitrogen gas at 1100
0
C.
Figure 5 presents the FE-SEM image of a two-layer SRSO with different refractive indices (n
core
> n
clad
), which had been controlled by using current density of 20 and 30 mA.cm
-2
for the
core and the cladding layers, respectively. Based on the contrast between the core and the
cladding due to the difference in porosities, it is observed that the film consisted of two
layers in which the core layer thickness is about 4.5 μm, and the cladding about 7 μm. The
thickness of layers depended on the time duration of electrochemical process, and layers of
up to tens of microns could be grown.
Core
Cladding
Si-Substrate
Fig. 5. FE-SEM image of bi-layer SRSO on a silicon substrate.
Silicon–Rich Silicon Oxide Thin Films Fabricated by Electro-Chemical Method
35
Figure 6 shows the HRSEM image of the surface of the core and cladding before (PS layer)
and after (SRSO layer) of thermal annealing. As seen from Figures 6a and 6c, the difference
in the density of the black area and the pores in the PS layer show that the porosity in the
core layer is lower than that in the cladding. From this image we also observed the
differences in density of the black area and the contrast between the black area and the
white one from the PS layers (Figures 6a and 6c) and SRSO layers (Figures 6b and 6d). Those
differences suggest that the treatment can cause a decrease in the size of pores and the
porosity of SRSO layers. The prepared SRSO layers were dense and therefore the optical
properties of the waveguides were stabilized.
a
clad
b
clad
c
core
d
core
Fig. 6. FE-SEM image of surface of the core and cladding of PS layer (a, c), and of SRSO layer
(b, d), which was obtained before (a, c) and after (b, d) thermal annealing in order to
estimate their porosities.
Samples Sample layers Refractive index Thickness (μm)
Series No.1 Core layer 1.4512 5.54
Cladding layer 1.4275 3.35
Series No.2 Core layer 1.6088 1.908
Cladding layer 1.5402 6.239
Table 1. Parameters of SRSO waveguide samples
The waveguide properties of the SRSO multi-layers were characterized by using M-line
spectroscopy with the Prism-coupler method (Metricon 2010/M), which has the capacity to
measure the thickness, the refractive index and the wave-guided modes in thin films with high
accuracy (±0.0005 for index). The number of wave-guided modes in the SRSO waveguide
strongly depended on the thickness of the core layer. Figure 7(a) shows that a single mode of
1310 nm in wavelength could be guided in a core layer with a thickness of 1.9 micron. The
measured indices of this sample were 1.6088 and 1.5402 for the core and the cladding layers,
respectively. Figure 7(b) demonstrated the measured indices and the two-mode waveguide at
a 1310-nm wavelength for a core layer with a thickness of 5.54 microns. The measured indices
were 1.4522 and 1.4275 for the core and the cladding, respectively. This result shows that, by
changing the current density in the ECD process, we can obtain a planar layer with different
indices that support the waveguide properties in the layer. The Er-ion distribution in the SRSO
layer was characterized by using the EDX method with the SEM technique. The Er-ion
concentration, which was doped into PS, could be controlled by using an Er-content solution
Optoelectronics - Materials and Techniques
36
and by using the current density in the ECD method. For the purpose of obtaining high-
concentration Er-doped SRO materials (more than 0.1 atomic % of Er) without Er clusters,
which would be good candidates for planar-waveguide amplifiers, we carried out a very
careful study of the distribution of Er ions along the depth of the SRSO layer.
(a)
(b)
Fig. 7. Waveguide properties of the SRSO core/cladding layers. (a) Single-mode in the
sample with core/cladding thickness of 1.90/6.24 μm and indices of 1.6088/1.5402 (b) Multi-
mode in the sample with core/cladding thickness of 5.54/3.35 μm and indices of
1.4512/1.4275.
Samples Type and resistivity HF concentration Er-drift current Annealing
(%) (mA.cm
-2
) (
0
C)
BH-10 p-type, 1 Ωcm 30 0.17 950
BH-11 p-type, 1 Ωcm 25 0.20 950
BH-12 p-type, 1 Ωcm 20 0.17 950
BH-13 p-type, 1 Ωcm 30 0.20 820
BH-14 p-type, 1 Ωcm 25 0.25 950
BH-15 p-type, 10 Ωcm 30 0.17 950
BH-16 p-type, 1 Ωcm 25 0.45 950
Table 2. Preparation conditions of Er-electrochemically-doped SRSO samples
Figure 8a shows a SEM image of the Er-doped SRSO wave-guide layer prepared by using
the ECD method with a drift current density of 0.2mA.cm
-2
. The measurement was carried
out for an Er-doped SRSO thickness of 5 microns, and the Er-ion concentration was
measured at points along the depth of the SRSO layer. The Er-ion concentration increased
from 0.11 atom % at the top surface to 0.2 atom% at the depth of 3.5 micron from the top
surface. The Er-ion concentration decreased with further increased in the depth inside the
samples (see fig. 8b). For the characterization of optical properties of Er-doped SRSO layers,
the Nitrogen gas laser (LN 1000, λ=337.1nm) an Argon laser (Coherent Inova 300, λ= 488nm)
and a 1-W continuous laser diode (λ=976nm) were used as optical excitation sources. The
Silicon–Rich Silicon Oxide Thin Films Fabricated by Electro-Chemical Method
37
luminescent emission from the samples was collected by using two optical fibers located at
10 mm from the sample surface. The luminescence emission was analyzed by using a Jobin-
Yvon spectrometer (HR460) with a multi-channel Charge-Coupled Device (CCD) detector
and by Triax 320 spectrometer with a C7211 Hamamatsu CCD infrared detector for visible
and infrared light, respectively.
5
4
3
2
1
0.10 0.12 0.14 0.16 0.18 0.20 0.22
Concentration Er
3+
[Atom%]
Thickness [
μ
m]
(a) (b)
Fig. 8. FE-SEM image of Er-doped SRSO layers on a Si- substrate with the Er-concentration
measured at points along the depth of the layer by using EDX method (a) and the Er-ion
distribution inside the sample (b).
The first criteria for the Er-doped SRSO samples were that they could be in both optically
activated centers: the Si-nanocrystal induced visible light and the Er ion induced infrared
light. Our experiment shows that the samples without thermal annealing did not emit IR
light, but after thermal annealing, they strongly emitted in the 1540-nm range. This fact
shows that thermal annealing at high temperatures for obtaining Er-doped SRSO layers is
an important condition for optical activation of Er ions.
In general, the intensity of luminescence emission at 1540 nm will be increase with
increasing concentration of Er ions in the SRSO layer (Elhouichet & Oueslati, 2007), when
the Er-ion concentration reaches its saturation value, the luminescence intensity at 1540 nm
will be decreased due to the quenching effect from Er-ion clusters (Kit & Polman, 2000).
Figure 9 presents the luminescence spectra at 1540 nm for samples with different drift
currents from 0.17 to 0.45mA.cm
-2
under excitation by 976-nm laser beam. The 1540-nm
luminescence intensity of all the samples increased with increasing drift current density
from 0.17 to 0.25mA.cm
-2
, but when the drift current density was more than 0.25mA.cm
-2
the
luminescence decreased slightly with increasing drift current.
The evidence of energy transfer can be obtained by changing the wavelength of the
excitation source. The pump at 976 nm only caused a direct excitement of Er ions (from
4
I
15/2
to
4
I
11/2
level), whereas the pump at 488 nm caused both a direct excitement of Er ions (from
4
I
15/2
to
4
F
7/2
level) and an indirect one related to the energy transfers from Si-nc to Er ions.
As the effective Er excitation cross-section in the Er-doped SRSO layer is more than two
orders of magnitude higher with respect to the Er resonant absorption of a photon, the
pump at 976 nm causes a linear dependence of intensity on excited power (Najar et al., 2006)
and the pump at 488 nm causes the non-linear one as seen in Figure 10. The
photoluminescence intensity of samples irradiated by a 976-nm wavelength increased
linearly with increasing excitation power when the PL emission of the sample pumped at a
488-nm wavelength has reached saturation at high power.
Optoelectronics - Materials and Techniques
38
Intensity (a.u.)
Wavelength (nm)
1400
1500 1600 1700
2
4
8
12
16
20
λ
exc
= 976 nm
2
3
1
T=300K
Fig. 9. Luminescence spectra from samples 1, 2 and 3 under drift current density of 0.17,
0.25, and 0.45mA cm
-2
, respectively.
0 200 400 600 800 1000
50
100
150
200
λ
Exc
= 488 nm
λ
Exc
= 976 nm
λ
Dte
= 1534 nm
100
200
300
400
500
600
Intensity [arb.units]
Excitation Power [mW]
Fig. 10. Dependence of luminescence intensity of Er-ions at 1534 nm on the power of the
excitation laser at wavelengths of 488 nm and 976 nm.
4. Interference filters based on porous silicon and silicon-rich silicon oxide
layers
Interference filters based on PS were realized for the first time in the last decade (Vincent,
2004). They are formed from silicon wafers by electrochemical etching in HF solution.
Compared with other methods, the electrochemical etching method avoids the difficulty
associated with the stacking and assembly of dielectric layers, eliminates the need for the
lengthy deposition of thick films, and permits a wide range of refractive indices to be
fabricated from a single silicon substrate. PS interference filters usually formed from
different dept profiles of the refractive index of PS multi-layers which act as Bragg reflectors.
The optical thickness of the high- (n
H
) and low-refractive index (n
L
) layers are 1/4 of the
filter wavelength, so that these structures are usually called quarter-wave-stacks (Kruger et
al., 1998). The effective refractive index of PS layer is mainly determined by the porosity
which can be varied by several anodization parameters. The most suitable way is changing
Silicon–Rich Silicon Oxide Thin Films Fabricated by Electro-Chemical Method
39
the anodization current density, with high current densities resulting in high porosity and
low refractive index. However, one of the main problems concerning the use of PS
interference filters is the ageing of the PS: due to the large inner surface of the porous silicon
the material oxidizes very fast compared to bulk silicon. This phenomenon is well-known
from emitting PS layers, which was discussed in the section 3 of this chapter. For PS
interference filters the natural oxidation is disturbing as well as it causes a change of the
refractive index and of the PS layer thickness (Barla et al., 1986), which results in the
following ageing effects: (i) a blue-shift of the filter wavelength; (ii) a decrease of the filter
performance, if the change of the optical thickness is different for the n
H
and n
L
layers; (iii) a
continuous decrease of reflectivity, which depends on the refractive index ratio n
H
/ n
L
. The
ageing effect of the PS quarter-wave-stacks could be strongly reduces by a thermal
annealing process to obtain SRSO structure.
4.1 Simulation of the PS interference filters
4.1.1 Mathematical model
Before fabricating the interference filters based on multi-layer structure, a simulation
program was set up in order to design and predict the optical properties of interference
filter based on quarter-wave-stacks. Each quarter-wave stack system is characterized by the
following basic parameters: number of layers, refractive indices, and optical thicknesses of
layers. The computation of reflectivity and transmission spectrum from the above
parameters has an important role in knowing thoroughly about multilayer system. There are
many numerical methods for analyzing the multilayer system such as Transfer Matrix
Method, Plane Wave Method, and Finite Difference Time Domain. In our work we use
Transfer Matrix Method (TMM) for simulation of reflectivity and transmission of
interference filters. The TMM can handle any number of layers in a multilayer structure. In
addition, these layers can be ordered in any manner and there is no requirement that they
should be periodic. Even if they are periodic, the unit cell that is repeated does not have to
be composed of two layers only, but any number of layers. There is also no restriction on the
thickness of any layer. The thickness and the refractive index of each layer can be defined
independently. This makes the TMM most suitable for modeling structures formed by
different periodic multi-layers stacked together, since they are not fully periodic. The TMM
can also handle structures having a high index contrast between their two composite
materials contrast material systems. This makes the TMM suitable for modeling multilayer
structures, which usually have a high index contrast between their composite materials.
h
1
h
2
n
H
A
1
'
A
1
B
1
'
B
1
n
L
A
2
'
A
2
B
2
'
B
2
n
H
A
1
'
A
1
B
1
'
B
1
n
H
A
1
'
A
1
B
1
'
B
1
n
L
A
2
'
A
2
B
2
'
B
2
n
L
A
2
'
A
2
B
2
'
B
2
n
S
A
'
S
B
'
S
x
1
n
H
A
1
'
A
1
B
1
'
B
1
n
H
A
1
'
A
1
B
1
'
B
1
n
L
A
2
'
A
2
B
2
'
B
2
n
L
A
2
'
A
2
B
2
'
B
2
n
0
A
0
B
0
x
0
x
3
x
2
x
4
x
m
x
m+1
x
m-1
x
2N-4
x
2N-3
x
2N-2
x
2N
x
2N-1
Fig. 11. Diagram of multi-layer interference filters.
Optoelectronics - Materials and Techniques
40
We consider quarter-wave-stacks as a structure containing of N bi-layers of porous silicon
with periodic refractive indices that are coupled with a medium with refractive index n
0
at
the interface and a substrate with refractive index n
s
at the bottom. As can be seen form
Fig.11, the configuration of interference filter is a periodic structure of two porous silicon
layers (n
H
|n
L
). A(x) represents the amplitude of the right-traveling-wave and B(x) is that of
the left-traveling one and A(x) and B(x) are not continuous at the interfaces. The thickness of
each layer is h
m
, n
m
is the refractive index and Λ =h
m
+h
m+1
is a period of structure.
The dielectric structure is defined by (Saleh & Teich, 1997):
00
01
12
2
,
,
() ,
,
H
L
sN
nx x
nx xx
nx n x x x
nx x
<
⎧
⎪
<<
⎪
⎪
=<<
⎨
⎪
⎪
⎪
<
⎩
(2)
Where n
0
, n
s
are refractive indices of the incident medium (ambient) and of the substrate,
respectively. With this structure, we have n(x) = n(x+Λ). In general, for the m-th layer, the
refractive index is n
m
and thickness is d
m
in which d
m
=x
m+1
- x
m
(m=1:2N).
The electric field of a general plane-wave can be written as E=E(x) e
i (ωt-βz)
where E(x) is the
electric field distribution and can write as:
00 00
22
() ()
00 0
() ()
1
() ()
''
2
,
() ,
,
xx
mx m mx m
sx N sx N
ik xx ik xx
ik x x ik x x
mmmm
ik x x ik x x
ssN
Ae Be x x
Ex A e B e x x x
Ae Be x x
−− −
−− −
−
−− −
⎧
+<
⎪
⎪
=+ <<
⎨
⎪
+<
⎪
⎩
(3)
Where k
mx
is the x-component of the wave vector, k
mx
= ωn
m
cosθ
m
/c and θ
m
is the ray angle in
each layer. A
m
and B
m
are the amplitude of plane waves at interface x=x
m
.
If we write the two amplitudes of E(x) as a column vector, the plane waves at different
layers can be related by:
'
1
11
11
'
1
mm m
mmmm
mm
m
AA A
DDm DDP
BB
B
−
−−
−−
−
⎛⎞
⎛⎞ ⎛⎞
⎜⎟
==
⎜⎟ ⎜⎟
⎜⎟
⎝⎠ ⎝⎠
⎝⎠
, m=1, 2… 2N (4)
Where the dynamical matrices D
m
are written by:
11
cos cos
cos cos
mmmm
m
mm
mm
f
orTE wave
nn
D
forTM wave
nn
θθ
θθ
⎧
⎛⎞
⎪
⎜⎟
−
⎪
⎝⎠
=
⎨
⎛⎞
⎪
⎜⎟
⎪
−
⎝⎠
⎩
(5)
And the propagation matrix P
m
can be written by:
0
0
mx m
mx m
ik h
m
ik h
e
P
e
−
⎛⎞
⎜⎟
=
⎜⎟
⎝⎠
(6)
Silicon–Rich Silicon Oxide Thin Films Fabricated by Electro-Chemical Method
41
Thus the relation between A
0
, B
0
and
'
S
A and
'
S
B can be written as:
'
01112
111
0111222
'
02122
N
S
S
S
AMMA
DDPDDPD D
BMM
B
−−−
⎛⎞
⎛⎞ ⎛ ⎞
⎡⎤
⎜⎟
==
⎜⎟ ⎜ ⎟
⎣⎦
⎜⎟
⎝⎠ ⎝ ⎠
⎝⎠
(7)
From the matrix elements, we can calculate the reflectance and transmittance of
monochromatic plane waves through a multilayer structure. If the light is incident from
medium n
0
, the reflection and transmission coefficients can be calculated as:
0
0
0
0
0
S
S
B
S
B
B
r
A
A
t
A
=
=
⎛⎞
=
⎜⎟
⎜⎟
⎝⎠
⎛⎞
=
⎜⎟
⎜⎟
⎝⎠
(8)
Using the matrix equation (7), we have:
21
11
11
1
M
r
M
t
M
⎛⎞
=
⎜⎟
⎜⎟
⎝⎠
⎛⎞
=
⎜⎟
⎜⎟
⎝⎠
(9)
Then the reflectance is:
2
21
11
M
R
M
=
(10)
Where ambient with refractive index n
0
is lossless.
4.1.2 Simulation program
From the above-mention theory, we can set up a program for the simulation of multilayer
structure by using Matlab. This program contains the following parameters:
-
Refractive index of ambient is n
0
: the medium from which the incident wave arrives to
the surface of the first layer of multilayer structure.
-
Refractive index of substrate is n
s
: Substrate can be the silicon wafer or other medium.
-
Incident angle (θ): The angle between the propagation direction of the incident wave
and the normal to the surface of layers. This layer can vary from 0 to 90 degrees.
-
Number of bi-layer (N): number of periodic multilayer of interference filter.
-
Refractive indices (n
m
) and thickness (h
m
) of layers. They can be either n
H
, d
1
or n
L
, d
2
.
-
Wavelength range: the range from the initial to the final values of wavelength for
analyzing reflectivity spectra.
4.1.3 Results of simulation
The refractive index ratio n
H
/n
L
of the interference filter strongly influences on the width and
the sharpness of the filter wavelength band. Figure 12 shows the calculated reflection
spectra of three filters with 12 periods and the thickness of one layer was calculated to
obtain a centered reflection wavelength at 1550 nm. The calculated values of refractive
Optoelectronics - Materials and Techniques
42
indices in the range of 1.5 to 2.5 are often obtained from prepared porous silicon layers. We
surmised that the line-width and sharpness of the spectra are influenced by the ratio of
n
1
/n
2
and the increase of n
1
/n
2
leads to the spectral broadening.
1000 1200 1400 1600 1800 2000 2200 2400 2600
0
0.2
0.4
0.6
0.8
1
Reflection Spectrum of Multilayer
Wavelength (nm)
Reflectivity (%R)
(1) 2.0/1.5
(2) 2.3/1.5
(3) 2.5/1.5
(1)
(2)
(3)
Fig. 12. Reflection spectra of multilayer structures with different ratio of n
H
/ n
L
The influence of the number of periods (N) of multilayer structure on the reflection spectra
demonstrates in Figure 13. When N increases, the reflection spectra are sharper, narrower
and the reflectivity tends to unity. The simulation results can be used for design interference
filters based on both of PS and SRSO materials.
1000 1200 1400 1600 1800 2000 2200 2400 2600 2800 3000
0
0.2
0.4
0.6
0.8
1
Reflection Spectrum of Multilayer
Wavelength (nm)
Reflectivity (%R)
(1) N=4
(2) N=6
(3) N=8
(4) N=25
(1)
(2)
(3)
(4)
Fig. 13. Dependence of reflectivity upon period number of periods of multilayer structures
with ratio n
H
/n
L
of 2.5/1.5, corresponding to period numbers 4, 6, 8 and 25, respectively.
Silicon–Rich Silicon Oxide Thin Films Fabricated by Electro-Chemical Method
43
4.2 Fabrication of interference filters based on PS and SRSO multilayer
The porous silicon multilayer was fabricated using electrochemical etching of highly doped
p-type (100) silicon wafers with resistivity of 0.01- 0.1Ω.cm in 13%-20% hydrofluoric acid
(HF): ethanol solution. The electrochemical process was carried out without illumination.
The process was monitored by computer-controlled current source Autolab PGS-30, so
precise control over current density and etching time was maintained, thus resulting in
good control over the refractive index and thickness of the individual layers forming the
multilayer. The multilayer was formed by periodically varying the applied current density
between two levels (J
1
and J
2
) of 64 and 19 mA/cm
2
respectively, as presented in Figure 14.
The number of periods for each filter was from 6 to 18. The silicon pores and multilayer
structures of the filter were analyzed by Field-Emission Scanning Electron Microscopy (FE-
SEM). Figure 15 shows a FE-SEM-image of the completed porous silicon 12-period compose
fabricated by ratio of current densities J
1
/J
2
= 64/19 and duration time of 6.33 and 12.3
seconds, respectively. As seen in Figure 15a, the typical sizes of the silicon residuals and air
voids are about 50 nm. This allows us to describe the PS layers as "an effective medium",
whereby its optical properties mainly depend on its porosity. The SEM-image of the
multilayer displays different gray levels depending on the porosity of the layers (see Figure
15b). Because of this, the layers of the stack are distinguished and therefore the thickness of
each layer can be experimentally determined.
J
1
J
2
J
3
t
1
t
2
t
3
t
4
t
5
Current density
(mA/cm
2
)
Time(s)
Fig. 14. Schematic of current density modulation versus anodization time
(a) (b)
Fig. 15. Cross-sectional SEM images of silicon pores (a) and multilayer structure of the
interference filter with period number N=12 (b).