Volume 18 - Friction, Lubrication, and Wear Technology Part 2 ppsx
Bạn đang xem bản rút gọn của tài liệu. Xem và tải ngay bản đầy đủ của tài liệu tại đây (1.48 MB, 80 trang )
Fig. 16 Systems approach for analyzing friction and wear problems
In Fig. 16, important losses include vibration, elastic deflections, heating, surface alteration, galling, and even seizure.
Vibration as an output of a sliding system often indicates that stick-slip behavior is prevalent. Noise is often the result of
stick-slip behavior, but a system that exhibits such behavior does not necessarily emanate noise. Although vibration may
not be apparent on friction force traces, it may show up on deflection or displacement transducers. This type of behavior
from a sliding system is usually undesirable. Accurate measurement of vibration may require the use of accelerometers on
one of the members of the sliding system.
Likewise, elastic deflection, which can occur at a sliding interface, may not show up on the friction force recordings; this
deflection may mean that the couple under study has unacceptable frictional characteristics. For example, when several
elastomers that were undergoing friction tests were slid on a paper counterface, they bent over in the direction of motion;
the contact geometry was changed from the point contact of a hemispherical rider to a line contact of a bent
hemispherical-ended rod. The friction force was apparently high enough to cause this deflection.
Although heating is an obvious result of friction between sliding members, it is often not measured. The temperature rise
is often significant, and it is easy to measure. The mechanical properties of plastics are susceptible to degradation by
heating to relatively low temperatures. The temperature rise at a sliding interface is the result of the properties of the
materials in contact in addition to the sliding conditions. It will be different for different couples that may have the same
friction coefficient. Therefore, for sliding systems that may be affected by frictional heating of the interfaces, a valid
friction test should record the temperature rise.
Surface alteration is another important aspect of many wear and friction tests. Whenever wear occurs in a sliding test, the
friction coefficient is not that of the test couple alone, but it is the system that comprises the couple as well as wear debris
in the interface. When wear testing couples that are not supposed to wear during friction testing, it is important to
examine both surfaces for alterations. Damage often may be caused by polishing or scratching. When friction alters the
prevailing surface texture, a wear test has been performed, not a friction test. The friction force measured and the
coefficient of friction must be reported for a worn surface.
Galling and seizing are the worst possible results of a friction test. Galling is characterized by the formation of
microscopic cumulative material transfer during sliding, and seizure (stopping of motion) can be the net result. If a couple
seizes, there will be no friction coefficient to report, but merely the fact that the couple seized. If galling occurs, the
friction force will often decrease (Fig. 17), but the surfaces will be damaged. This can produce data that misleads a user,
who may think that the couple works fairly well because the friction coefficient was low, when actually galling occurred
and the material couple is not compatible.
Fig. 17 Typical friction coefficients derived from galling tests (various metal/metal couples)
Friction Databases
The first friction database was compiled by J.T. Desagulies around 1725 (as reported by Dowson in Ref 2). Desagulies
tabulated the friction coefficients for the couples of interest at the time. Current handbooks tabulate data for 50 or so
materials, with limited documentation regarding test conditions. These tabulations are of little use if the application
requires knowing a friction coefficient within an accuracy of ±0.2. Differences in the tribosystem used to make the
measurements can, for example, produce a result of 0.1 for a couple on device No. 1 and a result of 0.3 for the same
couple tested on device No. 2. It can be stated with a high degree of confidence that measuring techniques will have a
significant effect on the friction coefficient of a particular couple in the unlubricated condition. Differences may exist in
lubricated systems, but the coefficients will be much lower and an accuracy of ±20% results in a much smaller number.
For example, well-lubricated steel couples may have a kinetic coefficient of friction of 0.05 (±20% makes the number
0.04 to 0.06). In other words, existing friction databases have limited utility unless the test conditions used to develop the
data are stated and the application conditions are similar.
In order to determine how friction databases should be formulated and used, ASTM Committee G-2 on wear and erosion
began developing a standard format for friction databases in 1987. Although this work is ongoing, progress has been
made as to the type of data that should go into databases. The minimum results to be reported are:
• Test couple (member 1 and member 2)
• Static coefficient of friction
• Kinetic coefficient of friction
The minimum test condition information includes:
• Apparent pressure
• Normal force
• Velocity
• Temperatures (bulk) of samples
• Test atmosphere
• Lubricant
• Sliding distance (when was measured)
Other types of data would also be desirable, but even the ASTM-recommended list is difficult to deal with in database or
spreadsheet types of software. The strategy is to have these data in a database so that selective data can be tabulated (see
Table 3). The motivation for establishing friction databases is the elimination of repetitive tests. Even within a single
laboratory, it is not uncommon to see the same couples brought in for study several times over a period of several years.
Without a database, the tests are rerun each time. The long-range goal is to have published data that can be used by design
engineers in the same way that designers use corrosion data generated by countless sources over many years.
Table 3 Friction and wear data of selected plastics tested against polycarbonate containing 12%
polytetrafluoroethylene
Plastic
(a)
Kinetic
coefficient of
friction,
k
Specific wear rate
of selected plastic,
K × 10
-6(b)
PC
0.19 7.00
PC + PET
0.19 7.26
PCTG + 30% GF
0.36 9.00
PET + 30% GF
0.27 9.00
PET + 30% GF + mica
0.29 8.00
PC + 10% aramid
0.09 4.00
PA + 10% aramid
0.08 0.80
PA + 15% aramid + 10% TFE
0.07 0.50
LCP wear grade
0.10 2.00
LCP + mineral
0.07 0.60
PC + 40% aramid
0.18 9.00
PC/IPN + 2% aramid
0.15 2.00
PC + 20% aramid
0.20 7.00
(a)
PC, polycarbonate; PTFE, polytetrafluoroethylene; PET, polyethylene terephthalene; GF, glass fiber; PA, polyamide;
LCP, liquid crystal polymer; IPN, interpenetrating networks; TFE, tetrafluoroethylene.
(b)
Parameters: friction force, F, 9.86 N (2.20 lbf); velocity, V, 0.208 m/s (0.682 ft/s); sliding distance, D,
732.0 m (2402
ft)
References
1. A.Z. Szeri, Tribology: Friction, Lubrication and Wear, Hemisphere Publishing, 1980, p 2
2. D. Dowson, History of Tribology, Oxford University, 1979, p 22-23
3. K.C. Ludema, Friction, A Study in the Prevention of Seizure, ASTM Stand. News, May 1987, p 54-58
4. J.J. Bikerman, Polymer Friction, Plenum Press, 1974, p 149
5. F.B. Bowden and D. Tabor, The Friction and Lubrication of Solids, Clarendon Press, 1950
6. M.J. Neale, Ed., Tribology Handbook, John Wiley & Sons, 1973, p C-7
7. J.A. Schey, Tribology in Metalworking, American Society for Metals, 1983
8. D. Whitehouse, Friction and Surface Measurement, Surf. Topog., Vol 1, 1988, p 427-433
9. I.V. Kragelskii, The Nature of Polymer Friction, Polym. Mech., Vol 8 (No. 5), Sept 1972, p 699-707
10.
D. Tabor, Proc. R. Soc. (London) A, Vol 255, 1989, p 378
11.
I.V. Kragelskii, Friction and Wear, Butterworths, 1965
12.
K. Friedrich, Friction and Wear of Polymer Components, VDI-Verlag, 1989, p 14
13.
D.H. Buckley, Surface Effects in Adhesion, Friction, Wear and Lubrication,
Elsevier, Amsterdam, 1981, p
915
14.
"Standard Terminology Relating to Wear and Erosion," G 40, Annual Book of ASTM Standards, ASTM
15.
K.G. Budinski, Friction of Plastic Films, Wear of Materials 1989,
American Society of Mechanical
Engineers, 1989, p 459-468
16.
Y R. Jeng, Experimental Study on the Effects of Surface Roughness on Friction, Tribol. Trans.,
Vol 33
(No. 3), 1980, p 402-410
Friction during Metal Forming
Betzalel Avitzur, Metalforming Inc.
Introduction
FRICTION exists in any metal-forming process. Whenever two solid surfaces are in contact and relative motion, a
resistance (friction) to this motion arises. Friction is the last frontier in the study of metal forming. For example, in the
process of wire drawing, independent parameters such as reduction and die angle can be measured directly. Friction,
however, is not directly measurable, nor is it really an independent parameter. Yet in many metal-forming processes, the
effect of friction is as important as that of measurable independent parameters.
During wire drawing, a wire slides over the conical and cylindrical surfaces of a die (Fig. 1). If no lubricant is used, there
is direct metal-to-metal contact between the wire and the die. The pressures between the die and the wire are very high
(approximately equal to the flow strength,
0
of the wire). The relative motion, together with high pressure and high
friction resistance, results in the generation of heat. The relative movement of the mating surfaces causes them to be
damage by wear. Buildup of foreign matter over the surface of the die is also possible.
Fig. 1 Schematic of wire drawing or extrusion processes
No surface is geometrically perfect. Surfaces contain irregularities that form peaks and valleys. Thus, contact between the
die and the workpiece is maintained over limited portions of the apparent interface. The apparent area of contact is the
total area, but the actual area of contact is limited to that between the peaks of the opposing asperities (Fig. 2). If the
pressure (p) is defined as the total force (W) divided by the apparent cross-sectional area (A), the local pressure at the
points of contact can be much higher (Ref 1). The asperities flatten under the pressure, and the area of flattened asperities
adjusts itself to carry the load by plastic deformation of the asperities, even when the bulk of the workpiece is in the
elastic state.
Fig. 2 Schematic of surface irregularities
Surface irregularities and their behavior during sliding, together with the lubricant and surface chemistry, are key factors
in the characterization of friction and wear. Figure 3 illustrates some of the various modes of asperity deformation
behavior. The steady-state wave model, which is shown schematically in Fig. 3(b), is described in the Appendix to this
article. This model provides explicit expressions for the characterization of friction resistance as a function of pressure
(Fig. 4a), speed and Sommerfeld number (Fig. 4b), and surface geometry. Terms commonly used in metal-forming
operations are defined in Table 1.
Table 1 Nomenclature for friction in metal-forming processes
A Cross-sectional area
f%
Percent forward slip in strip rolling
0
Length of the asperity
L
Length of the bearing (land) of the die
m
Constant shear, or friction factor
p
Pressure
r%
Percent reduction in area
R
0
, R
f
Original and final radius of a wire
R
O
Radius of the roll in strip rolling
R
o
, R
i
, R
n
Outer, inner, and neutral radius, respectively, of a deforming ring
S
Sommerfeld number
t
0
, t
f
Original and final thickness of the strip
T
0
Thickness of a deforming ring
v
0
Sliding velocity
W
Total normal load
f
Friction power losses
i
Internal power of deformation
s
Shear or redundant power of deformation
Semicone angle of the die
1
Angle of inclination of the asperity (the wedge)
,
n
,
2
Angular positions, respectively, of: an arbitrary point; the neutral point; and the point of contact
Shear strain rate
Thickness of the film of lubricant
Viscosity
Coulomb's or Amonton's coefficient of friction
0
Flow strength
s
Shear stress in the liquid
xb
Extrusion pressure with its negative sign (that is,
xb
= -p); also back tension
xf
Drawing stress or front tension
Shear stress
T
0
Reduction in thickness
Fig. 3 Schematic of asperity deformation behavior
Fig. 4 Characterization of friction resistance as a function of (a) pressure, p, and (b) Sommerfeld number, S
Modeling of Friction
The difficulties in the determination of the friction value lie in the complexity of the phenomena (Fig. 4 and 5, and
Appendix ) and in the inability to accurately measure shear stresses. Therefore far-reaching approximations, as will be
described presently, are used to describe friction behavior during metal forming. These approximations deal with apparent
friction rather than with the fundamental phenomenon. One of the consequences of this approach is that friction must be
measured separately for each forming process. Under presumably identical conditions of surface finish and lubrication,
wire drawing will produce different friction values than strip rolling. As a result, when friction during rolling is to be
determined, the rolling process must be simulated. The same holds true for the other metal-forming processes.
Fig. 5 Relative drawing stress as a function of semicone angle and friction factor (m). See also Eq 4.
Standard practice in the study of metal forming is to assume that the resistance to sliding along the interface between the
tool and the workpiece is uniform along the entire contact surface. The most common simplifying assumptions made with
regard to friction stress ( ) between the workpiece and the tool involve Coulomb friction, constant friction, and
hydrodynamic-, hydrostatic-, and thick-film lubrication.
For Coulomb friction, it is assumed that the shear stress ( ) is proportional to the pressure (p) between workpiece and the
die. It follows then that:
= p
(Eq 1)
where the proportionality factor ( ) is called the Coulomb coefficient of friction.
For constant friction, it is assumed that the shear stress is proportional to the flow strength of the workpiece material, and
= m
0
/
(Eq 2)
where the proportionality factor (m) is called the shear (or friction) factor, with 0 m 1. The factors ( ) and (m) are
assumed constant for a given die, workpiece, and lubricant.
When a lubricant film separates the workpiece from contact with the die, hydrodynamic or hydrostatic film lubrication
prevails together with its special laws of shear within the lubricating medium. Sometimes high-viscosity lubricants adhere
to the workpiece, resulting in thick-film separation of the workpiece from the tool. Film lubrication may also separate the
workpiece from the die on the entry side to a smaller or larger extent. At the extreme, the entire workpiece is separated
from the die by this lubricant film. Under such conditions, the parameters or m are replaced by the viscosity of the
lubricant ( ), where stress in the liquid (
s
) is expressed as
=
s
=
(Eq 3)
where is the shear strain rate within the lubricant.
In the section of this article on "Measurement of Friction," the determination of friction is described for forging, wire
drawing, and strip rolling. For each of these processes, the apparent friction is determined experimentally through the
application of analytical solutions. The experimental data is treated by the mathematical expression of the relation
between the parameters that were measured and the sought friction. In each technique a minimal use of instrumentation is
required. All these assumptions for the characteristics of friction namely Coulomb's/Amonton's coefficient ( ), constant
factor (m), and film lubrication ( ) are treated. An iterative procedure can also be implemented when friction and
pressure depend on each other, are solved simultaneously, and their distributions along the contact surface are treated as
variables. Bay (Ref 2) gives such a treatment for the extrusion process.
Modeling of Flow through Conical Converging Dies
In the process of wire drawing, a wire is pulled through a converging die where its size is reduced from R
0
to R
f
(Fig. 1).
Passing through the die, the wire rubs against the conical and cylindrical surfaces of the die and encounters friction
resistance. The effect of friction on the drawing force and drawing stress during the fabrication of wire through conical
converging dies is discussed in Ref 3, 4, 5, 6, 7, 8, 9, 10, 11. The characteristics of the die and the flow patterns in Fig. 1
are common to wire drawing, open-die extrusion, and hydrostatic extrusion. A typical solution presented in Ref 12
expresses the relative drawing stress (
xf
/
0
) as a function of the input parameters, including the constant friction factor
(m), as follows:
(Eq 4)
where
xf
and
xb
are the front and back tensions, respectively, and where
is the contribution of the internal deformations,
is the shear or redundant power term,
is the friction term along the conical surface of the die, is the semicone angle of the die, and
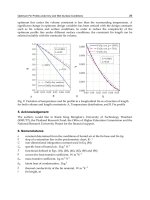
The characteristics of Eq 4 are presented in Fig. 5, where the semicone angle of the die ( ) is the abscissa and the relative
drawing stress the ordinate. Each curve in Fig. 5 demonstrates a minimum at some optimal angle. For angles smaller than
the optimal angle, friction losses (
f
) are excessive. Friction losses drop with increasing die angles, but redundant
power losses increase with increasing die angle. Beyond the optimal angle, excessive distortion occurs with increasing die
angles, and the drawing stress increases. The optimal die angle that minimizes the drawing stress is increasing with the
increase in reduction and friction. With higher friction it is advisable to use larger die angles.
More expressions have been derived for the determination of process limitations due to tearing, dead zone formation, and
shaving (Ref 12). When the phenomenon of central burst is analyzed, one finds that increasing friction deters central burst
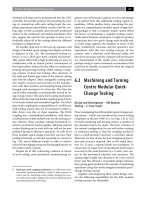
during extrusion, but promotes it during drawing (Fig. 6).
Fig. 6 Criteria for central burst in (a) drawing and (b) extrusion
Hydrodynamic Lubrication. The analysis of hydrodynamic lubrication by Hillier (Ref 4) offers a simple and
applicable treatment. This treatment, with a slight modification to account for variations in the thickness of the lubrication
film, is presented in Ref 12. The historical development and the state of the art in the application of hydrodynamic
lubrication to wire drawing are described in Ref 5 and 6.
In early studies of the equipment design for analysis of hydrodynamic lubrication (Ref 7, 8), a long tube with a narrow
gap between the tube and the wire was firmly attached at the entrance side of the die (Fig. 7). The lubrication adhered to
the wire and was dragged into the clearance between the tube and wire. At about 3 m/s (600 ft/min), the pressure that built
up at the approach to the die reached 70 to 275 MPa (10 to 40 ksi), and the liquid formed a film between the wire and the
die (Ref 7).
Fig. 7 Schematic of inlet tube for hydrodynamic lubrication
A method whereby the wire passes through a pressurized chamber (Fig. 8) has been studied by several investigators (Ref
9, 10, 11). Using this technique, the lubricating liquid is supplied to the chamber at high pressure by external means (Ref
13). The hydrodynamic effect does not depend entirely on the speed, viscosity, or chamber/tube length. With higher
pressure in the chamber, hydrodynamic lubrication can be accomplished with lower velocities and lower fluid viscosities.
Fig. 8 Schematic of wire drawing through a pressurized chamber
The introduction of hydrodynamic lubrication through a pressure box is shown in Fig. 9. The pressure chamber is inserted
into the soap bin of a conventional wire-drawing bull block. The bin preceding the entrance die to the chamber is filled
with powdered soap. The wire running through the powder supply drags powder into the chamber through the narrow gap
between the incoming wire and the approach die.
Fig. 9 Set-up for hydrodynamic lubrication with dry soap
When the wire is pulled through the soap, some soap is dragged into the chamber. In the small clearance gap, the soap
powder shears, heats because of this shear, and then melts. Liquid lubricating soap then enters the pressure chamber. The
faster the wire is drawn, the higher are the temperatures and pressures introduced in the chamber causing hydrodynamic
lubrication. A chemical bond between the wire and the molten soap is also produced. As soon as the wire exits the die, its
temperature drops and the soap freezes and forms a layer on the wire. There is now a layer of lubricant performing the
duties of hydrodynamic lubrication, that is, keeping full separation between the deforming wire and the next five or six
dies. The pressures produced in these chambers, without any external or auxiliary agent, are in excess of 275 MPa (40
ksi).
One difficulty associated with the use of a powdered-soap bin is in maintaining steady drag of powder into the chamber.
Inconsistencies in the particle size and dryness of the powder vary the effectiveness of its adhesion to the wire and the
quantity of powder dragged. At the extreme, a hollow channel in the powder surrounds the incoming wire and no soap is
dragged in. Greater uniformity of the powder and constant agitation (directly or through the box) may improve the
performance. Proper surface preparation also may be called for. A recent development utilizes the conventional powder
spray system with electrostatically charged particles.
With phosphating, the most popular method, a predetermined layer of a spongy phosphate coating is applied to the
surface of the wire electrolytically. This sponge can absorb and retain a large volume of lubrication liquid. Even without
the lubricant, the phosphate sponge provides an effective separation between the die and the workpiece, thereby
minimizing friction and wear.
The average shear stress and the thickness of the lubricant (Eq 9.19 of Ref 12) are:
(Eq 5a)
and
(Eq 5b)
When the dimensionless factor v
f
/(R
f 0
) (called the Sommerfeld number) increases from zero, both the relative average
shear stress ( /
0
) and the relative thickness of the lubricant ( /R
f
) increase. For small values of the Sommerfeld number,
the expected thickness of the lubricant is lower than the surface roughness of the material and the die, and hydrodynamic
lubrication does not prevail. Therefore, for small values of v
f
/(R
f 0
), the actual friction is much higher than that
predicted by Eq 5a and 5b (see the Appendix to this article for additional information).
On portions of the apparent contact area, there is actually clearance between the workpiece and the die (Fig. 10). When
lubrication is provided, some lubricant is dragged between the two surfaces by the moving workpiece. As the value of
v
f
/(R
f 0
) increases, more of the voids between the surfaces are filled with lubricant. In addition, more of the pressure load
on the workpiece is transmitted through the lubricant, and less load acts to smooth the asperities on th workpiece.
Subsequently there is less actual metal-to-metal contact and friction drops. At a sufficiently high value of v
f
/(R
f 0
) or
beyond this critical value, enough lubricant is dragged into the interface to cause complete separation of the two bodies.
No metal-to-metal contact occurs, and full hydrodynamic lubrication with low friction exists. A further increase in
v
f
/(R
f 0
) will cause a monotonic increase in the friction value and in the thickness of the lubrication layer.
Fig. 10 Effect of Sommerfeld number on relative shear stress, friction, and lubrication characteristics
The onset of hydrodynamic lubrication is distinctly observable. Nevertheless, even when hydrodynamic lubrication
prevails, a few occasional high spots on the workpiece will contact the die.
If one assumes an arbitrary value for the film thickness ( /R
f
)
cr
at the exit as the critical onset value at which
hydrodynamic lubrication commences, then by Eq 5aand 5b, the critical Sommerfeld number for the onset of
hydrodynamic lubrication is:
(Eq 6)
from which the critical speed is readily determined. The critical Sommerfeld number decreases with an increase in the
bearing length (L/R
f
) or with a decrease in the die angle ( ) or in the critical film thickness ( /R
f
)
cr
.
More detailed information on the phenomenon of hydrodynamic lubrication during flow through converging dies can be
found in Ref 14.
Modeling of Strip Rolling
The following description of rolling is given in Ref 14:
The main purpose of
strip rolling, where the width of the strip is much greater than its thickness,
is to reduce the latter. In the following discussions, both rolls have the same radius R
O
and
surface conditions, are equally powered, and run at the same velocity. They trans
fer energy to
the strip through the friction between the two bodies [Fig. 11
]. Under regular conditions, the
strip mov
es slower than the roll at the entrance and faster than the roll at the exit, with a neutral
point in between at which both speeds are equal. The friction force acting between the entrance
and the neutral point advances the strip between the rolls, while t
he friction acting on the exit
side from the neutral point opposes the rolling action.
Fig. 11 Positive and negative friction directions during strip rolling
As reduction increases, the position of the neutral point approaches the exit. When the maximum possible reduction is
attempted, the neutral point reaches the exit. This situation is very unstable. Any slight increase in reduction or drop in
friction will cause the strip to stop moving and the rolls to start skidding over the strip. The distribution of the pressure
between the rolls and the strip is described by the "friction hill" in Fig. 11. The peak of the friction hill occurs at the
neutral point.
Hydrodynamic Lubrication. Lubricant is applied at the entrance side of each pair of rolls (stand). At the entrance
side, the layers of lubricant that are in contact with the rolls or with the strip adhere to their respective metal surfaces and
move inward toward the exit. An inlet entry zone, which is shaped as a wedge, also forms. The outer layers of this wedge
move inward and a return flow of lubricant (in the form of an eddy current) occurs between the surface layers (Fig. 12a).
At low rolling speeds, the entry zone wedge is negligibly small. With increasing rolling speeds (or increasing liquid
viscosity or increasing values of the Sommerfeld number) the wedge increases both in thickness and depth. The
Sommerfeld number is:
(Eq 7)
With increasing values of S, the point where metal-to-metal contact between the strip and the rolls is established moves
further toward the exit.
Fig. 12 The lubrication entry zone (a) and surface irregularities (b) associated with strip rolling
The surfaces of both rolls and strip are not perfectly smooth surfaces in that they contain irregularities in the form of
peaks (or crests) and valleys (cavities) (Fig. 12b). Some lubricant passes from the entrance to exit side through the
labyrinth of channels created by these irregularities. As the strip is deformed, the crests are flattened and the entrapped
lubricant is pressurized in the diminishing volume of the cavities. At slow rolling speeds, the excess lubricant in the
diminishing cavity space is squeezed to flow back into the entry zone. At higher rolling speed, the escape of excess fluid
from the diminishing gap of the labyrinth between the rolls and the strip is relatively slower. The entrapped lubricant is
then pressurized and causes partial separation between the rolls and the strip. At low speed, pressure is transmitted from
the rolls to the strip through metal-to-metal contact. At higher speeds, more of the pressure is transmitted through the
entry zone and through the entrapped lubricant. As the pressure transmitted through metal-to-metal contact is reduced
with higher speeds, the friction is decreased. Eventually, at high speeds, no metal-to-metal contact exists.
When conditions for complete hydrodynamic lubrication are reached (Fig. 13), friction is at its minimum value.
Therefore, with increased speeds, high shear rates are created in the liquid where the shears stress is proportional to the
shear strain rate to the second power, and friction rises at a mild rate. Friction values are much lower when hydrodynamic
lubrication prevails than when metal-to-metal contact is prevalent.
Fig. 13 Hydrodynamic lubrication during strip rolling. (a) Overall schematic. (b) Shear in the lubricant film
With increasing speed the friction hill effect is also reduced, and roll separation force and roll flattening become less
pronounced. With reduced roll separation force, the elastic stretching of the mill as well as roll bending and roll flattening
are reduced, causing the gap between the rolls to decrease. With the increasing thickness of the lubricant film and reduced
mill flexing, the thickness of the emerging strip reduces. The actual gap between the rolls is larger than the thickness of
the strip by twice the film thickness. Because friction drag decreases with increasing rolling speed, the neutral point
approaches the exit and forward slip is reduced.
Two critical points may now be reached. The first is skidding due to insufficient friction drag while the second is the
establishment of hydrodynamic lubrication. If the strip is thin enough, hydrodynamic lubrication is reached first and
skidding will not develop. When speed continues to increase after hydrodynamic film lubrication is established, friction
drag and forward slip, which have already reached their respective minimum points, begin to increase (see lines 1 to 4 in
Fig. 14). For increasing values of strip thickness (lines 2, 3, and 4 in Fig. 14), the forward slip decreases and the critical
value of roll speed at which the neutral angle and forward slip reach a minimum is increased. The values of the neutral
angle and forward slip at which hydrodynamic lubrication begins increase with increasing thickness values.
Fig. 14 Forward slip and position of the neutral point versus rolling velocity.
See text for explanation of
numbered curves.
At a critically high strip-thickness value, hydrodynamic lubrication commences when forward slip and the value of the
neutral angle are zero (line 4 in Fig. 14). When the thickness of the strip is above the stated critical value, for lines 5 to 7,
friction drops to below the minimum required for rolling before hydrodynamic lubrication can be established. Skidding
then commences at the critical roll speed. It can be observed that at higher values of speed, referred to here as the
minimum required speed, rolling with hydrodynamic lubrication may be reestablished. It should also be noted that the
minimum required speed can be reduced by the use of lubricants of higher viscosity.
The following variations in the friction hill are expected with increasing speed:
• The peak of the friction hill gets lower and, together with the neutral point, shifts closer to the exit
•
The entry zone expands and the corner of the liquid wedge moves further away from the entrance and
closer to the exit. The meaningful slope of the friction hill on the
entrance side starts at the area around
the tip of the entry zone
• The roll separation force gets lower
• Roll bending/flattening and mill stretching are reduced
• Strip thickness is reduced
• For relatively thick strip (or low dry-friction value, m
o
), a cri
tical roll speed of the first kind may be
reached. When this occurs, friction becomes so low (below the critical value required) that the neutral
point is at the exit and skidding will commence (lines 5 and 6).
At the moment that skidding begins, the
strip stops
•
For relatively thin strip another critical speed (the critical speed of the second kind) can be reached,
even before skidding commences. When this occurs, the point of the entry zone will reach the exit and
hydrodynamic lubrication will commence. A
further increase in speed will cause a thicker lubricating
film to separate the rolls from the strip and make the rolling more stable (see lines 1, 2, and 3 in Fig. 14)
•
For relatively thick strip, even when a critical speed of the first kind commences first, a further increase
in speed may ultimately produce a critical speed of the second kind and reestablish hydrodynam
ic
lubrication (see lines 4 to 7 in Fig. 14)
Changes in the entry zone, the friction hill, the neutral point, and strip thickness as a function of speed for thick and thin
strip are shown schematically in Fig. 15.
Fig. 15 Variations in the "friction hill" versus speed. The parameters m, R
O
,
xb
,
xf
, and percent reduction are
constant.
Measurement of Friction
Ring Forging. Figure 16 shows the deformation characteristics of two identical rings reduced in height incrementally by
the same amount ( T
0
). One ring is lubricated well and is pressed with low friction, while the unlubricated ring is
pressed with high friction. The characteristic behavior is drastically different in the two cases. In the low-friction
operation, the inner radius (R
i
) of the ring increases in size, while in the high-friction operation, the inner radius of the
ring decreases in size.
Fig. 16 Deformation behavior during ring forging. (a) Original ring. (b) After deformation with low friction.
(c)
After deformation with high friction
The bulge direction changes accordingly, minimizing relative sliding of the workpiece over the platens. The outer radius
(R
o
) expands in both cases.
In describing the flow pattern, consider an imaginary cylinder of radius R = R
n
, where R
n
is the neutral radius. In the high-
friction ring, all points with radius R > R
n
move outward and their radial positions increase while all points with radial
position R < R
n
are moving inward. Points on the radius R = R
n
are stationary, and hence this radius is called the neutral
radius. In the high-friction ring of Fig. 16, the neutral radius resides in the ring itself, so that the neutral radius is larger
than the inner radius (R
n
> R
i
). On the low-friction ring, the neutral radius is smaller than the inner radius. Therefore, all
points on the low-friction ring are in a radial position R > R
n
. The increase in outer radius for higher friction is smaller
than that for low friction.
When R
n
R
i
, the position of the neutral radius (R
n
) can be determined as follows (Ref 15):
(Eq 8a)
When R
i
R
n
R
o
the position of the neutral radius is found by successive approximations from:
(Eq 8b)
When a ring is forged and all the geometrical parameters, including the value of R
n
, are determined experimentally, then
the friction factor m is calculated, using Eq 8a and 8b. References 16, 17, 18, 19, 20, 21, 22, 23, 24, 25 provide additional
information on ring test friction analysis, as follows:
• Analysis. Slug or slab free body equilibrium approach: M. Kunogi (Ref 16
), 1956. Upper bound, the
parallel velocity field: I. Tarnovski et al. (Ref 17), 1959; H. Kudo (Ref 18), 1961; B. Avitzur (Ref 29
),
1964. Upper bound with bulge: B. Avitzur (Ref 19
), 1969. Limit analysis (that is, upper and lower
bounds): B. Avitzur and F.R. Sauerwine (Ref 20, 21), 1978
• Experimental. Use of feeler pins in disk forging: G.T. Van Rooyen and W.A. Backofen (Ref 22
), 1960.
Calibration curves: A.T. Male and M.G. Cockroft (Ref 23), 1964
• Combined. Analytically supported calibration curves: A.T. Male et al. (Ref 24, 25), 1970
Flow through Conical Converging Dies. Equation 4 and Fig. 5 show that during flow through conical converging
dies, the forces required are dependent on the die cone angle. There always exists an optimal cone angle that requires the
minimum force. With a cone angle smaller than the optimal cone angle, the drawing or extrusion force is high because the
length of contact between the die and material is high, causing excessive friction losses. With a die of an angle larger than
the optimal, the distortion is excessive, causing high forces.
When Eq 4 is differentiated with respect to and the derivative is equated to zero, the resulting equations express
implicitly the relation between the semicone angle of the die, which minimizes the drawing or extrusion stresses and the
other variables.
Experimentally the optimal die angle can be determined by following the procedure offered by Wistreich (Ref 26).
Several dies of identical exit diameter are used, each of different entry cone angle. Rods of identical material, treatment,
diameter, surface condition, and lubrication are formed through the dies. The forming force (or pressure) is measured. A
plot (Fig. 5) of the drawing or extrusion stress is obtained as a function of cone angle, assuming that reduction, friction,
and flow stress are all constant. The point of minimum stress indicates on the abscissa the value of the optimal die angle
(
opt
) for the experienced reduction and friction. When a second batch of rods of different initial diameter is drawn (or
extruded), different values for the optimal die angle are obtained. The friction that prevails during each run of the
experiment can be computed as follows:
(Eq 9)
Strip Rolling. Avitzur (Ref 27, 28, 29) has developed an experimental procedure for the determination of the coefficient
of friction during strip rolling. The expressions derived for these studies can be used to determine friction values when
skidding commences.
With the assumption of a constant shear factor (see Eq 2 in this article), Eq 22 from Ref 29 reads:
(Eq 10)
where
When skidding occurs, the following have to be measured: relative front
xf
/(2
0
/ ) and back
xb
/(2
0
/ )
tensions, roll radius (R
O
), and incoming (t
0
) and emerging (t
f
) strip thicknesses. The value of friction is computed then by
Eq 10. When no front or back tensions are applied, skidding can be induced only with small roll diameter. When
xf
=
xb
= 0, Eq 10 reduces to:
(Eq 11)
When
xf
=
xb
= 0, only the geometrical parameters t
0
, t
f
, and R
O
have to be measured and a rolling mill with no
instrumentation can be used for the evaluation of the coefficient of friction.
When
xf
=
xb
= 0 and skidding occurs, the following relation is proposed:
2
= 2
(Eq 12)
where
2
is the contact angle. By replacing
2
by strip thickness and roll radius, the following is written:
= ( ) ·
(Eq 13)
In a study detailed in Ref 27, strips of identical thickness were rolled with varying gaps between the rolls. The strip was
pushed between the rolls to start the operation. If the full length of the strip passed the rolls, the gap was narrowed and
another strip fed in. This procedure went on until skidding started. When skidding started, the original and final thickness
of that strip and the radius of the rolls were recorded. Another batch of strips with smaller original thickness, but the same
annealed and surface conditions, was then rolled with the same lubricant. The previous procedure was repeated until
skidding started. Several batches of various original strip thickness were tested. The friction values were computed using
Eq 11 for each batch.
Appendix: The Wave Model
The model presented in Ref 30 has provided a quantitative description of Coulomb's (Ref 31) and Amonton's (Ref 32)
characterizations of friction for moderate loads. This model is based on the "wave model" concept of the mobility of the
asperities.
In his History of Tribology (Ref 33), Dowson explains the early recognition of the cause-and-effect relationships between
surface irregularities and the resistance to sliding. Dowson summarizes Coulomb's ideas on the combined effects of the
then-prevailing thoughts on cohesion and surface irregularities. Coulomb recognized that irregularities caused resistance
to sliding, and sketched the opposing asperities as enmeshed fibers folding over and filling the voids previously occupied
by opposing surfaces as sliding takes place. However, as Dowson points out, the energy dissipation was not then
recognized because the science of thermodynamics had not yet been born. The theory of folding asperities would later be
replaced by the concept of the mobile ridge.
Leslie observed that asperities on the harder surface (called "wedges" here) push on the opposing ridges of the softer
surface. Unlike the popular theory of those days that a climbing motion occurred, ignoring the inevitable downhill
companion motion, Leslie suggested that the softer ridge was pushed into and under the surface, producing a perpetual
uprising ahead of the wedge of the harder surface and resulting in an endless climb (Ref 34). Evidence for the mobility
can be seen in Fig. 17, which is reproduced from Ref 35. Simulations of plastic deformation of the asperities by the slip
line and the upper bound techniques are presented in Ref 36, 37, 38, 39, 40, 41, 42, 43, 44, 45, 46, 47, 48, 49.
Fig. 17 Photomicrograph showing the mobility of asperities and the thin layer of deformations. Source: Ref 35
Presently, the model of the mobile ridge and the trapped lubricant on the interface between two sliding surfaces is
examined quantitatively to provide the characteristics shown in Fig. 4(a) and of the Stribeck curve (Ref 50) shown in Fig.
4(b). To model the interaction between the asperities, the photomicrograph shown in Fig. 17 can be replaced by the
illustration of wedge flow in Fig. 18. The tip of the wedge on the surface of the die indents into the surface of the
workpiece, producing a ridge. Sliding between the two surfaces is made possible by the ridge being suppressed under the
wedge when it passes under it. The material ahead of the contact is pushed upward, and the ridge experiences a wave
motion. The lubricant trapped between the stationary wedge and the moving ridge is being forced to move with the solid
that it contacts, and thus experiences an eddy flow. Figure 19 shows theengineering model for the flow depicted in Fig.
18. Here the deformation region of the ridge is described by three rigid triangles, each moving with respect to each other,
through a sliding motion along their interfaces. In Ref 45, the triangles move in a linear motion, while in later studies (Ref
47), they move in the more general rigid-body motion (rotational motion).