MEDICAL STATISTICS - PART 2 pptx
Bạn đang xem bản rút gọn của tài liệu. Xem và tải ngay bản đầy đủ của tài liệu tại đây (746.9 KB, 26 trang )
Barthel index: A quality-of-life variable used to assess the ability of a patient to
perform daily activities such as feeding, bathing, dressing, etc. Can be used to
determine a baseline level of functioning and to monitor improvements in
activities of daily living over time. A score of zero corresponds to complete
dependence on others, and a score of ten implies that the patient can perform all
usual daily activities without assistance. See also activities of daily living scale and
U-shaped distribution.[International Disability Study, 1988, 10, 61–3.]
Bartlett’s test: A test for the equality of the variances of more than two populations. Very
sensitive to non-normality, so that a significant result might be interpreted as an
indication of the non-equality of the population variances when in reality it is due
to the non-normality of the observations. See also Box’s test and Hartley’s test.
Bartlett’s test: Do not take the results of this test too seriously.
Baseline balance: A term used to describe, in some sense, the equality of the observed
baseline characteristics among the groups in, say, a
clinical trial.
Conventional practice dictates that before proceeding to assess the treatment effects
from the clinical outcomes, the groups must be shown to be comparable in terms
of these baseline measurements and observations, usually by carrying out
appropriate significant tests. Such tests are criticized frequently by statisticians, who
usually prefer important prognostic variables to be identified before the trial and
then used in an
analysis of covariance. [Senn, S., 1997, Statistical Issues in
Drug Development, J. Wiley & Sons, Chichester.]
Baseline balance: Avoid the foolish but common use of baseline measurements to check that the
groups in a randomized clinical trial are ‘balanced’.
Baseline characteristics: Observations and measurements collected on subjects or
patients at the time of entry into a study before undergoing any treatment, for
example, sex, age and weight.
Basic reproduction number: A term used in the theory of infectious diseases for the
number of secondary cases that one case would produce in a completely susceptible
population. The number depends on the duration of the infectious period, the
probability of infecting a susceptible individual during one contact, and the
number of new susceptible individuals contacted per unit time, with the
consequences that it may vary considerably for different infectious diseases and also
for the same disease in different populations. When the basic reproduction number
is less than one, the infection will die out, but if it is greater than one then the
disease will spread exponentially causing a large epidemic. If the basic reproduction
number equals one, then the infection will become endemic in the population. The
larger the value of the basic reproduction number, the larger the fraction of the
20
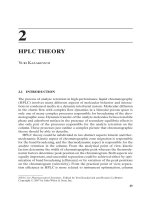
Figure 5 Bathtub hazard for death in human beings.
population that must be immunized to prevent an epidemic. For AIDS, for
example, the basic reproduction number is between 2 and 5, and for measles
between 16 and 18. [Southeast Asian Journal of Tropical Medicine and Public Health,
2001, 32, 702–6.]
Bathtub hazard: The shape taken by the
hazard function for the event of death in
human beings; it is relatively high during the first year of life, decreases fairly soon
to a minimum, and begins to climb again some time around age 45–50. Such a
curve is shown in Figure 5.
Battery reduction: A general term for reducing the number of variables of interest in a
study for the purposes of analysis and perhaps later data collection. For example, an
overly long questionnaire may not yield accurate answers to all questions, and its
size may need to be reduced. Techniques such as
factor analysis and
principal component analysis are generally used to achieve the required
reduction.
Bayesian confidence interval: Anintervalofa
posterior distribution that is
such that the density at any point inside the interval is greater than the density at
any point outside and that the area under the curve for that interval is equal to a
prespecified probability level. For any probability level, there is generally only one
such interval, which is also known as the highest posterior density region. Unlike the
usual
confidence interval associated with frequentist inference,
here the intervals specify the range within which the parameters lie with a certain
probability. [Berry, D. A. and Stangl, D. K., 1996, Bayesian Biostatistics, Marcel
Dekker, New York.]
Bayesian methods: An approach to inference based on
Bayes' theorem,inwhich
prior knowledge in the form of a specified probability distribution for the
unknown parameters (the
prior distribution) is updated in the light of the
observed data to give a revised probability distribution for the parameters (the
posterior distribution). This form of inference differs from the classical
form of
frequentist inference in several respects, particularly in the use of
21
h
(
t
)
0
t
a prior probability distribution for the parameters; this is absent from classical
inference. The prior distribution represents the investigator’s knowledge before
collecting the data. [Annual Review of Public Health, 1995, 16, 23–41.]
Bayesian persuasion probabilities: A term for particular
posterior
distributions
used to judge whether a new therapy is superior to the standard
as derived from the
prior distributions of two hypothetical experts, one of
whom believes that the new therapy is highly effective and another who believes
that it is no more effective than other treatments. The persuade-the-pessimist
probability is the posterior probability that the new therapy is an improvement on
the standard assuming the sceptical expert’s prior, and the persuade-the-optimist
probability is the posterior probability that the new therapy gives no advantage over
the standard assuming the enthusiast’s prior. Large values of these probabilities
should persuade the a priori most opinionated parties to change their views.
[Statistics in Medicine, 1997, 16, 1792–802.]
Bayes’ theorem: A procedure for revising and updating the probability of some event in
the light of new evidence. For example, an estimate of the probability that a woman
has breast cancer will change if she is tested positive on a mammograph. The
theorem originates in an essay by the Reverend Thomas Bayes. See also
conditional probability, positive predictive value and negative predictive
value.
Begg’s test: A test for
funnel plot asymmetry based on the size of the rank
correlation coefficient
between the effect size estimates and their
sampling variances. See also Egger’s test.[Nephrology, Dialysis and Transplantation,
2004, 19, 2747–53.]
Behrens–Fisher problem: The problem of testing for the equality of the means of two
normal distributions that do not have the same variance. Various
test
statistics
have been proposed but none is completely satisfactory. See also
Student’s t-test.[Computer Methods and Programs in Biomedicine, 2003, 70,
259–63.]
Believe the negative rule: See believe the positive rule.
Believe the positive rule: A rule for combining two diagnostic tests, A and B,inwhich
‘disease present’ is the diagnosis given if either A or B or both are positive. An
alternative, believe the negative rule, assigns a patient to the disease class only if both
A and B are positive. These rules do not necessarily have better
positive
predictive values
than a single test; whether they do depends on the
association between test outcomes. [Infusionstherapie und Transfusionsmedizin,
1995, 22, 175–85.]
Bellman–Harris process: A
branching process evolving from an initial
individual in which each individual lives for a random length of time and at
the end of its life produces a random number of offspring of the same type.
[Jagers, P., 1975, Branching Processes with Biological Applications,J.Wiley&Sons,
Chichester.]
22
Bell-shaped distribution: A probability distribution having the overall shape of a
vertical cross-section of a bell. The normal distribution is the most well-known
example, but
Student's t-distribution is also this shape.
Benchmark dose: A term used in risk assessment studies where human, animal or
ecological data are used to set safe low dose levels of a toxic agent, for the dose that
is associated with a particular level of risk. [Applied Statistics, 2005, 54, 245–58.]
Benchmarking: A procedure for adjusting a less reliable series of observations to make it
consistent with more reliable measurements or benchmarks. For example, data on
hospital bed occupation collected monthly will not necessarily agree with figures
collected annually, and the monthly figures (which are likely to be less reliable) may
be adjusted at some point to agree with the more reliable annual figures.
[International Statistical Review, 1994, 62, 365–77.]
Benchmarks: See benchmarking.
Benefit–cost ratio: The ratio of net present value of measurable benefits to cost. Used to
determine the economic feasibility of success of a health intervention programme.
Berkson’s bias: Synonym for Berkson’s fallacy.
Berkson’s fallacy: The existence of artefactual associations between two medical
conditions, or between a disease and a risk factor, arising from the interplay of
differential admission rates with respect to the suspected causal factor. First
described in 1946 by Joseph Berkson, a physician in the Division of Biometry and
Medical Statistics at the Mayo Clinic. A classic example is a study of autopsies in
which fewer autopsies than expected find both tuberculosis and cancer to occur
together apparently implying that the frequency of cancer is lower among
tuberculosis victims. But any conclusion that we may infer from this that
tuberculosis is protective against cancer is erroneous, simply because not every
death is autopsied. Here perhaps people who die with both diseases are less likely to
have been autopsied, leading to an artificially low number of autopsies with both
diseases. [Everitt, B. S. and Palmer, C., eds., 2005, Encyclopedic Companion to
Medical Statistics, Arnold, London.] See also Simpson’s paradox.
Berkson’s fallacy: Be on the lookout for associations generated by differential admission rates; it is
not possible to correct for these during analysis.
Berkson’s paradox: Synonym for Berkson’s fallacy.
Bernoulli sequence: Asetofn independent binary variables with the probability of, say,
the ‘one’ category being the same for all trials.
Best linear unbiased estimator (BLUE): A
linear estimator of a parameter
that has smaller variance than any similar estimator of the parameter.
Beta coefficient: A regression coefficient that is standardized so as to allow for a direct
comparison between explanatory variables as to their relative power for predicting
the response variable. Calculated from the raw regression coefficients by
23
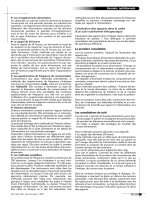
Figure 6 Beta distribution for a number of different sets of parameters.
multiplying them by the standard deviation of the corresponding explanatory
variable. [Lewis-Beck, M. S., 1993, Regression Analysis, Volume 2, Sage
Publications, London.]
Beta distribution: A probability distribution, the shape of which depends on the values
of two parameters. Can vary from a
U-shaped distribution to a J-shaped
distribution
. Some examples are shown in Figure 6. [Evans, M., Hastings, N.
and Peacock, B., 2000, Statistical Distributions, 3rd edn, J. Wiley & Sons, New York.]
Beta error: Synonym for type II error.
Beta-geometric distribution: A probability distribution arising from assuming that
the parameter of a
geometric distribution has a beta distribution.
The distribution has been used to model the number of menstrual cycles required
to achieve pregnancy. [Statistics in Medicine, 1993, 12, 867–80.]
Between-groups sum of squares: See analysis of variance.
24
Bias: Deviation of results or inferences from the truth, or processes leading to such
deviation. More specifically, the extent to which the statistical method used in a
study does not estimate the quantity thought to be estimated, or does not test the
hypothesis to be tested. See also ascertainment bias, recall bias, selection bias and
biased estimator.
Biased coin method: A method of random allocation sometimes used in a
clinical
trial
in an attempt to avoid major inequalities in numbers of subjects allocated
to the different treatments. At each point in the trial, the treatment with the fewest
number of subjects thus far is assigned a probability greater than a half of being
allocated the next subject. If the treatments have an equal number of subjects at any
stage, then simple randomization is used to allocate the next subject. [Statistics in
Medicine, 1986, 5, 211–30.]
Biased estimator: An estimator of a parameter whose expected or average value is not
equal to the true value of the parameter. The reason for sometimes using such
estimators rather than those that are unbiased rests in their potential for leading to
a value that is closer, on average, to the parameter being estimated than would be
obtained from the latter. This is so because it is possible for the variance of such an
estimator to be sufficiently smaller than the variance of one that is unbiased to
more than compensate for the
bias introduced. [Rawlings, J. O., Pantula, S. G.
and Dickey, D. A., 1998, Applied Regression Analysis: A Research Tool, Springer, New
York.]
Biased estimator: Not always a disaster.
Big Mac index: An index that attempts to measure different aspects of the economy by
comparing the cost of hamburgers between countries. [Measurement Theory and
Practice, 2004, D. J. Hand, Arnold, London.]
Bimodal distribution: A probability distribution, or a frequency distribution, with two
modes. Figure 7 shows an example of each.
Bimodal distribution: Such distributions can be modelled using finite mixtures.
Binary sequence: A sequence whose elements take one of only two possible values,
usually denoted 0 or 1. See also Bernoulli sequence and binomial distribution.
Binary variable: Observations that occur in one of two possible states, these often being
labelled 0 and 1. Such data are encountered frequently in medical investigations;
commonly occurring examples include dead/alive, improved/not improved and
depressed/not depressed. Data involving this type of variable often require
specialized techniques such as
logistic regression for their analysis. See
also Bernoulli sequence.
25
Figure 7 Bimodal probability and frequency distributions.
Binomial distribution: The probability distribution of the number of occurrences of a
binary event in a series of n independent trials in which the probability of the
occurrence of the event remains fixed at some value p. The mean of the distribution
is np and the variance is np(1 − p). A number of binomial distributions are
displayed in Figure 8. [Evans, M., Hastings, N. and Peacock, B., 2000, Statistical
Distributions, 3rd edn, J. Wiley & Sons, New York.]
Bioassay: The process of evaluating the potency of a stimulus by analysing the response it
produces in biological organisms. Examples of a stimulus in this context are a
drug, a hormone, radiation and an environmental effect. See also probit
analysis. [Finney, D. J., 1978, Statistical Methods in Biological Assay, 3rd edn,
Arnold, London.]
Bioavailability: The study of variables that influence and determine the amount of
active drug that gets from the administered dose to the site of pharmacological
action, as well as the rate at which it gets there. The extent and rate of absorption
determine the bioavailability of a drug. [Chow, S. C. and Liu, J. P., 1992, Design
and Analysis of Bioavailability and Bioequivalence Studies,MarcelDekker,New
York.]
Bioequivalence: The degree to which the absorption characteristics of two drugs are
similar. [Chow, S. C. and Liu, J. P., 1992, Design and Analysis of Bioavailability and
Bioequivalence Studies, Marcel Dekker, New York.]
Bioequivalence trials:
Clinical trials carried out to compare two or more
formulations of a drug containing the same active ingredient in order to determine
whether the different formulations give rise to comparable blood levels. [Chow,
S. C. and Liu, J. P., 1992, Design and Analysis of Bioavailability and Bioequivalence
Studies, Marcel Dekker, New York.]
26
−4 −20
0.0 0.10
y
0.20
0 2 4 6 8 10 14 16 x
0.10
0.05
Relative frequency
0.15
2
x
468
Figure 8 A number of binomial distributions.
Bioinformatics: A discipline of computational biology that encompasses mathematics,
statistics, physics and chemistry, and has as its aims exploring models for biological
systems and creating tools which biologists can use to analyse data, for example, to
assess the similarity between two or more DNA sequences. [Nature Genetic
Supplement, 2003, 33, 305–10.]
Biological assay: Synonym for bioassay.
Biological efficacy: The effect of treatment for all people who receive the therapeutic
agent to which they were assigned. Measures the biological action of treatment
among compliant people. [European Respiratory Journal, 2003, 22, 575–675.]
Biological marker (biomarker): A characteristic that is objectively measured and
evaluated as an indicator of normal biological processes, pathogenic processes or
pharmacologic responses to a therapeutic intervention. Use of biomarkers may
help to predict and monitor the clinical response to an intervention and they are
often used as
surrogate endpoints when measuring the clinical
endpoint of interest is difficult. [Pharmacoepidemiology and Drug Safety, 2001, 10,
497–508.]
Biometry: The application of statistical methods to the study of numerical data based on
observation of biological phenomena.
Biostatistics: Strictly the branch of science that applies statistical methods to biological
problems, although now used more often to include statistics applied to medicine
and health sciences.
Bipolar factor: See factor rotation.
Birth-cohort study: A
prospective study of people born in a defined period. For
example, a study following up, perhaps for many years, all children born in a
particular week, in a particular year, in respect of the possible effect of
breastfeeding on adult intelligence. [Paediatric and Perinatal Epidemiology, 1992, 6,
81–110.]
Birth–death ratio: The ratio of number of births to number of deaths within a given
time in a population.
Birth defect registries: Organized
databases containing information on
individuals born with specified congenital disorders. Important in providing
information that may help to prevent birth defects. [International Journal of
Epidemiology, 1981, 10, 247–52.]
Birth interval: The time interval between the completion of one pregnancy and the
completion of the next. A study of families in part of Finland, for example, found
that the average birth interval where the previous child survived until the birth of
the next sibling was 33.2 months. [Injury Prevention, 2000, 6, 219–22.]
Birth order: The ranking of siblings according to age, starting with the eldest in the family.
Birth rate: The number of births occurring in a region in a given time period divided by
the size of the population of the region at the middle of the time period, usually
expressed per 1000 population. For example, the birth rates for a number of
countries in 1990 were as follows:
28
Country Birth rate/1000
Cambodia 40.6
China 20.2
Malaysia 28.9
Thailand 19.9
Birthweight: Infant’s weight recorded at the time of birth. Low birthweight is defined as
a value below 2500 g; very low birthweight is defined as a value below 1500 g.
Birthweight is an important predictor of an infant’s future well-being; the mortality
of babies varies considerably according to birthweight, with very high mortality
rates among very small babies. The weight of a newborn infant depends on its
growth rate and its gestational age when born. Any factor which shortens
gestational age will reduce mean birthweight, but does not necessarily cause an
intrauterine growth retardation. [Lancet, 1996, 348, 1478–80.]
Biserial correlation coefficient: A coefficient measuring the association between a
continuous variable and a binary variable. See also point-biserial correlation.
[Psychometrika, 1963, 28, 81–5.]
Bit: A unit of information consisting of one binary digit.
Bivariate distribution: A probability distribution describing the joint statistical
behaviour of a pair of random variables, for example systolic blood pressure and
the number of cigarettes smoked per day. A well-known example is the bivariate
normal distribution, a distribution that involves five parameters, the mean of each
variable, the variance of each variable, and the correlation between the variables.
Figure 9 shows a number of examples of bivariate normal distributions.
[Hutchinson, T. P. and Lai, C. D., 1990, Continuous Bivariate Distributions,
Emphasizing Applications, Rumsby Scientific Press, Adelaide.]
Bivariate normal distribution: See bivariate distribution.
Bivariate survival data: Data in which two related
survival times are of interest.
For example, in familial studies of disease
incidence rates, data may be
available on the ages and causes of death of fathers and their sons. [Statistics in
Medicine, 1993, 12, 241–8.]
Blinding: Aprocedureusedin
clinical trials to avoid the possible bias that might
be introduced if the patient and/or doctor knows which treatment the patient is
receiving. If neither the patient nor the doctor is aware of which treatment has been
given, then the trial is termed double-blind. If only one of the patient or doctor is
unaware, then the trial is called single-blind. Clinical trials should use the
maximum degree of blindness that is possible, although in some areas, for example
surgery, it is often impossible for an investigation to be double-blind. Trials that are
not double-blinded are more likely than blinded studies to demonstrate (falsely) a
treatment effect in favour of the active intervention group. Although
double-blinding is the gold standard for clinical trials, there is evidence that it is
29
Figure 9 Perspective plots of four bivariate normal distributions each with zero means
and unit standard deviations. (a) Correlation is 0.6; (b) correlation is 0.0;
(c) correlation is 0.3; (d) correlation is 0.9.
often not particularly effective, since both patients and their treating clinicians can
frequently detect which treatment the patient is receiving. See also sham
procedures in medicine.[Controlled Clinical Trials, 1994, 15, 244–6.]
Blinding: Beware of overstated claims for blinding: the practice does not always match the intent. For
example, in a double-blind trial of propranolol against placebo in patients who had recently had a
heart attack, nearly 70% of physicians and over 80% of patients guessed correctly which substance
hadbeenadministered.
Block: A term used in experimental design to refer to a homogeneous grouping of
experimental units (often subjects) designed to enable the experimenter to isolate
and, if necessary, eliminate, variability due to extraneous causes. See also
randomized block design.
Block randomization: A random allocation procedure used to keep the number of
subjects in the different groups of a
clinical trial balanced closely at all
times. For example, if subjects are considered in sets of four at a time, then there are
six ways in which two treatments, A and B, can be allocated so that two subjects
30
receive A and two receive B, namely:
1. AABB
2. ABAB
3. ABBA
4. BBAA
5. BABA
6. BAAB
If only these six combinations are used for allocating treatments to each block of
four subjects, then the numbers in the two treatment groups can never differ by
more than two. See also biased coin method and minimization.[Controlled Clinical
Trials, 1988, 9, 375–82.]
BLUE: Abbreviation for best linear unbiased estimator.
Blunder index: A measure of the number of gross errors made in a laboratory and
detected by an external quality assessment exercise.
BMI: Abbreviation for body mass index.
Body mass index (BMI): Synonym for Quetelet’s index.
Bonferroni correction: A procedure for guarding against an increase in the
type I
error
when performing multiple significance tests. To maintain the type I error at
some selected value ␣,eachofthem tests to be performed is judged against a
significance level, ␣/m. For a small number (up to five) of simultaneous tests, this
method provides a simple and acceptable answer to the problem of multiple testing.
It is, however, highly conservative and is not recommended if a large number of
tests are to be applied, when one of the many other
multiple comparison
tests
available is generally preferable. See also least significant difference test,
Scheff
´
e’s test and Newman–Keuls test.[American Statistician, 1984, 38, 192–7.]
Bootstrap method: A method for estimating the possible
bias and the precision of
parameter estimates by repeatedly drawing random samples with replacement from
the observations available. These bootstrap samples each provide an estimate of the
parameter of interest, with a large number of them providing the required
empirical distribution from which bias, precision and
confidence intervals
can be extracted. Such methods are applied in circumstances in which the form of
the population from which the observed data have been drawn is unknown; they
are particularly useful when very limited sample data are available and traditional
parametric modelling and analysis are difficult to apply. See also jackknife.
[Statistical Science, 1986, 1, 54–77.]
Bootstrap samples: See bootstrap method.
Borrowing effect: A term used when abnormally low
standardized mortality
rates
for one or more causes of death may be a reflection of an increase in the
proportional mortality ratios for other causes of death. For example, in
a study of vinyl chloride workers, the overall proportional mortality rate for cancer
indicated approximately a 50% excess compared with cancer death rates in the male
US population. (One interpretation of this is a possible deficit of noncancer deaths
31
Figure 10 Box-and-whisker plot of haemoglobin concentration for two groups of men.
duetothehealthy worker effect.) Because the overall proportional
mortality rate must by definition be equal to unity, a deficit in one type of mortality
must entail a ‘borrowing’ from other causes.
Bowker’s test for symmetry: A test that can be applied to square contingency tables to
assess the hypothesis that the chance of being in cell i,j of the table is equal to the
chance of being in cell j,i. In the case of a
two-by-two contingency table,
the test becomes
McNemar's test. See also marginal homogeneity. [Everitt,
B. S., 1992, The Analysis of Contingency Tables, Chapman and Hall/CRC, Boca
Raton, FL.]
Box-and-whisker plot: A graphical method of displaying the important characteristics
of a set of observations. The display is based on the
five-number summary of
the data, with the ‘box’ part covering the
interquartile range and the
‘whiskers’ extending to include all but
outside observations, these being
indicated separately. Such diagrams are often particularly useful for comparing the
characteristics of samples from different populations, as shown in Figure 10.
32
Figure 11 Bubble plot of haemoglobin concentration versus cell volume with radii
of circles proportional to white blood count.
Box-counting method: A method for estimating fractal dimension of self-similar
patterns in space that consists of plotting the number of
pixels that intersect the
pattern under consideration versus the length of the pixel unit. [Falconer, K., 1990,
Fractal Geometry,J.Wiley&Sons,NewYork.]
Box–Cox transformations: A family of data transformations designed to achieve
normality. [Rawlings, J. O., Pantula, S. G. and Dickey, D. A., 1998, Applied
Regression Analysis: A Research Tool, Springer, New York.]
Box plot: Synonym for box-and-whisker plot.
Box’s test: A test for assessing the equality of the variances in a number of populations
that is less sensitive to departures from normality than
Bartlett's test. See
also Hartley’s test.
Branching process: A
stochastic process in which individuals give rise to
offspring, the distribution of descendants being likened to branches of a family
33
tree. [Jagers, P., 1975, Branching Processes with Biological Applications,J.Wiley&
Sons, Chichester.]
Breadline index: An index of poverty that incorporates measures of unemployment,
long-term illness and social class. [Gordon, D. and Pantazis, C. (eds), 1997,
Breadline Britain in the 1990s, Ashgate, Aldershot.]
Breakdown point: A measure of insensitivity of an estimator to multiple
outliers in
the data. Roughly, it is given by the smallest fraction of data contamination needed
to cause an arbitrarily large change in the estimate. [Computational Statistics, 1996,
11, 137–46.]
Breslow–Day test: A test of the null hypothesis of homogeneity of the
odds ratio
across a series of
two-by-two contingency tables
. [Breslow, N. E. and
Day, N. E., 1957, Statistical Methods in Cancer Research: I The Analysis of Case
Control Studies, IARC, Lyon.]
Brownian motion: A phenomenon first reported by an English botanist, Robert Brown,
in 1827, when he observed that pollen particles in an aqueous suspension
performed a continuous haphazard zigzag movement. It was only in 1905 that the
motion could be explained by assuming that the particles are subject to continual
bombardment of the molecules in the surrounding medium. [Bailey, N. T. J., 1990,
The Elements of Stochastic Processes with Applications to the Natural Sciences,
J. Wiley & Sons, New York.]
Bubble plot: A method for displaying observations that involve three variable values. Two
of the variables are used to form a
scatter diagram and values of the third
variable are represented by circles with differing radii centred at the appropriate
position. An example is shown in Figure 11. [Everitt, B. S. and Rabe-Hesketh, S.,
2001, The Analysis of Medical Data using S-PLUS, Springer, New York.]
Byte: A unit of information, as used in digital computers, equal to eight
bits.
34
C
Calendarization: A generic term for benchmarking.
Calendar plot: A method of describing
compliance for individual patients in a
clinical trial
, where the number of tablets taken per day are set in a
calendar-like form (see Figure 12). See also chronology plot. [Statistics in Medicine,
1997, 16, 1653–64.]
Calibration: A procedure that enables a series of easily obtainable but possibly less precise
measurements to be used in place of more expensive or more-difficult-to-obtain
measurements of some quantity of interest. Suppose, for example, that there is a
well-established, accurate method of measuring the concentration of a given
chemical compound, but that it is too expensive and/or cumbersome for routine
use. A cheap and easy-to-apply alternative is developed that is, however, known to
be imprecise and possibly subject to
bias. By using both methods over a range of
concentrations of the compound, and applying regression analysis to the values
from the cheap method and the corresponding values from the accurate method, a
calibration curve can be constructed that may, in future applications, be used to
read off estimates of the required concentration from the values given by the less
involved, inaccurate method. [International Statistical Institute, 1991, 59, 309–36.]
Calibration curve: See calibration.
California score: A score used in studies of sudden infant death syndrome that gives the
number from eight adverse conditions present for a given infant. The events
include fewer than 11 antenatal visits, male sex, birthweight under 3000 g and
mother under 25 years old.
Caliper matching: See matching.
Campbell collaboration: An international group of scientists whose mission is to
promote access to systematic evidence of the effects of interventions in areas such
as crime, social welfare, education and other social and behavioural sectors.
[]
Canonical correlation analysis: A method of analysis for investigating the relationship
between two groups of variables by finding linear functions of one of the sets of
variables that maximally correlate with linear functions of the variables in the other
set. In many respects, the method can be viewed as an extension of
multiple
linear regression
to situations involving more than a single response
35
Figure 12 Calendar plot of number of tablets taken per day. (Reproduced from
Statistics in Medicine
with permission of the publisher Wiley).
variable. Alternatively, it can be considered as analogous to principal
components analysis
, except that a correlation rather than a variance is
maximized. A simple example of where this type of technique might be of interest
is when the results of tests for, say, reading speed (x
1
), reading power (x
2
),
arithmetical speed (y
1
) and arithmetical power (y
2
) are available from a sample of
schoolchildren, and the question of interest is whether reading ability (measured by
x
1
and x
2
) is related to arithmetical ability (as measured by y
1
and y
2
). [Pain, 1992,
51, 67–73.]
Canonical correlation analysis: Results are often difficult to interpret, even by statisticians.
Capture–recapture sampling: A sampling scheme used in situations where the aim is
to estimate the total number of individuals in a population. An initial sample is
obtained and the individuals in that sample are marked or otherwise identified. A
second sample is subsequently obtained independently, and it is noted how many
individuals in that sample are marked. If the second sample is representative of the
population as a whole, then the sample proportion of marked individuals should
be about the same as the corresponding population proportion. From this
relationship, the total number of individuals in the population can be estimated.
Used originally to estimate the size of animal populations, the method is now also
used to assess the size of many populations of great interest in medicine, for
example the number of drug users in a particular area or the completeness of
cancer registry data. [Journal of Chronic Disease, 1968, 21, 287–301.]
Carrier: A person that harbours a specific infectious agent in the absence of discernible
clinical disease and serves as a potential source of infection. [Acta Pathologica
Microbiologica Scandinavica, 1956, 39, 107–8.]
Carry-over effects: See crossover design.
Cartogram: A diagram in which descriptive statistical information is displayed on a
geographical map by means of shading, by using a variety of different symbols or
by some more involved procedure. Figure 13 shows a simple example and Figure 14
shows a more complex example. See also disease mapping.
Case: A term used most often in epidemiology for a person in the population or study
group identified as having the disease or condition of interest.
36
Mon Tue Wed Thu Fri Sat Sun
31 1 210 1
0
2
0
1
1
0
0
0
0
1
0
1
1
2
0
1
1
1
1
1
1
1
0
1
1
10
17
24
31
Figure 13 Cartogram of life expectancy in the USA by state. LE70 = 70 years or less,
GT70 = more than 70 years.
Figure 14 1996 US population cartogram (all states are resized relative to their
population).
Case–cohort study: A study that has the same aims as a cohort study but tries to
achieve them at less expense by following all cohort members for disease outcomes
but following only a sample of members for all other information of interest. For
example, only 20% of the cohort members in an investigation of breast cancer may
37
have the full range of covariates of interest measured. [American Journal of
Epidemiology, 1990, 131, 169–76.]
Case-control study: See retrospective study.
Case-crossover design: A procedure for the analysis of transient effects on the risk of
acute illness events that uses cases as their own controls. The idea behind the
method is to ask a patient whether he or she was engaged in some activity or
exposed to a suspected cause immediately before the event, and to compare the
response to the usual frequency with which he or she engages in the activity or is
exposed. In this way, each case is its own control. The hypothesis that vigorous
exercise predisposes to heart attacks, for example, might be investigated by such a
design, with cases being asked about their usual frequency of taking vigorous
exercise and about whether they were engaged in such activity immediately
before their heart attack. [American Journal of Epidemiology, 1991, 133,
144–53.]
Case-fatality rate: The probability of death amongst diagnosed cases of a disease.
Specifically defined as number of deaths due to the disease in a specified time
period divided by the number of cases of the disease at the beginning of the period.
Typically used in acute infectious diseases such as AIDS, although the use of a
survivorship table is often preferable. Not so useful for chronic diseases because the
period from onset to death is typically long and variable. [Morton, R. F., Hebel,
J. R. and McCarter, R. J., 1990, A Study Guide to Epidemiology and Biostatistics,
Aspen, Gaithersburg, MD.]
Case-heterogeneity study: A procedure for the estimation of
relative risks not
against a set of nondiseased population referents but against a set of subjects with
other diseases, some of which may also have an association with the same exposure
factors or their correlates. [Statistics in Medicine, 1986, 5, 49–60.]
Case mix: The characteristics of the patients and/or the medical problems treated by an
individual clinician, hospital or clinic.
Case–parent–triad design: A design useful for studying genetic risk factors in
reproductive epidemiology. The central idea of the design is to use parents of
affected children to serve as genetic controls. [International Journal of Epidemiology,
2002, 31, 669–78.]
Case series: Medical reports on a series of patients with an outcome of interest. No
control group is involved so such reports provide essentially only
anecdotal
evidence
.
Catalytic epidemic models: Models concerned with the age distribution at attack of
infectious disease. The simplest such model assumes that a constant force of
infection acts upon members of a susceptible population. More generally, the force
of infection is allowed to be a function of the age of a susceptible individual.
[Applied Statistics, 1974, 23, 330–39.]
Catchment area: A region from which the clients of a particular clinic or hospital are
drawn.
38
Categorical variable: A variable that gives the appropriate label of an observation after
allocation to one of several possible categories, for example gender: male or female;
marital status: married, single or divorced; blood group: A, B, AB or O. Categorical
variables separate observations into groups. The categories are often given
numerical labels, but for this type of data these have no numerical significance. See
also binary variable, continuous variable and measurement scale.
Categorizing continuous variables: A procedure common in medical research in
which continuous variables are converted into categorical variables by grouping
values into two or more categories, for example age might become ‘young’ (<40)
and ‘old’ (≥40). The use of such grouping for descriptive purposes is probably
unobjectionable, but when carried forward to data analysis it can cause serious
problems and should be avoided since, in essence, the procedure introduces an
extreme form of measurement error. [British Journal of Cancer, 1991, 64, 975.]
Categorizing continuous variables: Although seemingly very popular with clinical researchers, a
procedure that is best avoided.
Causality: The relating of causes to the effects they produce. Many investigations in
medicine seek to establish causal links between events, for example that receiving
treatment A causes patients to live longer when compared with taking treatment B.
In general, the strongest claims to have established causality come from data
collected in experimental studies. Relationships established in observational studies
may be very suggestive of a causal link, but they are almost always open to
alternative explanations. See also Hill’s criteria of causality.[American Journal of
Epidemiology, 1991, 133, 635–45.]
Causal risk difference: The difference between the rate of disease that would have been
observed if the entire study population had been exposed and the rate of disease
that would have been observed if the entire study population had been unexposed.
Cause-specific death rate: A death rate calculated for people dying from a particular
disease. For example, the following are the rates per 1000 people for three disease
classes for developed and developing countries in 1985:
C1 C2 C3
Developed 0.5 4.5 2.0
Developing 4.5 1.5 0.6
C1 = Infectious and parasitic diseases
C2 = Circulatory diseases
C3 = Cancer
See also crude death rate and age-specific death rate. [Parkin, M., Whelan, S.,
Ferlay, J., Teppo, L. and Thomas, D. B., 2003, Cancer Incidence in Five Continents,
Volume VIII, IARC Scientific Publications, Lyon.]
39
Ceiling effect: A term used to describe what happens when many subjects in a study have
scores on a variable that are at or near the possible upper limit (ceiling). Such an
effect may cause problems for some types of analysis because it reduces the possible
amount of variation in the variable. A medical example is the use of morphine
where increasing the dose leads to smaller and smaller gains in pain relief. The
converse, or floor effect, causes similar problems. [Annals of Thoracic Surgery, 2002,
73, 1222–8.]
Cell-cycle models: Mathematical models for the study of the variation in the cell-cycle
time and phase durations. [Acta Biotheoretica, 1995, 43, 3–25.]
Censoring: The loss of subject from a study before the event of interest has occurred.
Arises most often in studies of
survival times when, at the end of the study,
some patients remain alive. The survival time of these patients is known only to be
longer than the time they have been observed (right-censored). Data containing
censored observations need appropriate techniques for their analysis, for
example
Cox's proportional hazards model. [Collett, D., 2003,
Modelling Survival Data in Medical Research, 2nd edn, Chapman and Hall/CRC,
Boca Raton, FL.]
Census: A study that involves making observations of every member of a population of
interest. Intended originally for the purposes of taxation and military service,
censuses are now used to provide the facts essential to governmental policymaking,
planning and administration. Age, birth date, occupation, national origin and
marital status are some of the variables generally recorded. [Technical Report 40,
Government Planning Office, Washington, DC.]
Centile: Synonym for percentile.
Centile reference charts: Charts used in medicine to observe clinical measurements on
individual patients in the context of population values. If the population
centile
corresponding to the subject’s value is atypical, then this may indicate an
underlying pathological condition. The chart can also provide a background with
which to compare the measurement as it changes over time. An example is given in
Figure 15. [Statistics in Medicine, 1996, 15, 2657–68.]
Centralized database: A
database held and maintained in a central location,
particularly in a
multicentre study.
Central limit theorem: A theorem that asserts that the sum of a large number of
random variables is distributed approximately normally, no matter what the
probability distribution of the original variables. Important to statistical theory
because it provides the general conditions under which the distribution of an
arithmetic mean is approximated by the normal distribution. The theorem allows
the use of the normal distribution in creating
confidence intervals and
hypothesis testing. [Altman, D. G., 1991, Practical Statistics for Medical Research,
Chapman and Hall/CRC, Boca Raton, FL.]
Central range: The range within which the central 90% of values of a set of observations
lie.
40
Figure 15 Centile reference chart for birthweight for gestational age.
Central tendency: A property of the frequency distribution of a variable, usually
measured by statistics such as the mean, median and mode.
CFA: Abbreviation for confirmatory factor analysis.
Chain-binomial models: Models arising in the mathematical theory of infectious
diseases that postulate that at any stage in an epidemic there are a certain number
of infected individuals and susceptible individuals, and that it is reasonable to
suppose that the latter will yield a fresh crop of cases at the next stage, the number
of new cases having a
binomial distribution. This results in a chain of
binomial distributions, the actual probability of a new infection at any stage
depending on the numbers of infected individuals and susceptible individuals at
the previous stage. [Bailey, N. T. J., 1975, The Mathematical Theory of Infectious
Diseases, Arnold, London.]
Chain referral sampling: Synonymous with snowball sampling.
Chains of infection: A description of the course of an infection among a set of
individuals. The susceptible individuals infected by direct contact with the
introductory cases are said to make up the first generation of cases; the susceptible
individuals infected by direct contact with the first generation are said to make up
the second generation, and so on. The enumeration of the number of cases in each
generation is called an epidemic chain. Thus the sequence 1–2–1–0 denotes a
chain consisting of one introductory case, two first-generation cases, one
41
2000
1950
1900
1850
1800
1750
1700
1650
1600
1550
1500
1450
1400
1350
1300
1250
1200
1150
1100
1050
1000
950
900
850
800
750
700
650
600
550
500
450
400
22 24 26 28 30 32
Birthweight (g)
97%
90%
50%
10%
3%
second-generation case and no cases in later generations. A concrete example is
provided by the transmission of HIV by unprotected sexual intercourse
between, say, men from one area of the world and women in another region.
[Proceedings of the National Academy of Science of the United States of America,
2003, 100, 11143–7.]
Change point studies: Studies involving chronologically ordered data collected over a
period of time during which it is known (or suspected) that there has been a change
in the underlying data-generation mechanism. Interest then lies in making
inferences about the time in the sequence that the change occurred. [International
Statistical Institute, 1980, 48, 83–93.]
Change scores: Scores obtained by subtracting a post-treatment value on some response
variable from the value pretreatment. Often used as the basis of analysis for a
pre–post study but known to be less powerful than using
analysis of
covariance
of post-treatment scores with pretreatment as a covariate. See also
adjusting for baseline. [Senn, S., 1997, Statistical Issues in Drug Development,
J. Wiley & Sons, Chichester.]
Chaos: Apparently random behaviour exhibited by a deterministic system. The concept
has been used in medicine in investigations of measles epidemics. [Gleik, J., 1987,
Chaos, Sphere Books, London.]
Chaos: Said to have been discovered in the 1970s, although Clerk Maxwell was well aware of its
consequences nearly 150 years earlier.
Child death rate: The number of deaths of children aged 1–14 years in a given year per
1000 or per 100 000 children in this age group. For example, in Massachusetts,
USA in 1997, the rate per 100 000 was 15, and in Alaska in the same period it
was 42.
Chi-squared distribution: The distribution of the sum of squares of a number (n)
of normal variables each with zero mean and standard deviation one. The
shape of the distribution depends on n, as shown in Figure 16. Important as the
distribution (in large samples) of the
chi-squared test. [Evans, M.,
Hastings, N. and Peacock, B., 2000, Statistical Distributions, 3rd edn, J. Wiley &
Sons, New York.]
Chi-squared goodness-of-fit test: See chi-squared test.
Chi-squared test: Most commonly used to refer to the test of the independence of the
two categorical variables forming a
contingency table, although the test is
used in several other ways, for example to assess the fit of a theoretical probability
distribution to observed data, when it is generally referred to as the chi-squared
goodness-of-fit test. The test is based on squared differences between the observed
and
expected frequencies. [Greenwood, P. E. and Nikulin, M. S., 1996,
A Guide to Chi-squared Testing,J.Wiley&Sons,NewYork.]
42
Figure 16 Chi-squared distributions for different parameter values. DF, degrees of
freedom.
Chi-squared test for trend: A test applied to a two-dimensional
contingency
table
in which one variable has two categories and the other has k ordered
categories to assess whether there is a difference in the trend of the proportions in
the two groups. The result of using the ordering in this way is a test that has more
power for detecting departures from the null hypothesis than using the
chi-squared test for independence. [Everitt, B. S., 1992, The Analysis of
Contingency Tables, 2nd edn, Chapman and Hall/CRC, Boca Raton, FL.]
Chloropleth mapping: Synonymous with disease mapping.
Chronology plot: A method of describing
compliance in individual patients taking
partina
clinical trial by plotting times when they take their tablets over the
course of the study. See Figure 17 for an example. See also calendar plot.[Statistics
in Medicine, 1997, 16, 1653–64.]
Chronomedicine: The study of the effects of circadian and other natural time structures
on health, disease risk, etc. [Annual Review of Physiology, 1969, 31, 675–725.]
Circadian variation: The variation that takes place in variables such as blood pressure
and body temperature over a 24-hour period. Such variations may arise directly
from the effects of the varying levels of electromagnetic radiation from the sun at
different times of the day. In addition, many living organisms have evolved
internally generated rhythms that do not depend entirely on external stimuli. See
also seasonal variation.[Cell, 1994, 78, 261–4.]
43
x
f
(
x
)
0 10203040
0.0 0.05 0.10 0.15 0.20
DF=3
DF=5
DF=10
DF=20
Figure 17 Chronology plot of times that a tablet is taken in a clinical trial. (Reproduced
from
Statistics in Medicine
with permission of the publisher Wiley).
Class frequency: The number of observations in a class interval of the observed
frequency distribution of a variable.
Classification and regression trees (CART): An alternative to procedures such as
multiple linear regression and logistic regression for
investigating the relationship between a response variable and a set of explanatory
variables. The essential feature of this approach is the repeated division of the
observations into smaller and smaller groups within which the response variable
becomes more and more homogeneous. In this way, a tree structure is generated.
An example is shown in Figure 18. Various procedures are available to help decide
when further division is unnecessary. Binary response variables lead to what are
known as classification trees, and continuous response variables lead to regression
trees. [Everitt, B. S., 2003, Modern Medical Statistics, Arnold, London.]
Classification and regression trees: The seductive diagrams that result from this approach should
not cloud the fact that it remains largely exploratory.
Classification of medical and surgical procedures: Classification designed to
facilitate statistical analysis, with the structure and composition of categories
reflecting their frequency of occurrence and surgical importance. [World Health
Organization, 1978, International Classification of Procedures in Medicine,World
Health Organization, Geneva.]
Classification rule: See discriminant analysis.
44
24
20
16
12
8
4
jun/6 jul/17jul/2 aug/1 aug/16 aug/31 sept/9 sept/30 oct/10 oct/30 nov/11 nov/29
date