Fundamentals of Polymer Engineering Part 13 doc
Bạn đang xem bản rút gọn của tài liệu. Xem và tải ngay bản đầy đủ của tài liệu tại đây (821.33 KB, 39 trang )
12
Mechanical Properties
12.1 INTRODUCTION
It is usually material properties, in addition to cost and availability, that determine
which class of materials–polymers, metals, or ceramics—and which particular
member within that class are used for a given application. Many commodity
thermoplastics, for example, begin to soften around 100
C, and this essentially
limits their use to temperatures that are a few tens of degrees Celsius below this
value. A major factor in favor of polymers, though, is their low density (by a
factor of 4 or 5) relative to metals; the possibility of a large weight savings,
coupled with high strength, makes plastics very attractive for automotive, marine,
and aerospace applications. In terms of choosing a specific polymer, however, it is
necessary to consider whether the application of interest is structural or
nonstructural. In the former case, mechanical properties such as tensile strength,
stiffness, impact strength, and chemical resistance might be relevant, whereas
important considerations in the latter case might include surface finish, ease of
painting, and the influence of humidity and ultraviolet radiation on the tendency
of the material to crack. In this chapter, we will consider mechanical properties of
polymers at small strains as well as large strains. In general, the mode of
deformation could be tension, compression, shear, flexure, torsion, or a combina-
tion of these. To keep the discussion manageable, we will restrict ourselves to
tension and shear. Note, however, that we can use viscoelasticity theory [1],
487
Copyright © 2003 Marcel Dekker, Inc.
especiallyatsmallstrains,topredictthebehaviorinonemodeofdeformation
frommeasurementsmadeinanothermodeofdeformation.Aswithmetals,we
expectthatthemeasuredpropertiesdependonthechemicalnatureofthepolymer
andthetemperatureofmeasurement.However,whatmakesdataanalysisand
interpretationbothfascinatingandchallengingarethefactsthatresultsalso
dependontimeofloadingortherateofdeformation,polymermolecularweight,
molecular-weightdistribution,chainbranching,degreeofcross-linking,chain
orientation,extentofcrystallization,crystalstructure,sizeandshapeofcrystals,
andwhetherthepolymerwassolutioncastormeltprocessed.Thesevariablesare
notallindependent;molecularweight,forexample,candeterminechain
orientationandcrystallinityinaparticularprocessingsituation.Toexplainthe
separateinfluenceofsomeofthesevariables,wepresentdataonpolystyrene,a
polymerthatcanbesynthesizedinnarrowmolecular-weightfractionsusing
anionicpolymerization.Methodsofimprovingpolymermechanicalproperties
areagainillustratedusingpolystyrene.Thischapterthereforefocusesonthe
(glassy)behaviorofpolymersbelowtheirglasstransitiontemperature.
12.2STRESS^STRAINBEHAVIOR
WhendiscussingthetheoryofrubberelasticityinChapter10,wewereconcerned
withfairlylargeextensionsorstrains.Thesearosebecausepolymermolecules
coulduncoilattemperaturesaboveT
g
.Formaterialsusedasstructuralelements
(suchasglassypolymers),weusuallycannottoleratestrainsofmorethana
fractionof1%.Therefore,itiscustomarytoemploymeasuresofinfinitesimal
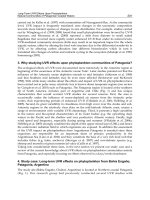
strain.Inatensiletest,weusuallytakeaspecimenwithtabsattheendsand
stretchit,asshowninFigure12.1.Oneendofthesampleistypicallyfixed,
whereastheotherismovedoutwardataconstantvelocity.TheforceFnecessary
tocarryoutthestretchingdeformationismonitoredasafunctionoftimealong
withtheinstantaneoussamplelength,L.Fromthemeasuredloadversus
extensionbehavior,wecancalculatethestressandstrainasfollows:
StressðsÞ¼
ForceðFÞ
Cross-sectionalarea
ð12:2:1Þ
Ifthecross-sectionalareaistheundeformed,originalcross-sectionalarea,the
stressiscalledengineeringstress,andiftheactual,instantaneousareaisused,the
truestressismeasured.
StrainðEÞ¼
LL
0
L
0
ð12:2:2Þ
488Chapter12
Copyright © 2003 Marcel Dekker, Inc.
whereL
0
istheinitialsamplelength,andthestrain,sodefined,isknownasthe
engineeringstrain.NotethatthisstrainisrelatedtotheHenckystrain,alsocalled
thetruestrain,asfollows:
E
true
¼lnð1þE
eng
Þð12:2:3Þ
andthetwostrainmeasuresareidenticalforsmallstrains.
Asthesampleisstretchedinthezdirection,itscross-sectionalarea
decreases,andthisimpliesthatthematerialsuffersanegativestraininthex
direction,whichisperpendiculartothestretchingdirection.Thisisquantified
usingthePoissonration,definedas
E
x
¼nE
z
ð12:2:4Þ
Forincompressiblematerialssuchasrubber,itiseasytoshowthatPoisson’sratio
equals0.5.Forglassypolymersthesamplevolumeincreasessomewhaton
stretching,andPoisson’sratiorangesfrom0.3to0.4.
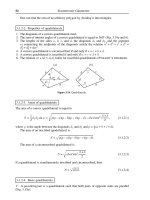
Typicalstress–straindataforglassypolystyreneareshowninFigure12.2in
bothtensionandcompression[2].Theslopeofthestress–straincurveevaluated
attheoriginistermedtheelasticmodulus,E,andistakentobeameasureofthe
stiffnessofthematerial.Itisseeninthisparticularcasethatthemodulusin
tensiondiffersfromthatincompression.Thetwocurvesendwhenthesample
fractures.Thestressatfractureiscalledthestrengthofthematerial.Because
materialsfractureduetothepropagationofcracks,thestrengthintensionis
usuallylessthanthatincompressionbecauseacompressivedeformationtendsto
healanycracksthatform(providedthesampledoesnotbuckle).Thestrainat
FIGURE12.1Typicalspecimenforatensiletest.
Mechanical Properties 489
Copyright © 2003 Marcel Dekker, Inc.
fracture is known as the elongation-to-break; the larger the value of this quantity,
the more ductile is the material being tested. Glassy polystyrene is not ductile in
tension; indeed, it is quite brittle. Finally, the area under the stress–strain curve is
called the toughness and has units of energy per unit volume. For design
purposes, the materials generally sought are stiff, strong, ductile, and tough.
For materials that are liquidlike, such as polymers above their softening
point, it is easier to conduct shear testing than tensile testing. This conceptually
involves deforming a block of material, as shown in Figure 12.3. The force F is
FIGURE 12.2 Stress–strain behavior of a normally brittle polymer such as polystyrene
under tension and compression.
(Reprinted from Nielsen, L. E., and R. F. Landel: Mechanical Properties of Polymers and
Composites, 2nd ed., Marcel Dekker, Inc., New York, 1994, p. 250, by courtesy of Marcel
Dekker, Inc.)
FIGURE 12.3 Shear defor mation.
490 Chapter 12
Copyright © 2003 Marcel Dekker, Inc.
againmonitored,butnowasafunctionofthedisplacementDu
x
.Stressandstrain
arenowdefinedasfollows:
ShearstressðtÞ¼
ForceðFÞ
Surfacearea
ð12:2:5Þ
ShearstrainðgÞ¼
Du
x
Dy
ð12:2:6Þ
Attemperaturesabovethepolymerglasstransitiontemperature,sheartestingis
doneusingavarietyofviscometers(seeChap.14).Wemight,forexample,keep
thesampleintheannularregionbetweentwoconcentriccylindersandmeasure
thetorquewhilerotatingonecylinderrelativetotheother.Stress–straindatain
shearlookqualitativelysimilartothetensiledatashownearlierinFigure12.2.
The initial slope is called the shear modulus, G. For elastic materials the moduli
in shear and tension are related by the following expression:
E ¼ 2Gð1 þnÞð12:2:7Þ
so that E equals 3 G for incompressible, elastic polymers. Note that when material
properties are time dependent (i.e., viscoelastic), the modulus and strength
increase with increasing rate of deformation [3], whereas the elongation-to-
break generally reduces. Viscoelastic data are often represented with the help of
mechanical analogs.
Example 12.1: A polymer sample is subjected to a constant tensile stress s
0
.
How does the strain change with time? Assume that the mechanical behavior of
the polymer can be represented by a spring and dashpot in series, as shown in
Figure 12.4.
Solution: The stress-versus-strain behavior of a Hookean spring is given by
s ¼ EE
FIGURE 12.4 A Maxwell element.
Mechanical Properties 491
Copyright © 2003 Marcel Dekker, Inc.
ForaNewtoniandashpot,therelationis
s¼Z
dE
dt
ThetermsEandZarethespringmodulusanddashpotviscosity,respectively.
Forthespringanddashpotcombination,oftencalledaMaxwellelement,
thetotalelongationorstrainisthesumoftheindividualstrains.Thestressforthe
springandforthedashpotisthesame,
Totalstrain¼
s
0
E
þ
s
0
Z
t
anditisseenthatthestrainincreaseslinearlywithtime.Thisbehaviorisknownas
creep.AlthoughasimplemechanicalanalogsuchasaMaxwellelementcannotbe
expectedtoportraytruepolymerbehavior,itdoesillustratetheusuallyundesir-
ablephenomenonofcreep.Abettermodelforthequantitativerepresentationof
creepisafour-elementmodelwhichisalinearcombinationofaMaxwellelement
andaVoigtelement;thelatteriscomposedofaspringandadashpotinparallel.
Apolymersamplecreepsbecausepolymermoleculesareheldinplaceby
secondarybondsonly,andtheycanrearrangethemselvesundertheinfluenceof
anappliedload.Thisisespeciallyeasyabovethepolymerglasstransition
temperature,butitalsohappensbelowT
g
andstraingaugeshavetobeemployed
foraccuratemeasurements.Toillustratethelatterpoint,weshowlong-termcreep
data,intheformofcirclesinFigure12.5,onsamplesofpolyvinylchloride
(PVC) at constant values of tensile stress, temperature, and relative humidity [4].
Note that data for the first 1000 h are shown separately, followed by all of the data
using a compressed time scale. It is seen that the total creep can be several
percent, and a steady state is not reached even after 26 years! These and similar
data can be represented by the following simple equation shown by solid lines in
Figure 12.5:
EðtÞ¼E
0
þ E
þ
t
n
ð12:2:8Þ
in which E
0
, E
þ
, and n are constants. Although n is often independent of
temperature and imposed stress, the other two constants are stress and tempera-
ture dependent. If creep is not arrested, it can lead to failure, which may occur
either by the process of crazing or by the formation of shear bands; these failure
mechanisms are discussed later in the chapter. Equation (12.2.8) is an empirical
equation that is known as the Findley model. It may sometimes contain a second
time-dependent term if failure can occur by two different mechanisms. Creep can
generally be reduced by lowering the test temperature, raising the polymer T
g
,
cross-linking the sample, or adding either particulates or short fibers. Conversely,
anything that lowers the T
g
, such as exposure to atmospheric moisture, promotes
creep. Physical aging (described later) also affects the extent of creep.
492 Chapter 12
Copyright © 2003 Marcel Dekker, Inc.
FIGURE 12.5 Creep curves for polyvinyl chloride at 75
F, 50% relative humidity. (From Ref. 4.)
Mechanical Properties 493
Copyright © 2003 Marcel Dekker, Inc.
12.2.1 In£uence of Variables such as Molecular
Weight and Temperature
The strength and stiffness of one glassy polymer can be expected to differ from
that of another glassy polymer due to differences in intermolecular forces as a
result of differences in chemical structure and the presence or absence of
secondary bonds (e.g., hydrogen-bonding). Given these differences, the two
variables that influence the mechanical properties of amorphous polymers the
most are molecular weight and temperature. However, the elastic moduli and
other small-strain properties of strain-free glassy polymers such as polystyrene
(PS) are found not to depend on the molecular weight or molecular-weight
distribution, except at very low molecular weights [5–7]. The tensile strength, s
f
,
of polymers having a narrow molecular-weight distribution, however, is negli-
gible at low molecular weight, increases with increasing molecular weight, and,
ultimately reaches an asymptotic value [8]. This behavior can often be repre-
sented by the following equation [6, 9]:
s
f
¼ A B=M
n
ð12:2:9Þ
where A and B are constants. Data for polystyrene, shown in Figure 12.6, support
these conclusions [10]. From an examination of this figure, it is obvious that the
addition of a low-molecular-weight fraction is bound to affect the tensile strength
of any polymer. However, for polydisperse samples, data do not follow Eq.
(12.2.9) exactly; results vary with the polydispersity index, even when the
number-average molecular weight is held fixed.
The data just discussed are related to amorphous polymer samples for
which the polymer chains were randomly oriented. One method of increasing
both strength and stiffness is to use samples wherein polymer chains are oriented
FIGURE 12.6 Tensile strength of monodisperse polystyrene as a function of molecular
weight. From Hahnfeld, J. L., and B. D. Dalke: General purpose polystyrene, in
Encyclopedia of Polymer Science and Engineering, 2nd ed., vol. 16, H. F. Mark, N. M.
Bikales, C. G. Overberger, and G. Menges (eds.) Copyright # 1989 by John Wiley &
Sons, Inc. This material is used by permission of John Wiley & Sons, Inc.
494 Chapter 12
Copyright © 2003 Marcel Dekker, Inc.
alongthestretchingdirection.Byusingthistechnique,wecanverysignificantly
increasethemodulusofpolystyreneandhopetogetstrengththatapproachesthe
strengthofprimarychemicalbonds[11].Indeed,asdiscussedinChapter11,
mechanicalpropertyenhancementusingchainalignmentisthereasonforthe
popularityofpolymersthatpossessliquid-crystallineorder.Propertiesina
directionperpendiculartothechainaxis,however,arelikelytobeinferiorto
thosealongthechainaxis.
WhentheYoung’smodulusofanypolymerisplottedasafunctionof
temperature,wefindthatthisquantityisoftheorderof10
5
–10
6
psiatlow
temperaturesanddecreasesslowlywithincreasingtemperature.Thisregionis
knownastheglassyregion.AttheglasstransitiontemperatureT
g
(seealsoChap.
2),whichvariesfordifferentpolymers,themodulusdropssuddenlybyatleast
threeordersofmagnitudeandcanreachextremelylowvaluesforlow-molecular-
weightpolymers.Figure12.7showstheYoung’smodulusofpolystyreneina
temperaturerangeof200
Cto25
C[12].Figure12.8showsshearstressversus
shearstraindataforanentangledpolystyreneinatemperaturerangeof160
C–
210
C[13].IfwedisregardthenumericaldifferencebetweentheYoung’s
modulusandtheshearmodulusandnotethat1MPaequals145psi,wefind
thatthemoduluscalculatedfromdatainFigure12.8isseveralordersof
magnitudesmallerthanthenumberexpectedonthebasisofextrapolatingthe
curveinFigure12.7.ThishappensbecausetheT
g
ofpolystyreneis100
C.The
behavioroftheYoung’smodulus,inqualitativeterms,issketchedinFigure12.9
overatemperaturerangethatincludesT
g
.Ifthepolymermolecularweightis
abovethatneededforentanglementformation(forpolystyrene,thisisapproxi-
mately35,000),thepresenceoftheseentanglementstemporarilyarreststhefallin
modulusoncrossingT
g
.Thisregionofalmostconstantmodulusiscalledthe
rubberyplateau,andtheresultisarubberypolymer.Becausecrystalsactina
mannersimilartoentanglements,themodulusofasemicrystallinepolymerdoes
FIGURE12.7EffectoftemperatureonYoung’smodulusofpolystyrene.(FromRef.
12.) Reprinted with permission from J. Appl. Phys., vol. 28, Rudd, J. F., and E. F. Gurnee:
Photoelastic properties of polystyrene in the glassy state: II. Effect of temperature, 1096–
1100, 1957. Copyright 1957 American Institute of Physics
Mechanical Properties 495
Copyright © 2003 Marcel Dekker, Inc.
FIGURE 12.8 Effect of temperature on the stress–strain cur ves of polystyrene melts.
(From Ref. 13.)
FIGURE 12.9 Qualitative effect of temperature on the elastic modulus of polymers.
496 Chapter 12
Copyright © 2003 Marcel Dekker, Inc.
notfallasprecipitouslyasthatofamorphouspolymersfortemperaturesbetween
theT
g
andthemeltingpointofthecrystals.Ofcourse,ifchemicalcross-linksare
present,thepolymercannotflowandthetemperaturevariationofthemodulus
aboveT
g
isgivenbythetheoryofrubberelasticity.Understandingandrelating
mechanicalpropertiesofasemicrystallinepolymertothedifferentvariablesthat
characterizeitsstructurehasbeendiscussedinChapter11andistreatedindetail
bySamuels[14].
12.3THEGLASSTRANSITIONTEMPERATURE
AsdiscussedinChapter2,theglasstransitiontemperatureseparatesregionsof
dramaticallydifferentpolymerproperties.Inparticular,apolymerbehaveslikea
hard,brittle,elasticsolidbelowT
g
.Inthisglassyregion,themotionofpolymer
chainsisfrozenandstrainoccursbythestretchingofbonds.Theelasticmodulus
decreaseswithincreasingtemperature.OnheatingaboveT
g
,anentangled,
amorphouspolymerdisplaysarubberyregioninwhichitissoftandpliable
duetotheabilityofpolymerchainsegmentsandentirepolymerchainstomove
pasteachotherinareversiblemanner.Inthisregion,theelasticmoduluscan
increasewithanincreaseintemperature;thispropertyhasbeenexplained
theoreticallyinChapter10.StructuralapplicationsclearlyrequireapolymerT
g
aboveroomtemperature,whereasapplicationswherematerialflexibilityis
important,suchasinfilmsusedforpackaging,requirethattheT
g
bebelow
roomtemperature.
Althoughwecanuseobservationsofthechangeinmechanicalproperties
asameansofmeasuringT
g
,wealsofindthatthermodynamicpropertieschange
slopeongoingthroughtheglasstransition.Thus,ifweplotthevolumeofa
sampleoritsenthalpyasafunctionoftemperature,behaviordepictedqualita-
tivelyinFigure12.10isobserved:Theslopeintheliquidphaseislargerthanthe
slope in the solid phase. By contrast, for a crystalline solid, there would be a
discontinuity or jump in the value of these thermodynamic variables at the
crystalline melting point. Note that all polymers exhibit a T
g
, but only crystal-
lizable ones show a T
m
(melting temperature); the latter phenomenon is called a
first-order transition, whereas the former is called a second-order transition.
Clearly, the specific heat of the rubbery phase exceeds that of the glassy phase.
The exact temperature where the change in slope occurs, though, depends on the
cooling rate, and we obtain a range, albeit a narrow one, for the transition
temperature. This happens because the rearrangement of polymer molecules into
a glassy structure is a kinetic process. The greater the time available for the
transition is, the more orderly the packing and the lower the observed T
g
. This
effect, however, is reversed on rapid heating, and the slowly cooled material
overshoots the original T
g
. This change in T
g
can be related to the free volume
Mechanical Properties 497
Copyright © 2003 Marcel Dekker, Inc.
mentionedinChapter2.Torecapitulate,thepolymerfreevolumeisthedifference
inthesamplevolumeandtheactualvolumeoccupiedbytheatomsand
molecules.Thefreevolumeiszeroatabsolutezerotemperatureanditincreases
asthetemperatureincreases.Slowcoolingallowsforacloserapproachto
equilibriumandalowerfreevolumerelativetomaterialsubjectedtorapid
cooling.Thus,theslowlycooledsamplehastobeheatedtoahighertemperature
inorderthattherebeenoughfreevolumeforthemoleculestomovearound,and
thisimpliesahigherT
g
.InadditiontochangesinT
g
withcoolingrate,wealso
observevolumerelaxationwhenapolymersamplethatwasrapidlycooledis
subsequentlyheatedtoatemperatureclosetoT
g
andheldthereforsometime.
Materialshrinkagealsooccurs,accompaniedbychangesinthemechanical
propertiesofthesolidpolymer.Thephenomenonisknownasphysicalaging
[15]andisthesubjectofconsiderableresearchbecauseofitsinfluenceon
propertiessuchascreep[16].
Theglasstransitiontemperatureofapolymerdependsonanumberof
factors,includingthepolymermolecularweight.Themolecular-weightdepen-
dencecanbeseeninFigure12.11,wheretheT
g
ofpolystyreneisplottedasa
functionofthenumber-averagemolecularweight[3,17].Thesedatacanbe
representedmathematicallybythefollowingequation[18]:
T
g
¼T
g1
K
MM
n
ð12:3:1Þ
ThisvariationofT
g
withmolecularweightcanagainberelatedtothefreevolume
[19].Asthemolecularweightdecreases,thenumberdensityofchainends
increases.Becauseeachchainendisassumedtocontributeafixedamountoffree
FIGURE12.10Variationofvolumeorenthalpyofpolymerswithtemperature.
498Chapter 12
Copyright © 2003 Marcel Dekker, Inc.
volume,thetotalfreevolumeincreasesonloweringthemolecularweight,which
explainsthedataofFigure12.11.Onincreasingthechainlengthbeyondacertain
value,thecontributionofchainendsbecomesnegligibleandT
g
becomes
constant.
Ifitisassumedthattheratioofthevolumeofthepolymerchainsegment
thatmovestothefreevolumeassociatedwiththatsegmentisthesameforall
polymersattheglasstransitiontemperature,thevariationofT
g
withchemical
structurebecomeseasytounderstand[19].Anystructuralchangethatincreases
thesegmentalvolumerequiresalargerfreevolumepersegmentandresultsina
largerT
g
because,aspreviouslyexplained,thefreevolumeincreaseson
increasingtemperature.Thus,T
g
increasesasaresultofincreasingchain
stiffness,addingstifforbulkysidegroups,andintroducingsterichindrances.
Similarly,hydrogen-bondingraisestheT
g
becausesuchapolymerexpandsless
thananon-hydrogen-bondedpolymeronincreasingtemperature.Consequently,a
highertemperatureisnecessarytogetthesamefree-volumelevel.Finally,the
presenceofplasticizersorlow-molecular-weightadditivesincreasesthefree
volumeandlowerstheT
g
;plasticizerssuchasdioctylphthalateareroutinely
addedtoPVCtoconvertitfromarigidtoamoreflexiblematerial.Theglass
transitiontemperaturesofcommonpolymersarelistedinthePolymerHandbook
[20],andselectedvaluesaregiveninTable12.1.
OneofthemostconvenientmethodsofmeasuringT
g
isthroughtheuseof
adifferentialscanningcalorimeter(DSC)[21].Theprincipleofoperationofthis
instrumentisshownschematicallyinFigure12.12.ADSCcontainstwosample
holders,eachprovidedwithitsownheater.Theactualsampleisplacedinoneof
thesampleholdersinanaluminumpanandtheothersampleholdercontainsan
FIGURE12.11GlasstransitiontemperatureofpolystyreneasafunctionofM
n
as
determined by various methods: (s) and (d) dilatometry, (j) Differential thermal analysis
(DTA), (u) differential scanning calorimetry, () electron spin resonance. (From Ref. 3.)
Mechanical Properties 499
Copyright © 2003 Marcel Dekker, Inc.
emptypan.Thetemperatureofboththesampleholdersisincreasedataconstant
rate,suchas10
C=min,andwemeasurethedifferenceintheenergyHsupplied
tothetwopanstokeepthematthesametemperatureatalltimes.Fromanenergy
balance,itisobviousthattherateofdifferentialheatflowmustbeasfollows:
dH
dt
¼mc
p
dT
dt
ð12:3:2Þ
wheremisthemassofthesample(typicallyafewmilligrams),c
p
isthespecific
heat,anddT=dtistheprogrammedrateoftemperatureincrease.
Ifthespecificheatincreasesonheatingthepolymersamplethroughthe
glasstransitiontemperature,dH=dtmustgofromoneconstantvaluetoahigher
constantvalueatT
g
.Thus,T
g
canbeidentifiedbyplottingdH=dtasafunctionof
theinstantaneoussampletemperature.Thisisusuallydoneusingathermogram
ofthekindshowninFigure12.13forasampleofamorphousnylon.Ifthe
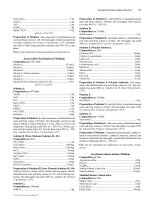
TABLE 12.1 Glass Transition Temperature of
Common Polymers
Polymer T
g
ð
CÞ
Natural rubber (polyisoprene) 70
Nylon 6 (dry) 100
Nylon 66 50
Polycarbonate of bisphenol A 157
Polyethylene 38 to 33
Polyethylene oxide 70
Polyethylene terephthalate 67
Polymethyl methacrylate 105
Polypropylene 15 to 3
Polystyrene 80–100
Polyvinyl chloride 70–100
Styrene–butadiene rubber 64 to 59
FIGURE 12.12 Schematic diagram of a differential scanning calorimeter.
500 Chapter 12
Copyright © 2003 Marcel Dekker, Inc.
polymer is semicrystalline, it must be quenched from the melt state rapidly to give
a wholly amorphous structure; otherwise, the presence of crystals can impede the
motion of polymer chains and result in a T
g
value that is higher than the true
value. For some very crystallizable polymers such as nylon 66, amorphous
samples cannot be obtained and a DSC fails to even pick up a glass transition. In
such a case, we turn to dynamic mechanical analysis, wherein a polymer sample,
whether glassy or rubbery, is deformed in an oscillatory manner (in tension or
shear, as appropriate) such that the maximum strain amplitude is infinitesimal in
magnitude.
12.4 DYNAMIC MECHANICAL EXPERIMENTS
If a polymer is subjected to a sinusoidal strain g of infinitesimal amplitude g
0
and
fixed frequency o,
g ¼ g
0
sin ot ð12:4:1Þ
then the stress response t will be linear (i.e., sinusoidal) but will, in general, be
out of phase by an angle d and have a different amplitude t
0
. Thus,
t ¼ t
0
sinðot þ dÞð12:4:2Þ
or
t ¼ðt
0
cos dÞsin ot þðt
0
sin dÞcos ot ð12:4:3Þ
FIGURE 12.13 DSC thermogram of an amorphous nylon (T
g
¼ 153
C).
Mechanical Properties 501
Copyright © 2003 Marcel Dekker, Inc.
On dividing the stress by the strain amplitude, one obtains the modulus G as
G ¼ G
0
ðoÞsin ot þ G
00
ðoÞcos ot ð12:4:4Þ
where G
0
¼ t
0
cos d=g
0
and G
00
¼ t
0
sin d=g
0
. The term G
0
, called the storage
modulus, is the in-phase component of the modulus and represents storage of
energy, whereas G
00
,theloss modulus, is the out-of-phase component and is a
measure of energy loss. The ratio of the loss to storage modulus, G
00
=G
0
,istand
and is an alternate measure of energy dissipation. One may conduct dynamic
experiments in an isochronal manner by varying the temperature at a fixed
frequency, or in an isothermal manner by varying the frequency at a fixed
temperature. The former kinds of experiment are discussed in this section,
whereas the latter are considered in the next section.
For a perfectly elastic material, stress and strain are always in phase and G
0
equals the elastic modulus and G
00
is zero. For viscoelastic polymers, on the other
hand, the work of deformation is partly stored as potential energy, and the
remainder is converted to heat and shows up as mechanical damping. This is
independent of the mode of deformation, which could be extension, shear,
bending, or torsion. If a polymer is glassy, it will act essentially as an elastic
solid and dynamic experiments will allow us to measure the modulus or stiffness.
This value is typically of the order of 10
9
Pa. Similarly, in the rubbery region, the
polymer is again elastic but with a much smaller modulus of the order of 10
6
Pa.
FIGURE 12.14 Polystyrene data: dynamic modulus versus temperature for fractions.
Numbers on curves are fraction numbers. (Reprinted with permission from Merz, E. H., L.
E. Nielsen, and R. Buchdahl: ‘‘Influence of Molecular Weight on the Properties of
Polystyrene,’’ Ind. Eng. Chem., vol. 43, pp. 1396–1401, 1951. Copyright 1951 American
Chemical Society.)
502 Chapter 12
Copyright © 2003 Marcel Dekker, Inc.
Thus,aplotofstoragemoduluswithtemperaturewillmirrortheplotofYoung’s
modulusversustemperatureandallowustodeterminetheglasstransition
temperature.Figures12.14and12.15showtypicaldataforthestoragemodulus
andtandvaluesofvariouspolystyrenefractionsasafunctionoftemperature.The
frequencyrangehereis20–30Hz.Asexpected,theglasstransitiontemperatureis
approximately100
C.NotethatbothG
00
andtandgothroughamaximumatthe
T
g
becausetheabilityofaspringtostoreenergydependsonitsmodulus[22].On
passingthroughtheT
g
,thepolymergoesfromastiffspringtoasoftonethat
cannotstoreasmuchenergy.Thedifferenceinenergyisdissipatedinthe
transitionfromtheglassytotherubberystates.NotethatT
g
measuredusing
dynamicmechanicalanalysisisusuallyslightlylargerthanthatmeasuredusinga
DSC.Thisdiscrepancyincreaseswithincreasingfrequencyofoscillation.
Figures12.14and12.15showdataobtainedintensionusingcastfilms
oscillatedwiththehelpofanelectromagneticreedvibratoroperatingat
resonance.Commercialinstrumentsavailabletodayuseforcedvibrationswithout
resonance.Thesearedesirablebecausetheyallowtheusertovarytemperature
andfrequencyoverwideintervals.Forexample,inthedynamicmechanical
thermalanalyzer(DMTA),aninstrumentmadebytheRheometricsCompany,a
barsampleisclampedrigidlyatbothendsanditscentralpointisvibrated
sinusoidallybythedriveclamp.Thestressexperiencedbythesampleis
proportionaltothecurrentsuppliedtothevibrator.Thestraininthesampleis
proportionaltothesampledisplacementandismonitoredbyanonloadingeddy
currenttransducerandametaltargetonthedriveshaft.Inthisinstrument,the
FIGURE12.15Polystyrenedata:mechanicaldissipationfactorversustemperaturefor
fractions. Fractions 1, 4, 9, 29, and 34 were tested. (Reprinted with permission from Merz,
E. H., L. E. Nielsen, and R. Buchdahl: ‘‘Influence of Molecular Weight on the Properties of
Polystyrene,’’ Ind. Eng. Chem., vol. 43, pp. 1396–1401, 1951. Copyright 1951 American
Chemical Society.)
Mechanical Properties 503
Copyright © 2003 Marcel Dekker, Inc.
frequencycanbevariedfrom0.033to90Hzandthetemperaturechangedfrom
150
Cto300
C.Descriptionsofotherinstrumentscanbefoundinthebookby
NielsenandLandel[2].Notethatliquidlikematerialsareoftensupportedonglass
braids[23].
Example12.2:Determinethestorageandlossmoduliofapolymerwhose
mechanicalbehaviorcanberepresentedbytheMaxwellelementshownearlierin
Figure12.4.
Solution:Becausethetotalstraingisthesumoftheindividualstrains,wehave
_
gg¼
_
ss
E
þ
s
Z
SubstitutingforthestrainusingEq.(12.4.1)andrearranginggives
_
ssþ
E
Z
s¼Eg
0
ocosot
whosesolutionfort!1is
s¼
Zg
0
o
2
y
1þy
2
o
2
sinotþ
Zg
0
o
1þy
2
o
2
cosot
wherey¼Z=E.Thus,thestorageandlossmoduliaregivenbythefollowing:
G
0
ðoÞ¼
Eo
2
y
2
1þo
2
y
2
;G
00
ðoÞ¼
Eoy
1þo
2
y
2
Dynamicmechanicalanalysisisanextremelypowerfulandwidelyusedanaly-
ticaltool,especiallyinresearchlaboratories.Inadditiontomeasuringthe
temperatureoftheglasstransition,itcanbeusedtostudythecuringbehavior
ofthermosettingpolymersandtomeasuresecondarytransitionsanddamping
peaks.Thesepeakscanberelatedtophenomenasuchasthemotionofside
groups,effectsrelatedtocrystalsize,anddifferentfacetsofmultiphasesystems
suchasmiscibilityofpolymerblendsandadhesionbetweencomponentsofa
compositematerial[24].Detailsofdatainterpretationareavailableinstandard
texts[1,2,25].Inthenextsection,weconsidertime–temperaturesuperposition,
whichisanotherveryusefulapplicationofdynamicmechanicaldata.
12.5TIME^TEMPERATURESUPERPOSITION
Ifweplotisothermalsheardataforthestoragemodulusasafunctionofthe
circularfrequencyataseriesoftemperatures,weobtainresultsofthetypeshown
inFigure12.16[26].Thepolymerisapolystyrenemeltofnarrowmolecular-
504 Chapter 12
Copyright © 2003 Marcel Dekker, Inc.
weightdistributionattemperaturesfrom130
Cto220
C.Theremarkablefeature
ofthesedataandsimilardataonotherpolymermolecular-weightfractionsor
otherpolymermeltsisthatallofthedifferentcurvescanbemadetocollapseinto
asinglecurvebymeansofahorizontalshift.Thus,ifwemovethecurvefor
180
Ctotheleftuntilitbumpsintothe160
Ccurve,wefindthatitoverlapswith
itnicelyandthecompositecurveextendstolowerfrequencies.Therangeofdata
at160
C,takentobethereferencetemperature,canbeextendedfurthertoward
lowerfrequenciesbyshiftingthe200
Cand220
Ccurvestotheleftaswell.To
makethe130
C,140
C,and150
Ccurveslineupwiththe160
Cdata,though,
thesecurveshavetobemovedtotheright.Thefinalresultisasinglemaster
curve,asshowninFigure12.17.Notethatsometimesthedifferentcurveshaveto
bemovedslightlyintheverticaldirectionaswelltoobtainperfectalignment.
Figure12.17showsmastercurvesfordataonothermolecular-weightfractions
also;themolecularweightsrangefrom8900(curveL9)to581,000(curveL18).
Thereferencetemperatureineachcaseis160
C.Becausechangesintemperature
appeartobeequivalenttochangesinfrequencyortime,theprocessofgenerating
amastercurveiscalledtime–temperaturesuperposition.
FIGURE12.16FrequencydependenceofG
0
fornarrow-distributionpolystyreneL27
(molecular weight 167,000) at various temperatures. (Reprinted with permission from
Onogi, S., T. Masuda, and K. Kitagawa: ‘‘Rheological Properties of Anionic Polystyrenes:
I. Dynamic Viscoelasticity of Narrow-Distribution Polystyrenes,’’ Macromolecules, vol. 3,
pp. 109–116, 1970. Copyright 1970 American Chemical Society.)
Mechanical Properties 505
Copyright © 2003 Marcel Dekker, Inc.
The fact that data at different temperatures superpose allows us to obtain
low-frequency data, which would ordinarily require a significant amount of
experimentation time at a given temperature, by simply making measurements
at a higher temperature. Furthermore, because data at a given frequency at
temperatures lower than the reference temperature correspond to high-frequency
data at the reference temperature, we can think of the high-frequency end of the
storage modulus master curve as modulus data characteristic of the glassy region.
Similarly, data at low frequencies are representative of the viscous flow region,
and the flat central plateau corresponds to the rubbery region. Figure 12.17
reveals, as expected, that the rubbery region becomes progressively larger on
increasing polymer molecular weight, and it disappears entirely for samples
having very low molecular weights, which are below the value needed for
entanglement formation.
On a logarithmic plot, the storage modulus at reference temperature T
R
and
frequency o
R
equals the storage modulus at temperature T and frequency o:
G
0
ðlog o
R
; T
R
Þ¼G
0
ðlog o; TÞð12:5:1Þ
FIGURE 12.17 Master curves of G
0
for narrow-distribution polystyrenes having
different molecular weights. The reference temperature is 160
C. (Reprinted with permis-
sion from Onogi, S., T. Masuda, and K. Kitagawa: ‘‘Rheological Properties of Anionic
Polystyrenes: I. Dynamic Viscoelasticity of Narrow-Distribution Polystyrenes,’’ Macro-
molecules, vol. 3, pp. 109–116, 1970. Copyright 1970 American Chemical Society.)
506 Chapter 12
Copyright © 2003 Marcel Dekker, Inc.
However,becausethedifferencebetweenlogo
R
andlogoisaconstantequalto
loga
T
,wherea
T
iscalledthetemperatureshiftfactor,wehave
G
0
ðoa
T
;T
R
Þ¼G
0
ðo;TÞð12:5:2Þ
andwemustplotG
0
ðoÞversusoa
T
inordertogetthesuperposition.Obviously,
a
T
equalsunityatT
R
andislessthanunityifTexceedsT
R
.
Whenthelogarithmoftheshiftfactorforeachofthedatasetsshownin
Figure12.17isplottedversustemperature,asinglecurveindependentof
molecular weight is obtained, provided that the molecular weight exceeds the
value needed for entanglement formation. This result, shown in Figure 12.18, can
be represented mathematically by the following equation:
log a
T
¼
7:14ðT 160 Þ
112:1 þðT 160Þ
ð12:5:3Þ
If instead of using 160
C as the reference temperature, we use T
g
, the equivalent
form of Eq. (12.5.3) is given by
log a
T
¼
17:44ðT T
g
Þ
51:6 þðT T
g
Þ
ð12:5:4Þ
FIGURE 12.18 The logarithm of the shift factor a
T
plotted against temperature for
narrow-distribution polystyrenes. Large open circles indicate the results for M M
c
,
closed circles for M ¼ 14; 800 (L12), and small open circles for M ¼ 8900 (L9).
(Reprinted with permission from Onogi, S., T. Masuda, and K. Kitagawa: ‘‘Rheological
Properties of Anionic Polystyrenes: I. Dynamic Viscoelasticity of Narrow-Distribution
Polystyrenes,’’ Macromolecules, vol. 3, pp. 109–116, 1970. Copyright 1970 American
Chemical Society.)
Mechanical Properties 507
Copyright © 2003 Marcel Dekker, Inc.
whichisknownastheWLFequation,afterWilliams,Landel,andFerry,whofirst
proposedit[27].Verysurprisingly,theWLFequationhasbeenfoundtodescribe
notonlythetemperaturedependenceofthestoragemodulusofotherpolymers
butalsothetemperaturedependenceoftheshiftfactorsforotherviscoelastic
functions,providedthatthetemperatureliesbetweenT
g
andT
g
þ100
C[28].
Thus,identicaltemperature-shiftfactorsarecalculatedirrespectiveofwhether
oneusesstoragemodulus,lossmodulus,orstressrelaxationdata.TheWLF
equationcanalsobederivedtheoreticallybyappealingtoobservedshear
viscositybehaviorandemployingthefree-volumetheory[26].AboveT
g
and
outsidetherangeofvalidityoftheWLFequation,wecanrepresenttheshift
factorsinanArrheniusform:
a
T
¼exp
E
T
1
T
1
T
R
!
ð12:5:5Þ
whereEisanactivationenergyandRistheuniversalgasconstant.
Becausewecanuselinearviscoelastictheory(seeChapter14andRef.1)
torelateoneviscoelasticfunctiontoanother,theuseofalimitedamountofdata
alongwiththetime–temperaturesuperpositionprinciplemakesitpossibleto
obtainanysmall-strainpropertyofapolymer.
Example12.3:UseFigures12.17and12.18todeterminethestoragemodulusat
200
Cand1rad=secofthepolystyrenefractionlabeledL27.Comparetheresult
withthatobtainedwiththeuseofFigure12.16.
Solution:FromFigure12.18,the valueofa
T
at200
C is 0.013.Thus,oa
T
is
0.013rad=secandlogðoa
T
Þequals1:89.TheuseofFigure12.17thenreveals
thatthecorrespondingvalueofthestoragemodulus isapproximately
2:510
4
dyn=cm
2
.Asexpected,thesameresultisobtainedwhenFigure
12.16isused.
12.6POLYMERFRACTURE
Ifaglassypolymerisstressedveryrapidly orisstressedat atemperaturethatis
significantlybelow itsglasstransitiontemperature,ittendstobreakorfracturein
abrittlemanner(i.e.,without anyplasticorirrecoverabledeformation).Conver-
sely,attemperaturesaboveT
g
,anamorphouspolymertendstodrawdownina
homogeneousmanner and displays large strains before fracturing. At intermedi-
ate temperatures and low rates of deformation, the polymer can yield somewhat
before fracturing or fracture in a ductile manner by neck formation. For anyone
interested in structural applications, it is essential to know how and why polymers
fracture in the glassy region. After all, stiffness and strength are two of the main
508 Chapter 12
Copyright © 2003 Marcel Dekker, Inc.
criteriausedinevaluatingthepotentialutilityofamaterialforload-bearing
applications.
Thetheoreticalstrengthofapolymercanbeestimatedbasedonknown
valuesofinteratomicforcesandsurfaceenergies,andtheresultformost
materialsisanumberbetween10
6
and10
7
psi[29].AnexaminationofFigure
12.6,however,revealsthatthistheoreticalstrengthisacoupleofordersof
magnitude larger than the experimentally observed tensile strength of polystyr-
ene. A clue to the reason for this discrepancy between theory and practice is
provided by the behavior of glass fibers, which can be manufactured to near-
theoretical strengths provided that care is taken to ensure that the fiber surface is
smooth and free of imperfections. Indeed, as explained by the classical Griffith
theory [30], it is the presence of small surface cracks that is responsible for the
reduction in tensile strength of glasses.
To understand why tensile strength is not a material property like the
modulus but depends, rather, on sample preparation, consider the situation shown
in Figure 12.19. A flat sheet of glassy polymer of width w and containing an
elliptical crack is in plane strain under the influence of stress s
11
. The major axis
of the ellipse has a length 2c, whereas the minor axis has a length 2h. Even
though the stress distribution is not influenced by the presence of the crack at
positions far from the crack, near the crack itself, and in particular at the crack tip,
the stress can be significantly greater than the average imposed stress s
11
. Using
elasticity theory [31], it is possible to show that the maximum stress occurs at the
FIGURE 12.19 Crack propagation in a glassy polymer.
Mechanical Properties 509
Copyright © 2003 Marcel Dekker, Inc.
edgeoftheellipseatpointsAandBandtendstocausethecracktoopenup.The
valueofthismaximumstressisgivenbythefollowingexpression:
s
m
¼s
11
1þ
2c
h
ð12:6:1Þ
Becausecistypicallymuchgreaterthanh,s
m
=s
11
equals2c=h.Thus,the
localizedstressdependsonthecracklengthandcanbegreaterthantheaverage
stressbyordersofmagnitude;thelargerthecracklengthis,thegreaterthestress
concentration.
Becausemicroscopicsurfacecracksaretheinevitableresultofanypolymer
processingoperation,itisimportanttoknowwhetherornotaparticularcrack
willgrowandleadtospecimenfractureundertheinfluenceofanappliedstress.
ReturningtothesituationdepictedinFigure12.19,wefindthatcrackpropaga-
tion results in elastic energy being released from regions of the sample above and
below the broad surface of the crack, because these experience a decrease in
strain [30]. However, new surfaces are simultaneously created, and there is an
energy cost associated with this. Consequently, the crack grows only if there is a
net release of energy. By equating the release of elastic energy to the loss of
surface energy, we find that the critical stress for crack propagation is as follows:
[30]:
ðs
11
Þ
c
¼
ffiffiffiffiffiffiffiffiffiffiffiffiffiffiffiffiffiffiffiffiffi
2gE
pð1 n
2
Þc
s
ð12:6:2Þ
where g is the specific surface energy, E is the Young’s modulus, and n is
Poisson’s ratio.
Equation (12.6.2) clearly shows that the critical stress for crack growth
depends on the largest crack and varies inversely as the square root of the crack
length. Thus, fracture occurs at progressively smaller stress values as the crack
length increases. Also, once crack propagation begins, the process results in
catastrophic failure. Although Eq. (12.6.2) has been verified by Feltner by
subjecting polymethyl methacrylate to cyclic deformation [32], critical stress
values, in general, are underpredicted to a significant amount by this equation.
The reason this happens is that energy is also taken up in plastic deformation of
the region ahead of the crack tip, which is equivalent to having a larger value of
the specific surface energy. This phenomenon is called crazing and occurs only
under tensile loading. Quantitatively, we can account for crazing by using a larger
value of g in Eq. (12.6.2). Because plastic deformation requires a considerable
absorption of energy, we find that the energy required to propagate a crack is
almost totally used in promoting viscous flow.
Example 12.4: Estimate the critical crack length using Eq. (12.6.2) and physical
property values characteristic of glassy polymers.
510 Chapter 12
Copyright © 2003 Marcel Dekker, Inc.
Solution:Ifweletðs
11
Þ
c
be410
8
dyn=cm
2
,g¼100dyn=cm,E¼
310
10
dyn=cm
2
,andn¼0:3,wefindthat
c¼
2gE
pð1n
2
Þðs
11
Þ
2
c
¼
2100310
10
3:1420:911610
16
¼1:3110
5
cm¼0:131mm
Fromeverydayexperiencewithplasticmaterials,weknowthatthiscalculated
valueisunrealisticallylow.Indeed,gneedstobetakentobeoftheorderof10
5
–
10
6
ergs=cm
2
toobtainagreementwithexperimentaldata[2].
12.7CRAZINGANDSHEARYIELDING
Nonlinearitiesinthestress–straincurveofaglassypolymerusuallyindicatethe
presenceofirrecoverabledeformation.Althoughtheextentofyieldingdepends
onthetesttemperatureandtherateofstrain,itisgenerallytruethatmostglassy
polymersdoshowsomeamountofplasticflowbeforefracture.Thisplasticflow
contributestothetoughnessofthepolymerand,forthisreason,isadesirable
featurethatneedstobeexaminedandunderstood.Thefirstpointtonoteisthat
eveninasamplethatisloadedintension,theyieldingcouldbeinshear.Ifthe
testpieceshowninFigure12.20issectionedalongthedottedline,then,from
equilibrium,thestresssactingontheplanethatmakesanangleywiththe
horizontalisgivenby
s¼s
zz
cosyð12:7:1Þ
anditcanberesolvedintoacomponents
n
normaltothesurfaceands
s
parallel
tothesurface,
s
n
¼s
zz
cos
2
yð12:7:2Þ
s
s
¼s
zz
cosysinyð12:7:3Þ
and,dependingontheshearstrength,deformationmaytakeplaceindirections
otherthanalongthetensileaxis.Althoughthinfilmsofpolystyreneshownormal
stressyieldingorcrazingwhenstrainedintensioninair,thosemadefrom
polycarbonaterarelyexhibitcrazingunderthesametestingconditions[33].
Instead,theyshowshearyielding.Stillotherpolymerssuchaspolystyrene–
acrylonitrileshowbothmodesofdeformation.
Acraze,thoughnotacrack,lookslikeacrackandis,infact,aprecursorto
acrack.Itrunsperpendiculartotheloadingdirectioninauniaxialtensiletest,as
seeninFigure12.21[34].Unlikeacrack,acrazecansupportaloadbecauseits
two surfaces are bridged by a multitude of fine fibers ranging in diameter from 5
Mechanical Properties 511
Copyright © 2003 Marcel Dekker, Inc.