Handbook of Materials for Product Design Part 8 ppsx
Bạn đang xem bản rút gọn của tài liệu. Xem và tải ngay bản đầy đủ của tài liệu tại đây (984.6 KB, 80 trang )
Natural and Synthetic Rubbers 6.3
6.2 Properties of Polymers
Both rubbers and plastics are in the family of
polymers,
a term from
the Greek meaning
many units
. Table 6.1 shows how properties
change as an increasing number (
n
) of repeating units (CH
2
-CH
2
) are
joined to form a high-molecular-weight (MW) polymer.
As the number of units joined together and the molecular weight in-
crease, the melting and boiling points increase, and the products go
from gases to liquids to waxes. Only at sufficiently high molecular
weight is the polymer capable of high strength to make useful load-
bearing parts.
High-molecular-weight polyethylene (PE) is used to make milk jugs.
The regularity of its structure allows adjacent chain segments to align
in perfect order to form crystals, which are the source of opacity or
cloudiness in articles made from PE. To become rubbery and recover
from large deformation, the amount of crystallinity must be con-
trolled.
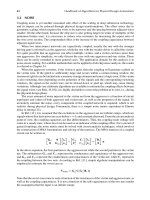
One approach to controlling crystallinity is to add a differently
shaped co-monomer such as propylene. Ethylene propylene co- and
ter-polymers (EPM and EPDM, respectively) are rubber polymers
used in weatherstrip door seals and the white sidewalls of tires. The
optional third monomer in EPDM is a diene that allows crosslinking
by sulfur cure systems. EPM copolymers must be crosslinked with
peroxides (see Fig. 6.2).
Many rubbers are based on diene monomers in which only one of the
two double bonds polymerizes. The double bond remaining in the poly-
TABLE
6.1 Properties of Hydrocarbons -(CH
2
-Ch
2
)
n
-
Chemical name
n
MW Appearance
Melting
point, °C
Boiling
point, °C
Ethane 1 30 gas –183 –89
Butane 2 58 gas –138 0
Hexane 3 86 liquid –95 68
Decane 5 142 liquid –30 174
Eicosane 10 282 grease 38 343
Low-MW PE 25 700 grease 92 dec.
Low-MW PE 75 2,100 wax 106 dec.
High-MW PE 7,500 210,000 solid 120 dec.
06aOhm Page 3 Wednesday, May 23, 2001 10:12 AM
6.4 Chapter 6, Part 1
mer prevents free rotation of the polymer chain and minimizes the
possibility of crystallization. There are two possible isomers, cis and
trans, depending on whether the polymer continues on the same side
(cis) or the opposite side (trans) of the double bond. Normal emulsion
polymerization gives a mixture of cis and trans structures, and no
crystallization occurs in these rubbers.
If the cis or trans content is very high (>90%), then some crystalliza-
tion can occur on stretching, which provides high strength in gum (un-
filled) compounds. Two strain-crystallizing rubbers are shown in Fig.
6.3.
The glass transition is the temperature at which a polymer becomes
stiff and brittle. As such, it determines the low temperature service
limit of rubbers. The effect on glass transition (Tg) as the polymer
composition changes from pure polybutadiene (BR, a rubber) to pure
polystyrene (a plastic) is shown in Table 6.2. Copolymers of 23% sty-
rene and 77% butadiene (SBR) are used in tires.
Crosslinking or joining adjacent polymer chains is necessary to pre-
vent flow. Adhesives and chewing gum are applications of un-
crosslinked rubber. Charles Goodyear used molten sulfur to cure
Figure 6.2 Structure of polyethylene plastic and ethylene propylene rubber.
Figure 6.3 Structure of natural rubber and polychloro-
prene rubber.
TABLE 6.2 Glass Transition of Styrene and Butadiene (Co)polymers
% styrene 0 23 36 53 75 100
% butadiene 100 77 64 47 25 0
Tg, °C –79 –52 –38 –14 +13 +100
06aOhm Page 4 Wednesday, May 23, 2001 10:12 AM
Natural and Synthetic Rubbers 6.5
rubber of its tendency to soften and flow. Elemental sulfur is still the
most widely used means to crosslink or vulcanize rubber. Other cure
systems have been developed over the years to improve certain prop-
erties or to crosslink fully saturated polymers that cannot be
crosslinked with sulfur.
6.3 General-Purpose Rubbers
General-purpose rubbers are low-cost hydrocarbon polymers that find
use in tires as well as other large-volume applications. The 1994 world
consumption of general purpose rubbers is shown in Table 6.3.
Natural rubber (NR)
was the only available rubber for many years.
It is produced primarily in the Far East (Malaysia, Indonesia, and
Thailand), either as a concentrated liquid latex or coagulated, dried,
and baled. Latex is used to make thin-walled articles such as gloves
and balloons. Rubber bales are usually mixed with fillers for tires and
mechanical goods. But NR can also be used unfilled to make translu-
cent articles such as rubber bands and baby bottle nipples.
Articles made from natural rubber possess high strength and abra-
sion resistance and are very resilient with low heat buildup in dy-
namic applications. Their heat resistance is limited, and the rubber
parts are susceptible to attack by oxygen, ozone, and sunlight.
Polyisoprene (IR)
is the synthetic equivalent of natural rubber and
possesses many of the same characteristics and limitations. IR is free
of the nonrubber components contained in NR, including tree proteins
that cause allergic reactions in some individuals. IR is also more con-
TABLE
6.3 Consumption of General-Purpose Rubbers
1
Rubber Abbrev. Commercialized
Consumption,
thousands of
metric tons
Natural rubber NR — 5,403
Styrene butadiene SBR 1941 4,220
Polybutadiene BR 1960 1,473
Polyisoprene IR 1960 982
Ethylene propylene EPDM, EPM 1962 630
Butyl IIR, CIIR, BIIR 1943 558
Total 13,266
06aOhm Page 5 Wednesday, May 23, 2001 10:12 AM
6.6 Chapter 6, Part 1
sistent, whereas NR can vary seasonally, and different Hevea clones
may provide slightly different properties. The nonrubber components
in NR also provide some acceleration, and antioxidant properties that
must be taken into account when compounding IR.
Styrene butadiene rubber (SBR)
was an outgrowth of the war effort
when supplies of NR were cut off. Private companies later purchased
the government rubber production facilities, many of which are still in
operation today.
SBR is offered as a latex or in baled form. The baled rubber can be
pure, clear polymer as well as having carbon black and/or processing
oil incorporated. These low-cost polymers are extensively used in tires
and general mechanical goods. The use of a reinforcing filler is neces-
sary to develop good tensile and tear strength. It may be blended with
NR, IR, or other polymers for cost or performance purposes.
Polybutadiene (BR)
is a polymer of 1,3-butadiene, which can have
varying amounts of cis, trans, and vinyl 1,2 structures incorporated in
the polymer. The pendant vinyl structure can also be incorporated in
different ways, leading to an array of polymers with varying physical
properties and processing characteristics.
Polybutadiene is mainly used in polymer blends, with the major
consumption in tires. High-cis polybutadiene is used in tire compo-
nents because of its high resilience, abrasion resistance, and good flex
fatigue. Polybutadiene with high vinyl content is used in tire treads
for low rolling resistance and good fuel economy. Non-tire applications
include high-impact polystyrene and solid-core golf ball centers.
Butyl rubber
is a copolymer of isobutylene with a few percent of a
cure site monomer. The cure site is typically isoprene (IIR), which may
be halogenated to produce bromobutyl (BIIR) and chlorobutyl (CIIR)
rubbers. Halobutyl rubbers have faster cure rates and so may be
blended and co-cured with high-diene polymers such as NR, SBR, and
BR. Polyisobutylene with a brominated para-methylstyrene cure site
monomer (Exxpro
®
BIMS) has recently been introduced.
The polyisobutylene polymers have improved heat resistance com-
pared to the foregoing high-diene rubbers with double bonds in the re-
peating structural unit. The polymers have low air permeability,
leading to their use in inner tubes (butyl) and tire liners (halobutyl).
Polyisobutylene rubbers also are very energy absorbent, which pro-
vides ideal characteristics for articles in dynamic service.
Ethylene propylene
rubbers may be either a fully saturated copoly-
mer (EPM) or a terpolymer containing <10% of a diene (EPDM),
typically ethylidene norbornene, to enable vulcanization with sulfur
curing systems.
EP rubbers are the largest-volume rubber used in non-tire applica-
tions. They combine the heat resistance of a fully saturated polymer
06aOhm Page 6 Wednesday, May 23, 2001 10:12 AM
Natural and Synthetic Rubbers 6.7
backbone with the ability to use high levels of low-cost fillers and plas-
ticizers. Examples of EP uses are hose, automotive weatherstrip, sin-
gle-ply roofing membranes, and high-temperature-service wire and
cable insulations.
6.4 Specialty Rubbers
Specialty rubbers have chlorine, fluorine, nitrogen, oxygen, or sulfur
incorporated into the repeating structure. These polar atoms provide
resistance to swelling in hydrocarbon fluids such as gasoline and mo-
tor oil. The 1994 world consumption of specialty rubbers is shown in
Table 6.4.
Polychloroprene (CR)
was the first oil-resistant rubber. It may be
likened to natural rubber in which the pendant methyl group is re-
placed with a polar chlorine atom. Like NR, CR has high strength in
unfilled (gum) compounds. Copolymerization with sulfur leads to high
resistance to flex fatigue, whereas using a thiuram polymerization
modifier improves heat resistance. Some grades use 2,3-dichlorobuta-
diene as a co-monomer to obtain resistance to crystallization and
hardening at low temperature.
Polychloroprene is used in adhesives, v-belts, molded goods, and
jackets for electrical wire and cables. Latex grades are available for
dipped goods manufacture or foaming into mattress applications.
TABLE
6.4 Consumption of Specialty Rubbers
1
Rubber Abbrev. Commercialized
Consumption,
thousands
of metric tons
Polychloroprene CR 1931 306
Nitrile-butadiene NBR 1941 252
Polyurethane AU, EU 1945 129
Acrylates/acrylics ACM, EAM 1947 63
Chlorinated/chlorosulfonated
(alkylated) polyethylene
CPE, CSM,
ACSM
1951 54
Silicone MQ, VMQ,
FVMQ
1944 48
Fluorocarbon FKM 1957 24
Others ECO, T, — 36
Total 912
06aOhm Page 7 Wednesday, May 23, 2001 10:12 AM
6.8 Chapter 6, Part 1
Nitrile rubber (NBR)
is a copolymer of butadiene with 20 to 40%
acrylonitrile, typically 33%. Oil resistance increases in proportion to
the amount of acrylonitrile in the copolymer; low-temperature resis-
tance improves in proportion to the amount of butadiene. Nitrile rub-
ber containing carboxyl functionality has exceptionally good toughness
and abrasion resistance. Built-in antioxidants can improve heat resis-
tance, and hydrogenation of the double bonds can maximize high-tem-
perature performance.
Nitrile rubber is used in the tube and cover of fuel hose, curb pump
hose, hydraulic hose, and oil-resistant molded parts. Hydrogenated ni-
trile rubber (HNBR) is used in automotive power transmission belts.
Polyurethane
has exceptional toughness and abrasion resistance.
There are two main types, produced by the reaction of an isocyanate
with a diol, either an ether (EU) or an ester (AU). Ether-based poly-
urethanes have higher resilience and somewhat better low-tempera-
ture and water resistance.
Solid tire applications are a mainstay of polyurethane uses, includ-
ing fork lift tires, caster wheels, and skate wheels. Polyurethanes are
also used to cover rubber rolls and line pumps and pipes in abrasive
service.
Polyacrylates (ACM) and acrylic elastomers (EAM)
have carboxyl es-
ter groups in the repeating structural unit. A small percentage of a
cure site monomer is also incorporated during polymerization. The po-
lar ester group provides oil resistance with the usual sacrifice in low-
temperature resistance.
These polymers are widely used for high-temperature oil seals such
as transmission lip seals and shaft seals. They are energy absorbent
for dynamic applications and are used in wire and cable.
Chlorinated polyethylene (CPE)
has a fully saturated polymer
backbone for improved heat resistance as compared to the first two
oil-resistant polymer families discussed. For crosslinking flexibility,
chlorosulfonated grades (Hypalon
®
CSM and an analog containing
branching, Acsium
®
ACSM) are available.
CPE, CSM, and ACSM are used for improved heat resistance in
hose and belt applications. Colorable compounds can be provided that
are resistant to outdoor exposure.
Silicone rubber (MQ)
has a repeating polymer backbone of alternat-
ing silicon and oxygen atoms. Each silicon atom has two methyl
groups attached. For improved low-temperature properties, some me-
thyl groups are replaced with phenyl groups (PMQ). For crosslinking
with peroxides, a vinyl silicone monomer is incorporated (VMQ). Sili-
cone rubber has the broadest temperature range of any rubber. It is as
good as polybutadiene on the low-temperature side and is superior to
most all hydrocarbon based rubbers on the high-temperature side.
06aOhm Page 8 Wednesday, May 23, 2001 10:12 AM
Natural and Synthetic Rubbers 6.9
The uses of silicone include high-temperature seals and gaskets,
electrical insulation for spark plug and appliance wires, and aerospace
(both aircraft and spacecraft). These take advantage of the broad ser-
vice temperature range.
Fluorocarbon rubber (FKM)
replaces the oxidizable carbon-hydro-
gen bond with a thermally stable carbon-fluorine bond. The polar fluo-
rine atom provides exceptionally good resistance to oils and solvents
that would attack most all other rubbers.
Many fluorocarbon applications involve parts that are small but
provide a critical function. And they are used in applications where no
other material will work, such as flue duct expansion joints. The mod-
ern automobile uses fluoroelastomer-lined hose in fuel-injected en-
gines.
Other rubbers include epichlorohydrin (CO), which is usually a co-
polymer with ethylene oxide (ECO) or a terpolymer containing a sul-
fur or peroxide crosslinking site (GECO); polysulfide copolymers with
ethylene dichloride (T); polynorbornene (PNR); tetrafluouroethylene-
propylene copolymers (Aflas
®
); and fluorosilicone (FVMQ).
6.5 Thermoplastic Elastomers
Thermoplastic elastomers have two phases that are intimately inter-
mixed. One phase is a rubbery phase that provides elastic recovery
from deformation. The other phase is a hard phase that softens and
flows at elevated temperature. Above the melting point of the hard
phase, the polymers will flow and can be shaped. Below the melting
point of the hard phase, the material behaves like a conventional
rubber.
Unlike conventional rubbers, the hard phase can be melted many
times, and the scrap can be recycled. The melting of the hard phase
limits high-temperature service and detracts from compression set.
The 1994 world consumption of thermoplastic elastomers is shown in
Table 6.5.
Styrene block copolymers
have a polystyrene hard phase at each end
of the polymer with a midblock of butadiene (SBS), isoprene (SIS), or
hydrogenated butadiene (SEBS). They are used in footwear and adhe-
sives.
Thermoplastic polyolefins (TEO or TPO)
have a polyolefin hard
phase, typically polypropylene, physically mixed with a rubbery phase
such as EPDM. The rubber phase has little or no crosslinking. TEOs
are used in automotive exterior panels and in lower-temperature wire
and cable applications.
Thermoplastic vulcanizates (TPV)
also have a polyolefin hard
phase with a crosslinked elastomer phase. The crosslinking provides
06aOhm Page 9 Wednesday, May 23, 2001 10:12 AM
6.10 Chapter 6, Part 1
improved resistance to compression set and creep. The improved
temperature resistance permits use in under-the-hood automotive
applications.
Thermoplastic polyurethanes
combine the toughness and abrasion
resistance of urethanes with the ability to be recycled.
Thermoplastic polyesters
have a terephthalate ester hard phase and
soft phase, the difference being the length of the alkylene diol joining
terephthalate groups. The polymers are very stiff relative to conven-
tional rubbers, which allows less material to be used to realize weight
and cost savings. Applications that take advantage of the polymer’s
high strength and flexibility include fuel tanks, gear wheels, and ski
boots.
6.6 Characterizing Heat and Oil Resistance
The heat and oil resistance of natural and synthetic rubbers may be
characterized for automotive applications by a specification system
that has been jointly developed by the American Society for Testing
and Materials (ASTM) and the Society of Automotive Engineers
(SAE). ASTM Test Method D2000, or the corresponding SAE Method
J200, characterizes the heat and oil resistance by the retention of
properties after exposure to a standard time and temperature. The
composition of the oil is well characterized and supplied by ASTM. In
addition to property retention minimums, the volume change upon oil
immersion is a key requirement.
The relative heat and oil resistance for rubbers is shown in Fig. 6.4
according to the ASTM/SAE scheme. Both the heat resistance and oil
resistance of the polymers shown are not absolute, immutable prop-
erties.
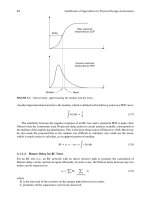
During exposure to high temperature, the properties of the rubber
vulcanizate will continue to change with time. And, within a particu-
TABLE
6.5 Consumption of Thermoplastic Elastomers
1
Rubber Abbrev.
Consumption,
thousands
of metric tons
Styrene block copolymers SBS, SIS, SEBS 294
Thermoplastic polyolefins TEO, TPO, TPV 192
Polyurethane EU 84
Polyester Hytrel
®
30
Total 600
06aOhm Page 10 Wednesday, May 23, 2001 10:12 AM
Natural and Synthetic Rubbers 6.11
lar rubber type, the amount of change may vary to some extent de-
pending on the rubber formulation—particularly the heat resistance
of the cure system and the use of antidegradants. The typical range
and variation with time for three rubbers of different recipes is shown
in Figure 6.5.
The composition of polymer and the immersion fluid affect the vol-
ume swell and change in properties of a rubber compound. This is illus-
trated in Figs. 6.6 and 6.7 for compounds based on nitrile-butadiene
rubber (NBR) and fluoroelastomer (FKM), respectively.
Figure 6.4 Heat and oil resistance per ASTM D200/SAE J200
scheme.
Figure 6.5 Hours to 100% elongation for three rubbers.
06aOhm Page 11 Wednesday, May 23, 2001 10:12 AM
6.12 Chapter 6, Part 1
6.6.1 Initial Physical Properties
The heat and oil resistance encountered in the application helps the
design engineer to select the type of polymer most likely to perform in
the intended application. In addition, the initial physical properties
play a significant role in determining the suitability for use. The
ASTM D2000/SAE J200 system characterizes the basic initial physical
properties across the range of properties shown in Table 6.6. The
durometer A hardness is measured by an indentor of specific radius.
Figure 6.6 Effect of acrylonitrile content on volume change of NBR.
Figure 6.7 Effect of fluorine content on volume change of FKM.
06aOhm Page 12 Wednesday, May 23, 2001 10:12 AM
Natural and Synthetic Rubbers 6.13
The durometer measurement generally correlates to the load-bearing
capability of the rubber article. A tolerance of ±5 durometer A points
from the specified target is typically allowed.
Accuracy declines toward either end of the 0 to 100 durometer A
scale. Because rubber includes soft sponge and extremely hard, plas-
tic-like urethane, other hardness measurements are typically used
for these materials. The OO durometer has a blunter indentor for
sponge; the more pointed D durometer is used for hard rubber. Some
applications use hardness measurements specific to their industry,
such as the Pusey and Jones (P&J) scale in rubber-covered rolls for
paper mills.
Minimum values for the ultimate tensile strength and the elonga-
tion at break are two other basic properties in the ASTM D2000/SAE
J200 system. These two properties are useful to control the uniformity
of a particular compound but generally do not correlate with end-use
performance. At a particular hardness, not all levels of tensile and
elongation may be obtainable.
To measure tensile and elongation, the test specimen is secured in
the jaws of a tensile test machine and stretched at a specified rate un-
TABLE
6.6 Basic Initial Physical Properties of Rubbers
Polymer
Hardness
durometer A
Min. tensile
strength, MPa
Min. elongation
at break, %
NR, IR 30–90 3–24 75–500
SBR, BR 30–90 3–17 75–400
IIR, CIIR, BIIR 30–90 3–17 75–400
EPM, EPDM 30–90 7–17 100–500
T 40 3–7 100–400
CR 30–90 3–24 50–500
AU, EU 40–90 7–28 50–400
NBR 60–90 3–17 50–300
CSM 50–80 7–17 200–400
EAM 50–90 6–14 100–500
ACM 40–80 6–9 100–250
MQ 30–80 3–8 50–400
FVMQ 60 6 150
FKM 60–90 7–14 100–200
06aOhm Page 13 Wednesday, May 23, 2001 10:12 AM
6.14 Chapter 6, Part 1
til it breaks. The final force required for the break is recorded, along
with the amount of stretch that was achieved at the break point. The
forces in effect at various degrees of elongation of the specimen usu-
ally are also recorded. These forces are used to calculate the stresses
per unit area at those elongations, which are reported as tensile mod-
uli. These are typically written as the M-100 (or L-100), which is the
stress at 100% strain, the M-200, M-300, etc.
It is very important to understand that none of these numbers is a
classic modulus, that is, a basic ratio of stress to strain that applies
across a wide range of strains. With the possible exception of a narrow
region of moderately low strain, the stress-strain plot for elastomers is
always nonlinear, and these are secant moduli drawn to various points
of the particular curve that applies at that temperature and rate of
strain. In Figure 6.8, a typical stress-strain plot is displayed, with the
lines drawn on it that illustrate what the secant and tangent moduli
are. (The tangent modulus, which estimates the force required to de-
form the rubber in the strain region of interest, is more meaningful for
many engineering applications but is not commonly used.)
For a few materials, such as steel, a comparatively pure modulus
can be measured that is not a function of strain, temperature, or rate
of strain. It is a single point of information, so to speak, that applies
very broadly. In contrast, the response of rubber (and many other poly-
meric materials) to a deforming force is not a point; it is a three di-
mensional surface, the axes of which are temperature, amount of
strain (deformation), and rate of strain.
What can be said simply about responses of rubber to different con-
ditions is that the material will become stiffer as the temperature
drops or as the rate of strain is increased. There is also the well known
Mullins effect, which says that, for many rubber compounds, the force
Figure 6.8 Stress/strain plot for a rubber specimen.
06aOhm Page 14 Wednesday, May 23, 2001 10:12 AM
Natural and Synthetic Rubbers 6.15
necessary to deform them the very first time will be significantly more
than will be required on subsequent deformations. Also, for moderate
deformations (10–50%), rubber undergoes what engineers refer to as
strain softening;
this means that, as the rubber is forced to deform, it
takes less force per unit of deformation to achieve a high strain than a
lower one. As an example, the dynamic modulus of a compound in
shear at a level of ±10% might be 150 psi, but under the greater strain
of ±20%, that modulus will be less than 300 psi. It will still take more
force to make the rubber deform to the greater strain, but not twice as
much force.
These special characteristics of rubber add up to the important con-
cept. The single-cycle stress-strain curve to rupture of a rubber speci-
men at room temperature cannot generate data with the kind of
meaning that exists in tensile testing other materials—definitely not
the kind of meaning that exists in tensile testing of metals.
6.6.2 Specifying Heat and Oil Resistance
The ASTM D2000/SAE J200 system specifies a maximum change in
properties after heat aging. The allowable change is measured after 70
hours at the maximum service temperature (see Table 6.9 for the test
temperature). The basic change in properties that is permitted is iden-
tical for all rubbers. For particularly severe applications, the allow-
able change in properties after heat aging may be tightened by
incorporating suffix requirements. The basic and most stringent suffix
property changes are summarized in Table 6.7.
For oil-resistant rubbers, the ASTM D2000/SAE J200 system speci-
fies a maximum change in volume after immersion an oil of standard
composition, called ASTM No. 3 oil. (Since the supply of No. 3 oil has
been depleted, testing is currently being performed with its replace-
ment, 903 oil.) The allowable change is generally is measured after 70
hours immersion at the normal maximum service temperature. Above
150ºC, the oil tends to degrade, and immersion tests on higher temper-
ature rubbers are not run above this limit. The basic property is a
maximum volume swell that depends on the specific rubber. Incorpo-
rating suffix requirements that reduce the allowable change on vol-
ume swell and limit the change in physical properties may help
performance in severe oil immersion applications. The basic and most
stringent suffix property changes for immersion in No. 3 Oil are sum-
marized in Table 6.8.
6.7 Other Properties
The heat and oil resistance encountered in the application may not de-
fine all the requirements necessary for successful use. Depending on
06aOhm Page 15 Wednesday, May 23, 2001 10:12 AM
6.16 Chapter 6, Part 1
the particular application, certain additional properties may be re-
quired.
Power transmission belts often require good tear strength and re-
sistance to crack growth during flexing. O-rings and seals generally
specify a maximum compression set, or the allowable unrecovered de-
formation after aging while compressed between two steel plates (see
Table 6.9). Burst strength is an important property in hose. As with
many applications, both part design and polymer selection are impor-
tant for best performance.
Frequently, the attainment of one property involves a trade-off or a
sacrifice in other areas. An example is the balance that must be struck
in tire treads among abrasion resistance, fuel economy, and wet trac-
tion.
Some of the comparative properties of rubbers are shown in Table
6.10. The ratings are only a general guideline, because the specific
TABLE
6.7 Basic and Suffix Heat Resistance of Rubbers
Hardness
∆
, pts. Tensile
∆
, % Elongation
∆
, % max.
Polymer Basic Suffix Basic Suffix Basic Suffix
NR, IR ±15 +10 max. ±30 –25 max. –50 –25
SBR, BR ±15 +10 max. ±30 –25 max. –50 –25
IIR, CIIR, BIIR ±15 +10 max. ±30 –25 max. –50 –25
EPM, EPDM ±15 +10 max. ±30 –20 max. –50 –40
T ±15 +15 max. ±30 –15 max. –50 –40
CR ±15 +15 max. ±30 –15 max. –50 –40
AU, EU ±15 ±5 ±30 ±15 –50 –15
NBR ±15 ±10 ±30 –20 max. –50 –30
CSM
*
±15 ±20 ±30 ±30 –50 –60
EAM ±15 +10 max. ±30 –30 max. –50 –50
ACM ±15 +10 max. ±30 –30 max. –50 –40
MQ ±15 +10 max. ±30 –25 max. –50 –25
FVMQ
*
±15 +15 max. ±30 –45 max. –50 –45
FKM ±15 +10 max. ±30 –25 max. –50 –25
*
Suffix heat aging determined at 25°C above basic requirements.
06aOhm Page 16 Wednesday, May 23, 2001 10:12 AM
Natural and Synthetic Rubbers 6.17
compounding, processing, and part design can affect actual perfor-
mance.
For example, electrical properties are highly dependent on the type
of filler used. The addition of nonconductive mineral fillers is em-
ployed in wire and cable insulations for high resistivity and good di-
electric strength. Conversely, the use of high-structure carbon blacks
achieves antistatic or electrical conductive properties to drain static
charges from walk-off mats and mouse pads. Electrical conductivity
versus carbon black concentration in EPDM is shown in Figure 6.9 for
four high-structure blacks.
Another example of the general nature of the ratings shown in Table
6.10 is the resistance to hydrocarbons and oils. Crankcase lubricants
are based on paraffinic hydrocarbon base oils. The fully formulated lu-
bricant may contain about 20% functional additives that improve spe-
cific performance properties: lower friction, increased viscosity index,
dispersancy and/or detergency provided, etc. These additives can at-
tack certain rubbers that one might expect to be impervious to the
base oil itself. In any contemplated use, the rubber part should be ex-
perimentally tested under actual use conditions before adoption in
production.
TABLE
6.8 Basic and Suffix No. 3 Oil Resistance of Rubbers
Vol.
∆
, % max.
Hardness
∆
,
pts. (suffix)
Tensile
∆
,
% max. (suffix)
Elong.
∆
,
% max. (suffix)Polymer Basic Suffix
CR +120 +80 –10 to +15 –45 –30
CSM +80
EAM +80 +50 –50 –50
MQ +80 +60 –30 max.
AU, EU +40 0 to +6 –10 to +5 –35 –40
ECO +30 0 to +15 –5 to +10 –10 –50
ACM ±30 +25 –20 max. –40 –30
T +10 — –5 to +10 –30 –50
NBR +10 0 to +5 –10 to +5 –20 –30
FVMQ +10 0 to +10 0 to –10 –35 –30
FKM +10
06aOhm Page 17 Wednesday, May 23, 2001 10:12 AM
6.18 Chapter 6, Part 1
6.7.1 Rubber in Motion
When rubber is deformed and then allowed to recover, not all the en-
ergy input is recovered. That is, rubbers are not purely elastic but ex-
hibit a significant viscous component that can be used for energy
management purposes. The ratio of elastic to viscous response depends
on several factors: temperature, frequency, strain amplitude (both
static and dynamic), the particular polymer, and how it is compounded.
To characterize rubber’s dynamic response, it is helpful to examine
both purely elastic and purely viscous responses as shown in Figure
6.10. In the deformation of a purely elastic Hookean spring, there is a
linear response of stress to strain. The ratio of stress to strain does not
change, no matter how rapidly the strain is applied. Metal springs
typically exhibit Hookean elasticity.
TABLE
6.9 Basic and Suffix Compression Set of Rubbers
Compression set, % max.
Polymer Test temp., °C Basic Suffix
NR, IR 75 50 25
T755050
SBR, BR 100 50 25
IIR, CIIR, BIIR 100 50 25
CR 100 80 35
AU, EU 100 50 25
NBR 100 50 25
CSM 125 50
*
60
ECO 125 50 25
EPM, EPDM 150 60 60
EAM 175 75 50
ACM 175 75 60
FVMQ* 200 50 —
MQ 225 50 25
FKM 250 35 15
*
Compression set determined at 70°C.
06aOhm Page 18 Wednesday, May 23, 2001 10:12 AM
Natural and Synthetic Rubbers 6.19
TABLE
6.10 Comparative Properties of Rubbers (from Ref. 2)
12 3 45678
ASTM classifications
D1418
D2000
NR
IR
AA
SBR
AA
EPR
EPDM
DA
CR
BC
IIR
AA
BIIR
CIIR
BA
NBR
BK
CSM
CE
Density, mg/m
3
0.93 0.94 0.86 1.23 0.92 0.92 1.00 1.10
Hardness, Shore A 20–90 40–90 40–90 20–95 40–75 40–75 20–95 45–95
Typical tensile strength
Pure gum, MPa 21 7 3 21 10 10 7 14
Pure gum, psi 3000 1000 400 3000 1500 1500 1000 2100
Reinforced, MPa 21 14 21 21 14 14 14 19
Reinforced, psi 3000 2000 3000 3000 2000 2000 2000 2800
Resilience
Room temp. E G VG VG L L G G
Hot E G VG VG VG G G G
Resistance to
Tear E F G G G G F F
Abrasion E G G E G F-G G E
Compression set G G VG F-G F G G F
Weathering E VG E E VG VG F-G E
Oxidation G G E VG E VG G E
Ozone P P E VG G VG P O
Temperature range
High temp. G G E G G VG VG VG
Low temp. E G E G GFGF
Aqueous fluid resistance
Dilute acid E F-G E VG E E G E
Conc. acid F-G F-G G G E G G E
Water VG VG E G VG VG F-G G
Organic fluid resistance
Aliphatic (A) P P P G P P E G
Oxygenated (B) F F G P G G P P
Chlorinated (C) P P P P-F P P P-F P-F
Aromatic (D) P P P F P P G F-G
Fuels (E) P P P G P P E E
Fats and oils (F) P-G P-G G G VG VG E G
Permeability F F F-P L VL VL L L
Flame resistance P P P G P P P F-G
Dielectric properties E G E VG G-E VG P E
A = hexane, isooctane, etc., B = acetone, methyl-ethyl ketone, etc., C = chloroform, etc., D = toluene,
xylene, etc., E = kerosone, gasoline, etc., F = animal and vegetable oils.
06aOhm Page 19 Wednesday, May 23, 2001 10:12 AM
6.20 Chapter 6, Part 1
TABLE 6.10 Comparative Properties of Rubbers (Continued)
9 10 11121314 1516
ASTM classifications
D1418
D2000
CO
ECO
CH
CM
BC
ACM
EH
AU
EU
BG
T
AK
MQ
GE
FKM
HK
FVMQ
FK
Density, mg/m
3
1.27–1.36 1.16–1.32 1.09 1.02 1.20 1.1–1.6 1.85 1.47
Hardness, Shore A 40–90 40–95 40–90 60–95 20–80 10–85 60–95 40–70
Typical tensile strength
Pure gum, MPa –– 10 3 42 1 1 14 ––
Pure gum, psi –– 1500 400 6000 200 200 2000 ––
Reinforced, MPa 14 14 12 42 9 8 14 10
Reinforced, psi 2000 2000 1800 6000 1300 1100 2000 1500
Resilience
Room temp. P-F F L L-G F VG L G
Hot P-F F VG G F-G VG VG VG
Resistance to
Tear F G P O P P F P
Abrasion G VG F O P-F P G P
Compression set F VG G F F VG VG VG
Weathering E E E E E E E E
Oxidation VG E E G E E O E
Ozone VG E G E E E O E
Temperature range
High temp. E VG E G F-G O O O
Low temp. F-G G P P-G E O P-G O
Aqueous fluid resistance
Dilute acid G VG F P G F E E
Conc. acid F VG F P P F E G
Water G G P P F G VG VG
Organic fluid resistance
Aliphatic (A) G G E E E P E E
Oxygenated (B) P P P P-F F F P P
Chlorinated (C) P-F P P P-F P-F P-F E G
Aromatic (D) G F F F-G VG P E E
Fuels (E) E G G G E F E E
Fats and oils (F) E G VG E G F E E
Permeability L L L L L F L F
Flame resistance F-P G P F P F G G
Dielectric properties G G F F F-G E G G
A = hexane, isooctane, etc., B = acetone, methyl-ethyl ketone, etc., C = chloroform, etc., D = toluene,
xylene, etc., E = kerosone, gasoline, etc., F = animal and vegetable oils.
06aOhm Page 20 Wednesday, May 23, 2001 10:12 AM
Natural and Synthetic Rubbers 6.21
Viscous behavior is typified by a shock absorber, i.e., a cylinder filled
with a fluid through which a piston is moved. For pure viscous behav-
ior, the fluid must be Newtonian. That is, the fluid will exhibit a linear
response to strain rate and show no dependency on displacement.
The viscoelastic stress/strain response of a typical rubber is shown
in Figure 6.11. Initially, stress increases in response to strain. The
stress will then almost plateau at a level that depends on strain rate.
At higher deformation, the finite extensibility of the polymer chains is
reached, and the curve bends upward toward the break point. This lat-
ter part of the curve can not be readily modeled theoretically, and rub-
bers are generally not used at strains of this magnitude—at least for
long periods of time.
Figure 6.9 Effect of carbon blacks on electrical conductivity in EPDM.
3
Figure 6.10 Elastic and viscous stress/strain responses.
06aOhm Page 21 Wednesday, May 23, 2001 10:12 AM
6.22 Chapter 6, Part 1
The specific contributions of the elastic and the viscous components
can be separated by repeatedly cycling the rubber through a deforma-
tion range as indicated in Figure 6.12. The observed stress response
will lead the strain deformation by a certain amount, the phase angle
δ. With this angle and the force measured at maximum deformation,
the respective elastic and viscous components can be calculated. The
elastic component is in phase with the applied deformation; the vis-
cous component is 90º out of phase. Often, the ratio of the viscous to
elastic components (loss factor or tangent δ) is computed, because it is
related to the amount of kinetic energy that is converted to heat en-
ergy.
When the deformation of rubber occurs to a constant energy, the
hysteresis (heat generated) is equal to tangent δ. When the deforma-
tion is to constant strain, the hysteresis is determined by the product
Figure 6.11 Viscoelastic stress/strain response of rub-
ber.
Figure 6.12 Determining the viscous and elastic components.
06aOhm Page 22 Wednesday, May 23, 2001 10:12 AM
Natural and Synthetic Rubbers 6.23
of the elastic response (E´ if in tension or G´ if in shear) times tangent
δ. Finally, for a constant dynamic stress or load input, hysteresis is
equal to the viscous response (E´´ or G´´) divided by the square of the
complex (observed) response (E* or G*). Because the elastic response
normally is much larger than the viscous response, the constant load
hysteresis is approximated by the ratio of tangent δ to E´ (or G´).
As the temperature is lowered, rubbers become stiff and leather-
like, where the tangent δ goes through a maximum. The maximum in
tangent δ occurs slightly before the rubber transitions to a rigid,
glassy state.
Increasing the test frequency has the same effect as lowering the
temperature. For ideal viscoelasticity, a tenfold increase in frequency
is approximately equal to a 10°C decrease in temperature. Some gum
(unfilled) compounds exhibit nearly ideal viscoelasticity in which time
(frequency) and temperature can be superimposed on a single master
curve of dynamic behavior.
However, the incorporation of fillers complicates the situation, and
ideal viscoelasticity is not observed in these compounds, which are
representative of most rubber articles. The addition of fillers signifi-
cantly increases the low strain dynamic modulus. However, at higher
(1 to 10%) dynamic strain amplitude, the filler network breaks down,
resulting in a rapid decrease in dynamic modulus and a maximum in
tangent δ. At still higher strain amplitudes, the filled compound ap-
proximates the dynamic response of an unfilled gum compound.
The geometric design of the part also determines the dynamic re-
sponse. A shape factor is calculated as the ratio of the loaded area of
the part (A) to the area that is free to deform (L). The shape factor can
be used to estimate various moduli (shear, compression, etc.), spring
rates, and damping coefficients for simple shapes. However, complex
shapes are less readily modeled. In this case, finite element analysis is
applied for static deformation estimations, and dynamic simulations
may be possible in the future.
For a given rubber part, the spring rate (K) and the damping coeffi-
cient (C) characterize the dynamic response. For simple geometries, K
is equal to E´ times A divided by L, where A and L are the loaded area
and the area free to deform. The damping coefficient is the viscous re-
sponse, calculated from E´´ times A and divided by the product of L
times ω, the test frequency. The “C to K ratio” then becomes the E´´ di-
vided by E´ times ω (or tangent δ/ω).
In many applications, the rubber part supports a vibrating machine.
As the speed of the machine changes, it affects the frequency of the vi-
brations that the rubber article partly absorbs and partly transmits.
Transmissibility is the ratio of the transmitted force to the applied
force (T = F
t
/F
a
).
06aOhm Page 23 Wednesday, May 23, 2001 10:12 AM
6.24 Chapter 6, Part 1
The transmitted force is greater than the applied force in the low
frequency attenuation region. The natural or resonant frequency (f
n
)
is determined by the spring rate of the rubber part (K´) and the mass
of the system (M) by the equation
At resonance, transmissibility goes through a maximum that is pro-
portional to the reciprocal of the damping coefficient or tangent δ. (see
Figure 6.13). Normally, it is desirable to design the system so that res-
onance is experienced only occasionally, such as during startup.
In a plot of transmissibility versus frequency (Fig. 6.14), the high-
frequency region is called the isolation region, and transmissibility is
less than 1.0. The spring rate increases with frequency, and the
amount of increase is generally greater with higher damping rubber
compounds. In a log-log plot, the rolloff rate is therefore greater for
lower damping compounds, and they transmit less vibration in the iso-
lation region where the machines are typically designed to operate.
Over time, the flexing of a rubber part can cause fatigue, as evi-
denced by the development and growth of cracks. The fatigue life is
strongly dependent on the dynamic strain (or stress, if deformed to
constant load). In the extreme, a total failure can occur in one cycle.
Alternatively, the part may last indefinitely at very low dynamic de-
formations.
f
n
15.76
K′
W
12⁄
=
Figure 6.13 Transmissibility versus frequency.
06aOhm Page 24 Wednesday, May 23, 2001 10:12 AM
Natural and Synthetic Rubbers 6.25
Generally, higher tearing energy gives longer flex fatigue life, but
the relationship is not always linear. Higher temperatures may
shorten flex life due to lower tear strength of the rubber at elevated
temperature. However, as modulus also declines with an increase in
temperature, if the deformation is to constant strain, less energy is in-
put per cycle, and longer flex life may ensue.
Strain-crystallizing rubbers (such as NR and CR) exhibit longer flex
life if the minimum strain does not go to zero. In this case, it is be-
lieved that crystallites form at the tip of the growing crack, where
maximum strain is encountered. The crystals blunt the crack tip and
force the tear to travel around the crystals.
Both the vulcanization system and the antidegradant package can
affect flex life. In general, flex life improves in going from peroxide to
sulfur-donor to elemental sulfur cures. The use of antioxidants and
antiozonants can improve fatigue life.
A final complication occurs in the measurement of flex fatigue life.
Laboratory tests can have poor correlation with actual application re-
sults. Reproducibility can also be a problem, since crack initiation is
thought to occur at microscopic inhomogenities in the rubber sample,
which depend on how well each test specimen is prepared. To achieve
more reproducible results, the laboratory specimen is often cut or
nicked to measure crack growth rather than crack initiation.
When rubber moves in relation to a contacting surface, wear of the
rubber can occur. Again, laboratory tests generally do not correlate
well with application results, because the loss of rubber from the sur-
face depends on the service conditions, which typically vary with time,
temperature, frequency, strain, etc.
Figure 6.14 Transmissibility in the high-frequency isolation region.
06aOhm Page 25 Wednesday, May 23, 2001 10:12 AM
6.26 Chapter 6, Part 1
The mechanism by which wear or loss of rubber occurs depends on
service conditions. Sliding abrasion, such as observed with a tire
tread, is caused by hard surface projections cutting the rubber. Im-
pingement abrasion, such as encountered in a sandblasting hose, is
due to high-speed particles impacting the rubber. Less frequently en-
countered is adhesive wear in which rubber particles are transferred
to another surface because of high adhesion to the surface.
Sliding abrasion can be improved by adding reinforcing carbon
blacks of small particle size to the rubber compound. Generally, there
is an optimal level of carbon black that depends on the specific
black(s), polymer(s), and operating conditions. On the other hand, the
resistance to impingement abrasion is often best in unfilled gum com-
pounds.
6.7.2 Friction
Dry rubber surfaces are generally accepted as having high coefficients
of friction, but measurement of COF can be done in many ways (ASTM
D1894 is one method), which will generate very different numbers.
For instance, static COF, the force needed to start movement across a
rubber surface, can be quite high, with levels ranging easily as high as
1 and often appreciably greater, such as 2–4. Dynamic COF, the force
required to maintain movement, is always less and can range from 0.2
up toward 1. It should be noted that actual movement across a rubber
surface is almost always in the mode of a stick-slip process, and usu-
ally the COF is calculated from average force recorded.
Furthermore, many factors affect the frictional force measured,
which include the rubber hardness, the load and speed used in the
test, and the particular material and surface morphology of the sur-
face against which the rubber is pressed. Compounding differences of
polymer type and especially additives (which can bloom to the rubber
surface and act to lubricate or tackify) have major effects. Lubrication
of rubber surfaces by light oils or soapy water can render them very
slippery, with the COF dropping to levels below 0.1 and the disappear-
ance of the stick-slip phenomenon. With all these variables in play, the
determination of frictional properties of any rubber compound should
be carefully considered in light of the actual application and its envi-
ronment.
6.7.3 Permeability
The ability to retain air is a key property of the modern tire and other
articles. Relative to other materials of construction, however, rubber is
relatively permeable to the migration of small molecules.
06aOhm Page 26 Wednesday, May 23, 2001 10:12 AM
Natural and Synthetic Rubbers 6.27
Permeability is mainly determined by polymer, and specifically its
Tg. In general, the higher is the temperature (above Tg), the greater is
the permeability to gases. However, use of plasticizer and the selection
of filler also modify permeability. Plasticizers tend to depress Tg and
therefore increase permeability. Fillers, particularly platy ones such
as talc and clay, can decrease permeability by creating a longer, more
tortuous diffusion path. The permeability of selected rubbers to vari-
ous penetrant molecules is shown in Table 6.11.
6.7.4 Flame Resistance
Being composed of oxidizable carbon and hydrogen, most polymers
will burn. Incorporating antimony oxide (Sb
2
O
3
) and a halogen (typi-
cally at a 1:3 ratio) is a cost-effective method to achieve flame retar-
dance. Polymers such as CR and CPE, as well as halogenated
plasticizers, can supply the halogen source. However, this technique of
Sb
2
O
3
and halogen generates smoke (which can obscure exit signs)
and acid that corrodes electrical equipment (and can be toxic).
Other methods for low-smoke (halogen-free) rubber compounds in-
clude materials that form a glassy char on the surface, such as zinc bo-
rate or phosphate plasticizers, and/or the use of magnesium salts,
such as carbonates or hydroxides, that release carbon dioxide and wa-
ter, respectively. The use of polymers with a high oxygen content, as
well as inorganic fillers such as clay to dilute the oxidizable compo-
TABLE 6.11 Permeability, (10
–9
)(m
2
)/(sec)(Pa), of Some Rubbers to Various Gases
(from Ref. 4)
Gas temp., °C
Helium Oxygen Nitrogen Carbon dioxide
25 50 25 50 25 50 25 50
Butyl rubber
(IIR)
6.3 17.1 0.98 3.98 0.25 1.25 3.89 14.1
Nitrile rubber
(39% ACN)
5.1 14.0 0.72 3.45 0.18 1.07 5.60 22.1
Polychloroprene
(CR-G)
2.96 9.97 0.88 3.50 19.2 55.8
SBR (23%
styrene)
17.3 41.5 12.8 34.0 4.74 14.3 92.8 192
Natural rubber
(NR)
23.4 51.6 17.5 46.4 6.04 19.1 98.3 218
Silicone (VMQ) 395 493 197 276 1580 1530
06aOhm Page 27 Wednesday, May 23, 2001 10:12 AM