Handbook of Materials for Product Design Part 17 pot
Bạn đang xem bản rút gọn của tài liệu. Xem và tải ngay bản đầy đủ của tài liệu tại đây (1.37 MB, 80 trang )
14.34 Chapter 14
rials in addition to corrugated boxes.) Canada has shown similar
growth in recycling, reaching a recovery rate of 45.1% in 1997, up from
19.6% in 1981 and 27.6% in 1990.
42
Manufacture of containerboard is
the largest tonnage use for recovered paper in the U.S. (see Fig.
14.20).
43
The term containerboard refers to both linerboard and me-
dium used in manufacture of corrugated board.
Many other countries around the world historically have had much
higher recycling rates than the United States and Canada. In general,
countries with abundant forest resources have relied less on recycling
than countries without such resources, as would be expected. The
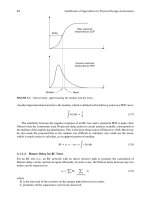
Figure 14.18 Paper and paperboard recycling in the U.S.
41
Figure 14.19 Paper and paperboard recycling in the U.S., by
category.
41
14Selke Page 34 Wednesday, May 23, 2001 10:51 AM
Materials Recycling 14.35
1997 paper recycling rate in Mexico was close to 50%.
44
Recycling
rates for Canada and Japan are summarized in Fig. 14.21.
21,42
Paper
recovery rates for 1995 for some other Asian countries are shown in
Fig. 14.22, and rates for some European countries are shown in Fig.
14.23. It should be noted that not all of this material is recycled;
rather, some is disposed by incineration with energy recovery.
45
The
Figure 14.20 Uses for recycled paper and paperboard in the U.S., 1996.
43
Figure 14.21 Paper and paperboard recycling rates in Japan and Canada.
42,45
14Selke Page 35 Wednesday, May 23, 2001 10:51 AM
14.36 Chapter 14
recycling rates for European countries as a percentage of collected ma-
terial are shown in Fig. 14.24. Recently, the EU has considered impo-
sition of requirements for minimum recycled content in various paper
products. The paper industry has proposed voluntary agreements as
an alternative but, so far, they have not been accepted.
46
Utilization rates for recycled fiber in the production of paper and pa-
perboard materials also vary significantly around the world. In the
Figure 14.22 Paper and paperboard recovery rates in Asia,
1996.
40
Figure 14.23 Paper and paperboard recovery rates in Europe, 1998.
46
14Selke Page 36 Wednesday, May 23, 2001 10:51 AM
Materials Recycling 14.37
U.S., about 80% of all papermakers use some recovered fiber in manu-
facturing, with the average recycled content exceeding 37%, up from
25% in 1988.
41
The historical trend in utilization is shown in Fig.
14.25. The largest category of use by U.S. paper and paperboard mills
is the manufacture of recycled corrugated (Fig. 14.26).
49
In Canada, about 71% of the fiber used in papermaking comes from
recovered paper plus sawmill residues.
42
Regional waste paper utiliza-
Figure 14.24 Paper and paperboard recycling as a fraction of recovery, Europe, 1998.
46
Figure 14.25 Utilization of recovered fiber in U.S. paper and paper-
board mills.
41
14Selke Page 37 Wednesday, May 23, 2001 10:51 AM
14.38 Chapter 14
tion rates for about 1995 are summarized in Fig. 14.27.
48
Figure 14.28
shows the historical pattern in use of domestic and imported pulp and
waste paper in the U.K.
49
Recycled paper, and paper and paperboard, are significant commod-
ities in international trade. Table 14.7 categorizes regions of the world
as net importers or exporters of recovered paper, pulp, and paper prod-
ucts. Of course, there are differences within regions as well as be-
tween regions. In North America, Canada imported about 45% of its
Figure 14.26 Products made from recovered fiber in U.S. paper and paperboard
mills, 1998.
48
Figure 14.27 Regional recycled fiber utilization rates in paper-
making.
49
14Selke Page 38 Wednesday, May 23, 2001 10:51 AM
Materials Recycling 14.39
recovered paper in 1997, almost exclusively from the United States,
and exported about 75% of the paper and paperboard it produced,
mostly to the U.S.
42
The U.S. exported 16% of the paper it recovered
for recycling in 1998, mostly to Canada and the Far East.
41
In West-
ern Europe, Sweden, Austria, Spain, France, and Italy were importers
of recovered paper; Finland, Norway, Portugal, Ireland, Greece, Den-
mark, Belgium, the Netherlands, Germany, and the UK were net ex-
porters in 1997.
43
TABLE 14.7 Net Importers and Exporters of Pulp and Paper
43
Region Paper products Pulp Recovered paper
North America Export Export Export
Western Europe Export Import Export
Eastern Europe and Russia Export Export Import
Oceania and Africa Import Export
Latin America Import Export Import
Asia Import Import Import
Figure 14.28 Domestic and imported pulp and waste paper utilization in the
U.K.
50
14Selke Page 39 Wednesday, May 23, 2001 10:51 AM
14.40 Chapter 14
14.7.2 The Paper Recycling Process
Recycling of paper begins, of course, with collection. Collected mate-
rial may be further separated by grade at the source, at a MRF, or at
truckside, and it then is usually baled for transport. At the recycling
facility, the baled material is deposited in a hydropulper, which breaks
apart the bale and resuspends the fibers using a large tank containing
a blade that provides intense agitation. The removal of contaminants
starts at this point. A ragger hangs into the hydropulper to remove
long stringy objects such as baling wire. A junk remover removes
heavy materials. From the hydropulper, the suspended fibers pass
through a variety of cleaning mechanisms, typically including centrif-
ugal cleaners and various types of screening devices. Centrifugal
cleaners are designed to separate materials by density, removing frac-
tions that are either too light, such as plastic film, or too heavy, such
as staples and stones. Screens or filters are designed to separate mate-
rials by size, removing materials that are too small (such as small fi-
ber fragments and dirt) or too large, (such as large contaminants or
fiber bundles that have not been broken up sufficiently by the repulp-
ing action of the hydropulper and need to be recirculated). Systems
even exist that can separate the long fibers in corrugated originating
in the liners from the short fibers originating in the medium.
High-grade papers intended for applications where white paper is
desired must generally be de-inked to remove previous printing.
Newsprint intended for recycling into new newsprint must also be de-
inked. For corrugated boxes and for other recycled paper streams in-
tended for use in packaging paperboard, de-inking is not usually re-
quired. The predominant de-inking technology is flotation de-inking,
in which chemical treatment combined with generation of air bubbles
is used to remove the ink from the paper fibers and attach it to bub-
bles of air, which convey the ink to the top of the flotation cell, where it
is removed in the form of scum. The presence of clay in the cell facili-
tates the attachment of the ink to the bubbles. This has resulted, in
the U.S., in old magazines (OMG) changing from an undesirable mate-
rial to one that is typically in higher demand than is available. In
newspaper recycling, between 5 and 30% OMG is desired, with the re-
mainder ONP, depending on the mill technology. An 80/20 ratio of
ONP to OMG is about average.
50
After processing, the recovered fiber is usually made into paper im-
mediately, either alone or mixed with virgin fibers, although it can
also be dewatered and baled for shipment to another paper manufac-
turer. The recycling process results in significant shortening and
weakening of the paper fibers. Consequently, the properties of paper
containing recycled fiber are generally somewhat inferior to equiva-
14Selke Page 40 Wednesday, May 23, 2001 10:51 AM
Materials Recycling 14.41
lent paper made from virgin pulp. There is also significant loss of ma-
terial during the recycling and paper-making operation. A rule of
thumb is about 10% of the weight of recovered material delivered to
the papermaker for recycling will be lost if de-inking is not required. If
de-inking is involved, the loss may be about 30%.
The decrease in properties as a consequence of recycling, along with
other considerations, means that paper recycling is largely an open-
loop process, with a significant fraction of the recovered fiber going to
somewhat downgraded applications rather than back to the same use.
Typical applications of various types of recycled paper and paperboard
will be discussed in more detail in the following subsections.
14.7.3 Recycling of Packaging Paper and
Paperboard
As mentioned, nearly half of all paper and paperboard found in U.S.
municipal solid waste originates in packaging, and more than half of
all the paper and paperboard recycled is packaging. Figure 14.29
shows the proportion of types of packaging paper and paperboard
found in the U.S. waste stream in 1997, and Fig. 14.30 shows the pro-
portion of packaging paper and paperboard recycled. As can be seen,
corrugated dominates recovery of paper-based packaging. In fact,
slightly over one-half of all paper materials recovered for recycling in
the U.S. fell into the general category of corrugated. The recycling rate
for corrugated (Fig. 14.31) is significantly higher than that for most
other paper or paperboard materials.
Most corrugated is collected for recycling through retail stores and
businesses, which receive large quantities of goods in corrugated
Figure 14.29 Packaging paper and paperboard in U.S. mu-
nicipal solid waste, 1997.
2
14Selke Page 41 Wednesday, May 23, 2001 10:51 AM
14.42 Chapter 14
boxes. Some is collected from individuals through drop-off centers or
through curbside recycling. However, residential corrugated amounts
to only about 13% of all OCC available for recovery in the U.S. (Fig.
14.32).
51
The recovery rate for OCC from manufacturing, retail, and
commercial facilities was 70–81% in 1995, compared to only about 5%
for residential OCC (Fig. 14.33).
51
Corrugated generated by busi-
Figure 14.30 Recovery of packaging paper
and paperboard in the U.S., 1997.
2
Figure 14.31 Recycling rates in the U.S. by category of paper materi-
als.
41
14Selke Page 42 Wednesday, May 23, 2001 10:51 AM
Materials Recycling 14.43
nesses is often baled on-site for economy in transporting the material.
The business may or may not receive payment from the recycler or
other collector for the material generated.
Corrugated is produced primarily from high-quality Kraft pulp,
which has excellent strength properties. Thus, even after recycling,
corrugated is a valuable source of fiber. The largest use of recycled cor-
rugated is back in the production of containerboard (defined as corru-
gated and related materials) as shown in Fig. 14.34, where it may be
Figure 14.32 Supply of old corrugated containers in
the U.S.
52
Figure 14.33 Recovery rates for OCC in the U.S. by sector.
452
14Selke Page 43 Wednesday, May 23, 2001 10:51 AM
14.44 Chapter 14
used alone or blended with virgin fiber. In 1999, over one-fifth of the
total industry capacity for linerboard manufacture was in facilities us-
ing 100% recycled fiber.
47
Kraft bags, such as grocery sacks and multi-wall bags are, as men-
tioned, included in AFPA’s definition of corrugated. Kraft bags are of-
ten recycled along with corrugated, although their recovery rate is
considerably lower than that of corrugated boxes (Fig. 14.35). Recy-
cling of multi-wall bags is more complex, since many of these bags con-
tain additional materials such as plastic film to enhance strength and
barrier. This makes such bags undesirable in most corrugated recy-
cling programs.
Figure 14.34 Uses of OCC in the U.S.
Figure 14.35 Recycling rates for packaging paper and paperboard in U.S. mu-
nicipal solid waste, 1997.
2
14Selke Page 44 Wednesday, May 23, 2001 10:51 AM
Materials Recycling 14.45
Another undesirable material is corrugated boxes that have been
modified for added strength in humid conditions, such as by wax im-
pregnation, coating with plastic, or modification of the paper structure
through incorporation of thermosetting plastic resins. These materials
present problems in paper recycling operations, either through failing
to repulp properly, adding contaminants to the pulp, or both. Recently,
there have been efforts to press for coding of such boxes to help keep
them out of the recycling stream, while preventing desirable boxes
from being discarded because the generators were fearful that they
contained wax or other undesirable constituents. It has been esti-
mated that as much as 15% of non-waxed boxes generated in grocery
stores were not being recycled because they could not be distinguished
from waxed boxes.
53
The U.S. corrugated industry produces about 1.5 million tons of
waxed boxes per year, about five percent of all corrugated boxes.
54
A
voluntary coding system for wax-impregnated boxes that has been
adopted in North America involves marking them on the box flaps
with the word “wax” in English, Spanish, and French (WAX/CERA/
CIRE). A longer-term solution is the development of repulpable wax,
and considerable research is devoted to this end. Other research is di-
rected at developing recycling mill processes that can separate waxed
fibers from non-waxed fibers. Inland Paperboard and Packaging, Inc.,
of Indiana, and Thermo Black Clawson, of Ohio, have developed a spe-
cial recycling process for waxed boxes called Xtrax. The process uses
reverse screening along with other fiber cleaning techniques to reduce
the wax content in the material from over 30% initially to less than
1% in the end product. Average recycled OCC is reported to contain
about 3% wax, which is acceptable for most grades.
55
The American
Forest and Paper Association maintains an online directory of waxed
corrugated recovery facilities on its web site, www.afandpa.org.
Wet-strength grades of paper, which incorporate thermoset resins,
can be repulped if they are properly identified and sorted by type.
However, few if any recycling opportunities are available for post-con-
sumer wet-strength materials.
Folding cartons and other paperboard packaging are recovered at
significantly lower rates than corrugated. Many of these materials are
manufactured from 100% recycled fiber. Thus, the overall quality of
the potentially recoverable fiber is lower than for corrugated, which
contains, on average, a substantial percentage of virgin fiber. In addi-
tion, because these materials are dispersed in households rather than
being concentrated in businesses, recovery is more expensive. Fewer
curbside and drop-off recycling programs accept these materials, com-
pared to programs accepting corrugated boxes, newspaper, and even
mixed paper “junk mail.”
14Selke Page 45 Wednesday, May 23, 2001 10:51 AM
14.46 Chapter 14
14.7.4 Newspaper and Magazine Recycling
Newspapers are the largest category of non-packaging paper and pa-
perboard found in municipal solid waste (Fig. 14.36) and also the larg-
est category of recovered non-packaging paper and paperboard (Fig.
14.37). In contrast to collection of corrugated, recycling of newsprint is
largely accomplished through collection from individuals, predomi-
nantly through curbside collection. Newsprint is a relatively low-qual-
ity paper, produced primarily through mechanical pulping rather than
through Kraft or other chemical pulping methods. (The American For-
est and Paper Association uses the term groundwood to refer both to
pulp produced by the old stone groundwood process and to that pro-
duced by the more modern thermal mechanical pulping, both of which
are classified as mechanical pulping processes.) These methods result
in a higher than average yield of pulp of lower than average quality.
Consequently, ONP is lower in quality than OCC and more limited in
use. U.S. recycling rates for newsprint are shown in Fig. 14.38.
The largest use of ONP is in the production of new newsprint, usu-
ally in a blend with virgin fiber (Fig. 14.39). As discussed in Sec.
14.1.3, a number of U.S. states have either mandatory requirements
for recycled content in newspapers or have reached voluntary agree-
ments with the newspaper industry, which has had a significant effect
Figure 14.36 Non-packaging paper and paperboard in U.S. municipal solid waste, 1997.
2
14Selke Page 46 Wednesday, May 23, 2001 10:51 AM
Materials Recycling 14.47
on utilization rates. In 1997, use of recycled fiber amounted to about
30% of newsprint production in North America. Many states are push-
ing for 40%, a goal that is not likely to be attained.
51
In the U.K., the
proportion of waste paper used in newsprint reached 52.42% in 1998,
up from 47.43% in 1997. However, because of the effects of imports,
Figure 14.37 Recovery of non-packaging paper and
paperboard in the U.S., 1997.
2
Figure 14.38 Recycling rates for non-packaging paper in the U.S.
2,43,52
14Selke Page 47 Wednesday, May 23, 2001 10:51 AM
14.48 Chapter 14
the overall recycled content of newsprint consumed by UK newspapers
was only 46.54%.
56
In 2000, the UK was considering legislation that
could impose a mandatory recycled content of 80% on newsprint.
57
Newsprint insets are usually also manufactured from mechanical
pulp but often contain clay coating to enhance their printing surface.
These inserts are usually recycled right along with the newsprint. In
the U.S., in 1997, newsprint accounted for 81.2% of the total newspa-
per stream, with inserts making up the remainder. The recycling rate
for newsprint was 56.3%, and for groundwood inserts it was 47.4%.
2
Magazine paper is primarily made from a high-quality grade of me-
chanical pulp (though some is made from chemical pulp) and contains
substantial amounts of clay coating to produce a glossy printing sur-
face. The clay coating, which actually consists of clay plus other min-
erals, may make up as much as 40% of the total weight of the sheet.
58
As discussed in Sec. 14.7.2, this clay is now seen as an asset in de-ink-
ing, so magazines are in high demand, particularly by mills producing
recycled newsprint. Most magazines are collected through curbside
collection and drop-off programs, though there are also office recycling
programs for magazines.
The paper in telephone and similar directories is a low-quality
groundwood fiber, similar to newsprint. However, because of the bind-
ing and glue, it is not generally desirable to mix these materials with
newsprint for recycling. These materials tend to be generated in a
highly seasonal fashion, with large numbers of directories available
for recycling at the time that new directories are distributed, and the
number then falling to very low levels. Therefore, most of such materi-
als that are recycled are collected during seasonal campaigns as a
temporary addition to curbside, drop-off, or office paper recycling pro-
grams.
Figure 14.39 Uses of recycled newsprint in the
U.S.
41
14Selke Page 48 Wednesday, May 23, 2001 10:51 AM
Materials Recycling 14.49
14.7.5 Recycling of Printing and Writing
Paper
The primary collection source of printing and writing paper for recy-
cling is office paper recycling programs. Many offices, in various sec-
tors of the U.S. economy, have a two-tiered collection system for paper:
one high-quality white paper stream and a lower-quality colored or
mixed paper stream. In some cases, newspapers make up a third recy-
cling stream, and occasionally the collection of magazines and tele-
phone directories may be added.
Office paper is predominantly made from high-grade chemical pulp,
so it can be suitable for uses for which Kraft paper and corrugated are
not appropriate, such as the manufacture of new high-grade paper,
providing the paper is properly sorted to remove undesirable materi-
als. Sorting typically begins with source separation. Often, the genera-
tors of office paper are asked.to put the highest-quality white paper
with no adhesives, groundwood paper, or other contaminants, into one
collection bin, and other types of paper with greater tolerance for con-
tamination in another. This stream, or in some cases a single mixed of-
fice paper stream, is sometimes further sorted in an MRF. However,
automated equipment to do this effectively has not yet been devel-
oped, so such sorting is labor intensive and expensive.
Other sources of high-grade paper for recycling include stationary,
books, reports, etc. In many cases, some materials in the category are
manufactured from high-grade chemical pulp, while others are man-
ufactured from lower-grade groundwood pulp. Often, the materials
are collected as part of a mixed paper recycling stream and are di-
verted to low-end uses. Some are collected as part of office paper recy-
cling programs, and others through curbside or drop-off programs.
For example, in the UK, the post office ran a collection program for
old Christmas cards, targeting children at elementary schools.
59
Recycling rates for various high-grade papers are shown in Fig.
14.38, and typical uses for recycled printing and writing paper in Fig.
14.40. The average recycled content in printing and writing paper in
the U.S. was only about 6 to 7% in 1997, down from a high of about
10% earlier in the decade.
60
14.7.6 Contamination Issues
Several different types of contamination are issues for the use of recy-
cled paper. The presence of inks, dyes, or pigments changes the ap-
pearance of recycled paper, generally in undesirable ways. Mixing of
fibers produced by mechanical pulping with fibers produced by chemi-
cal pulping is a concern where the better strength and permanence of
chemically pulped fibers is important. The presence of added materi-
14Selke Page 49 Wednesday, May 23, 2001 10:51 AM
14.50 Chapter 14
als such as waxes and adhesives can detract from the appearance and
from the strength of paper. Adhesives are a particular problem, since
they are so widely used with paper products. In general, pressure-sen-
sitive adhesives present more problems than other types. Efforts are
continuing to develop pressure-sensitive adhesives for applications
such as postage stamps and labels that are more compatible with recy-
cling systems.
14.8 Plastics Recycling
The origins of plastics in MSW in the U.S. are shown in Fig. 14.41.
Figure 14.42 describes the relative proportions of various plastic res-
Figure 14.40 Uses for recycled printing and
writing paper in the U.S., 1998.
41
Figure 14.41 Plastics in U.S. municipal solid waste, by product
category, 1997.
2
14Selke Page 50 Wednesday, May 23, 2001 10:51 AM
Materials Recycling 14.51
ins found in MSW. The overall recycling rate for plastics is generally
considerably smaller than the rates for metal, glass, and paper. In
part, this is due to the shorter history of plastics recycling. It is also
due in part to the greater complexity in recycling plastics, since the
category contains a large variety of different materials, each with its
own characteristics. Since polymers are generally incompatible with
polymers of different chemical type, mixing plastics together indis-
criminately usually produces a material with very poor performance
characteristics. Thus, production of high-value products from recycled
plastics is intimately tied to the ability to separate materials by resin
type. Some markets exist for commingled recycled plastics, as will be
discussed in Sec. 14.8.13, but these are generally considerably lower
in value than the potential markets for single resin recycled materi-
als. Historical trends in recycling rates for plastics in MSW in the U.S.
and in Western Europe are shown in Fig. 14.43. The recycling rates
shown for plastics in Western Europe exclude incineration with en-
ergy recovery. If this option is included, recovery rates increase, rang-
ing from 20% in 1994 to 30% in 1998.
61
In most countries, including
the U.S., recovery of energy is not classified as recycling.
Recycling rates are significantly higher for some plastic materials
than for others, and for some types of plastic products, as will be dis-
cussed in more detail in the following subsections. Many recycling pro-
grams for plastics focus on plastic containers, or even more narrowly
on plastic bottles. The American Plastics Council (APC) calculated the
1996 recycling rate for rigid plastic containers as 21.2%. The rate for
Figure 14.42 Plastics in U.S. municipal solid
waste, by resin, 1997.
2
14Selke Page 51 Wednesday, May 23, 2001 10:51 AM
14.52 Chapter 14
1997 fell to 20.2%, although the tonnage of plastic collected for recy-
cling increased from 1.321 billion to 1.375 billion pounds. Use of virgin
plastic increased at a higher rate, from 6.221 billion to 6.800 billion
pounds during the same period. The APC reported the recycling rate
for plastic bottles as 23.5% in 1998, down from 23.7% in 1997 and
24.5% in 1996. The 1996 recycling rate for flexible plastic packaging
was only 2.8%.
62,63
RECOUP reported that 7,000 tonnes of plastic bottles were collected
in the UK in 1997, a total of 140 million bottles. More than 1 in 3 local
solid waste authorities ran a plastic bottle recycling scheme, including
over 3,000 plastic bottle banks and nearly 2 million homes served by
curbside collection.
64
In Germany, under the DSD Green Dot system, more than 5 million
metric tons of post-consumer plastic packaging was collected in 1995,
79% of the total amount of plastic packaging generated by households
and small businesses. Almost 90% of that came from curbside recy-
cling collection systems, with the remainder coming from drop-off sys-
tems at supermarkets, gas stations, and public buildings.
Slightly less
than 55% of the collected material was recycled, with the remainder
used for energy recovery.
65
How recycling rates are calculated is itself a source of controversy.
There have been charges in the past that surveys that ask recyclers
for data receive inflated figures and thus inflate recycling rates. Sur-
veying organizations take various steps to avoid this problem but can-
Figure 14.43 Plastics recycling rates in the U.S. and Western Eu-
rope.
2,61
14Selke Page 52 Wednesday, May 23, 2001 10:51 AM
Materials Recycling 14.53
not completely eliminate it. On the other hand, some organizations
that do recycling may be missed in the survey, thus decreasing recy-
cling rates. Even if the accuracy of the data could be guaranteed, a
more fundamental problem remains. What should be counted as being
recycled? The two fundamental options are (a) measuring the amount
of material collected for recycling or (b) measuring the amount of ma-
terial actually reused. Since 5 to 15% of collected material is lost dur-
ing processing of the material, mostly because it is some type of
contaminant such as paper labels, product residues, undesired types
of plastic, etc., there is a significant difference in recycling rates be-
tween the two approaches. The American Plastics Council (APC) is the
major source of information about plastics recycling rates in the U.S.
In 1997, APC switched from using the amount of cleaned material
ready for use to the amount of material collected for processing. Their
justification was that the latter method is more in keeping with the
way recycling rates are calculated for other materials. Especially since
this resulted in inflating recycling rates at a time when recycling
rates, if calculated by comparable measures, were declining, this move
brought considerable criticism. For instance, the PET bottle recycling
rate in 1997 was 27.1% if based on material collected but only 22.7%
based on clean material ready for reuse.
66
Criticism of APC was fur-
ther heightened by their decision to restrict distribution of their an-
nual plastic recycling report to APC members. The Environmental
Defense Fund, in response, issued a report titled “Something to Hide:
The Sorry State of Plastics Recycling,” in which they used APC’s num-
bers to highlight the decline in plastic recycling rate that was evident
when 1996 data was compared to 1995 on the same basis. They also
noted that polystyrene food service items were deleted from APC’s def-
inition of plastic packaging, beginning in 1995—a move that further
shored up plastics recycling rates. EDF calculated that the recycling
rate for plastic packaging in 1996 was only 9.5% and would have been
only 8.5% if polystyrene food service items had been included.
62
14.8.1 Processing of Plastics
Three major categories of recycling processes for plastics exist: me-
chanical recycling, chemical recycling, and thermal recycling.
Mechanical, or physical, recycling involves changing the size and
shape of the plastic materials, removing contaminants, blending in
additives if desired, and similar activities that change the appearance
of the recycled material but do not alter (at least not to a large extent)
its basic chemical structure. Common processing steps include grind-
ing, air classification to remove light contaminants, washing, gravity-
based separation of resins that are heavier than water from those that
14Selke Page 53 Wednesday, May 23, 2001 10:51 AM
14.54 Chapter 14
are lighter than water, screening, rinsing, drying, and often melting
and pelletization, perhaps with the addition of colorants, heat stabiliz-
ers, or other ingredients. Mechanical recycling is by far the most com-
mon type of plastics recycling.
Chemical recycling involves using chemical reactions to break down
the molecular structure of the plastic. The products of the reaction
then can be purified and used again to produce either the same or a re-
lated polymer. An example is the glycolysis process sometimes used to
recycle PET, in which the PET is broken down into monomers, crystal-
lized, and repolymerized. Condensation polymers such as PET, nylon,
and polyurethane are typically much more amenable to chemical recy-
cling than are addition polymers such as polyolefins, polystyrene, and
PVC. Most commercial processes for depolymerization and repolymer-
ization are restricted to a single polymer, usually PET, nylon 6, or
polyurethane.
Thermal recycling uses heat to break down the chemical structure
of the polymer. In pyrolysis, for example, the polymer (or mixture of
polymers) is subjected to high temperature in the absence of sufficient
oxygen for combustion, causing the polymer structure to break down.
Thermal recycling can be applied to all types of plastics, addition poly-
mers as well as condensation polymers. The typical yield is a complex
mixture of products, even when the feedstock is a single polymer
resin. If reasonably pure compounds can be recovered, products of
thermal recycling can be used as feedstock for new materials. When
the products are a complex mixture that is not easily separated, the
products are most often used as fuel. There are relatively few commer-
cial operations today that involve thermal recycling of plastics, though
research continues. Germany has the largest number of such facilities,
due to its requirements for recycling of plastics packaging. A consor-
tium of European plastic resin companies, the Plastics to Feedstock
Recycling Consortium, has a pilot plant for thermal recycling in
Grangemouth, Scotland, and hopes to use the technology in a full-
scale commercial plant by late 2000. The system uses fluidized bed
cracking to produce a waxlike material from mixed plastic waste. The
product, when mixed with naphtha, can be used as a raw material in a
cracker or refinery to produce feedstocks such as ethylene and propy-
lene.
67
Sometimes, chemical and thermal recycling are, together, termed
feedstock recycling. Figure 14.44 shows the growth in mechanical and
feedstock recycling in Western Europe between 1994 and 1998.
61
14.8.1.1 Separation and contamination issues. When plastics are col-
lected for recycling, they are virtually never in a pure homogeneous
14Selke Page 54 Wednesday, May 23, 2001 10:51 AM
Materials Recycling 14.55
form. The collected materials will contain product residues, dirt, la-
bels, and other materials. Often, the material will contain more than
one base polymer and resins with a variety of additives, including col-
oring agents. Usefulness of the material is enhanced if it can be
cleaned and purified. Therefore, technologies for cleaning and separat-
ing the materials are an important part of most plastics recycling sys-
tems.
It is useful to differentiate between separation of plastics from non-
plastic contaminants, and separation of plastics of one type from those
of another type. Separation of plastics from non-plastics typically re-
lies on a variety of fairly conventional processing techniques. Typi-
cally, the plastic is granulated, sent through an air classifier to remove
light materials such as label fragments, washed with hot water and
detergent to remove product residues and remove or soften adhesives,
and screened to remove small heavy contaminants such as dirt. If nec-
essary, magnetic separation can be used to remove ferrous metals, and
techniques such as eddy current separators or electrostatic separators
can be used to remove other metals. Many of these techniques were
developed in the minerals processing industries and have been
adapted to use with plastics.
A particular concern for recycled plastics that are to be used in food
contact applications is the potential presence of materials that may be
dissolved in the recycled plastic and later migrate out into a product.
Special care is needed in design of recycling processes to ensure that
potentially hazardous substances do not migrate from recycled plastic
into food products in amounts that might adversely impact human
Figure 14.44 Mechanical and feedstock recycling in Eu-
rope.
61
14Selke Page 55 Wednesday, May 23, 2001 10:51 AM
14.56 Chapter 14
health. Companies desiring to produce recycled resins suitable for food
contact generally challenge the process with known amounts of con-
taminant simulants and then determine whether the processing is
able to adequately remove the contaminants. The U.S. Food and Drug
Administration, while it does not formally approve recycled resins for
food contact, has issued “letters of nonobjection” to a few processes
that have demonstrated, to the satisfaction of the FDA, the ability to
reduce contamination levels below the “threshold of regulation” of
0.5 ppb dietary concentration, which the FDA regards as an accept-
able level of protection for most potential contaminants.
68
Another ap-
proach that has been accepted by the FDA is to interpose a barrier
layer of virgin polymer between the recycled polymer and the food
product. The amount of barrier that is sufficient depends on the mass
transfer characteristics of the polymer and the intended use of the
resin, among other factors.
14.8.1.2 Sorting. Separation of different types of polymers from each
other is often a required or a desired part of plastics recycling pro-
cesses. Such separation procedures can be classified as macrosorting,
microsorting, or molecular sorting. Macrosorting refers to the sorting
of whole or nearly whole objects. Microsorting refers to sorting of
chipped or granulated plastics. Molecular sorting refers to sorting of
materials whose physical form has been wholly disrupted, such as by
dissolving the plastics.
Examples of macrosorting processes include separation of PVC bot-
tles from PET bottles, separation of polyester carpet from nylon car-
pet, and sorting of automobile components by resin type. Much of this
sorting is still done by hand, using people who pick materials off a con-
veyor belt and place them in the appropriate receptacle. However, a
lot of effort has gone into development of more mechanized means of
sorting to make this process both more economical and more reliable,
and the use of such mechanized systems is increasing.
Various devices are now commercially available to separate plastics
by resin type. They typically rely on differences in the absorption or
transmission of certain wavelengths of electromagnetic radiation.
Many of these systems can be used to separate plastics by color as well
as by resin type. For example, the process used at the plastics recovery
facility in Salem, Oregon, which was developed by Magnetic Separa-
tion Systems (MSS) of Nashville, Tennessee, sorts two to three bottles
per second, using four sensors and seven computers to separate plastic
bottles according to resin and color. X-ray transmission is used to de-
tect PVC, an infrared light high-density array to separate clear from
translucent or opaque plastics, a machine vision color sensor to iden-
14Selke Page 56 Wednesday, May 23, 2001 10:51 AM
Materials Recycling 14.57
tify bottle color (ignoring the label), and a near-infrared spectrum de-
tector to identify resin type.
69
Frankel Industries, of Edison, New Jersey, developed a system that
combines manual sorting with differences in optical dispersion and re-
fraction for separating PET and PVC from each other and from PETG
and polystyrene. In this system, a special light shines on containers on
a conveyor, and workers wear special goggles that give the different
resins a distinctive appearance.
70
Particularly for recycling of appliances, carpet, and automobile plas-
tics, several companies have developed equipment to scan the plastic,
usually with infrared light, and compare its spectrum, using a com-
puter, to known types of plastic, resulting in identification of the plas-
tic resin. One such device is the Portasort, developed jointly by Ford
and the University of Southampton, Highfield, Southampton, U.K. It
compares the spectrum of the unknown plastic against a library of 200
or more different polymers. A larger version, called the PolyAna sys-
tem, can identify nearly 1000 different plastics, including blends and
fillers. The same group developed the Tribo-pen, which uses triboelec-
tric technology for plastics identification. This equipment, which has a
sensing device about the size of a small flashlight, was developed for
sorting automotive plastics. It comes in two basic types, the first to
identify nylon, polypropylene, ABS and polyacrylite, and the second
designed for more limited sorting, such as differentiating between PE
and PVC.
71,72,73
The first step in microsorting is a size reduction process, like chip-
ping or grinding, to reduce the plastic articles to small pieces that will
then be separated by resin type and perhaps also by color. One of the
oldest examples is separation of high-density polyethylene base cups
from PET soft drink bottles using a sink-float tank. More modern sep-
aration processes, such as the use of hydrocyclones, also rely primarily
on differences in the density of the materials for the separation.
A number of other attributes have also been used as the basis for
microsorting systems, including differences in melting point and in
triboelectric behavior.
74
In many of these systems, proper control over
the size of the plastic flakes is important in being able to reliably sepa-
rate the resins. Some systems rely on differences in grinding behavior
of the plastics combined with sieving or other size-based separation
mechanisms for sorting. Sometimes cryogenic grinding is used to facil-
itate grinding and to generate size differences.
Systems that use electromagnetic radiation are under development
and have had limited commercial application. SRC Vision, Inc., of
Medford, Oregon, has an optical-based technology, originally devel-
oped for sorting of foods, which is used primarily by large processors
for color-sorting single resins, such as in separating green from clear
14Selke Page 57 Wednesday, May 23, 2001 10:51 AM
14.58 Chapter 14
PET. Union Carbide has used an SRC Vision system to separate col-
ored HDPE flake into red, yellow, blue, green, black, and white prod-
uct streams. The full SRC system uses X-rays, ultraviolet light, visible
light, infrared light, reflectance, a monochromatic camera, and a color
camera that is reported to be able to separate 16 million colors of red,
green, and blue combinations.
74,75
ESM International, Inc. of Hous-
ton, Texas, also has developed an optical-based system.
74
A novel European process being used for separation of plastics from
durable goods separates the materials, including laminated struc-
tures, by blowing them apart at supersonic speeds. Various materials
deform differently, permitting the use of sieving and classifying based
on differences in size, geometry, specific gravity and ballistic behavior,
using fluid bed separators and other equipment.
76
The Multi-Products
Recycling Facility operated by wTe Corporation is designed to recover
engineering plastics (as well as metals) from durable goods. It uses air
classifiers to remove light materials, including foam and fiber, and a
series of sink/float classifiers operating with water solutions at differ-
ent specific gravities to separate chipped plastics by density, as well as
using infrared technology to identify plastics before grinding.
77
KHD
Humboldt Wedag AG in Cologne, Germany, has designed a system for
separation of plastics by density using centrifuges and water or salt
solutions. The intense turbulence in the centrifuges also helps clean
the flaked plastics, as well as dewatering them.
78
Recovery Processes
International, of Salt Lake City, Utah, has a froth flotation system de-
signed to separate PET from PVC.
74
Molecular sorting involves complete destruction of the physical
structure of the plastic article prior to separation of the resins. Such
systems typically use dissolution in solvents and reprecipitation, us-
ing either a single solvent at multiple temperatures or combinations of
solvents. Because of the use of organic solvents, and consequently the
need to control emissions and to recover the solvents, costs of such sys-
tems tend to be high. There is also a concern about residual solvent in
the recovered polymer and its tendency to leach into products. There
are, at present, no commercial systems using this approach.
Some research effort has focused on facilitating plastics separation
by incorporating chemical tracers into plastics, particularly packaging
materials, so that they can be more easily identified and separated.
One such effort, funded by the European Union, has resulted in a pilot
plant for separating PVC, PET, and HDPE bottles using fluorescent
trace compounds that have been incorporated into the bottles.
79
14.8.2 Uses for Recycled Plastic
Recycled plastics are used in a variety of applications, including auto-
mobiles, housewares, packaging, and construction. More information
14Selke Page 58 Wednesday, May 23, 2001 10:51 AM