1999 HVAC Applications Part 13 doc
Bạn đang xem bản rút gọn của tài liệu. Xem và tải ngay bản đầy đủ của tài liệu tại đây (793.19 KB, 28 trang )
Design and Application of Controls 45.3
the sensor malfunctions or is placed in a location that is not repre-
sentative, operating problems will result.
An alternative approach to supply fan control in a VAV system
uses flow readings from the direct digital control (DDC) zone
terminal boxes to integrate zone VAV requirements with supply
fan operation. Englander and Norford (1992) suggest that duct
static pressure and fan energy can be reduced without sacrificing
occupant comfort or adequate ventilation. They compared modi-
fied PI and heuristic control algorithms via simulation and dem-
onstrated that either static pressure or fan speed can be regulated
directly using a flow error signal from one or more zones. They
noted that component modeling limitations constrain their results
primarily to a comparison of the control algorithms. The results
show that both PI and heuristic control schemes work, but the
authors suggest that a hybrid of the two might be ideal.
Supply fan warm-up control for systems having a return fan must
prevent the supply fan from delivering more airflow than the return
fan maximum capacity during warm-up mode (Figure 7).
Return fan static control from returns having local (zoned)
flow control is identical to supply fan static control (Figure 5).
Return fan control for VAV systems provides proper building pres-
surization and minimum outdoor air. Duct static control of the sup-
ply fan is forwarded to the return fan (Figure 8). This open loop (no
feedback) control requires similar supply and return fan airflow
modulation characteristics. The return fan airflow is adjusted at
minimum and maximum airflow conditions. The airflow turndown
should not be excessive, typically no more than 50%. Provisions for
warm-up and exhaust fan switching are impractical.
Airflow tracking uses duct airflow measurements to control the
return air fans (Figure 9). Typical sensors, called flow stations, are
multiple-point, pitot tube, and averaging. Provisions must be made
for exhaust fan switching to maintain pressurization of the building.
Warm-up is accomplished by setting the return airflow equal to the
supply fan airflow, usually with exhaust fans turned off and limiting
supply fan volume to return fan capability. During night cool-down,
the return fan operates in the normal mode.
VAV systems that use return or relief fans require control of air-
flow through the return or relief air duct systems. Return fans are
commonly used in VAV systems to help ensure adequate air distri-
bution and acceptable zone pressurization. In a return fan VAV
system, there is significant potential for control system instability
due to the interaction of control variables (Avery 1986). In a typi-
cal system, these variables might include supply fan speed, supply
duct static pressure, return fan speed, mixed air temperature, out-
side and return air damper flow characteristics, and wind pressure
effect on the relief louver. The interaction of these variables and
the selection of control schemes to minimize or eliminate interac-
tion must be considered carefully. Mixed air damper sizing and
selection are particularly important. Zone pressurization, building
construction, and outdoor wind velocity must be considered. The
resultant design helps ensure proper air distribution, especially
through the return air duct. Using the technique described by Dick-
son, the designer may be able to eliminate the return fan altogether.
Sequencing fans for VAV systems reduces airflow more than
other methods and results in greater operating economy and more
stable fan operation if airflow reductions are significant. Alternation
of fans usually provides greater reliability. Centrifugal fans are con-
trolled to keep system disturbances to a minimum when additional
fans are started. The added fan is started and slowly brought to
capacity while the capacity of the operating fans is simultaneously
reduced. The combined output of all fans then equals the output
before fan addition.
Vaneaxial fans usually cannot be sequenced in the same manner
as centrifugal fans. To avoid stall, the operating fans must be
reduced to some minimum level of airflow. Then, additional fans
may be started and all fans modulated to achieve equilibrium.
Unstable fan operation in VAV systems can usually be avoided
by proper fan sizing. However, if airflow reduction is large (typi-
cally over 60%), fan sequencing is usually required to maintain air-
flow in the fan’s stable range.
Supply air temperature reset can be used to avoid fan instability
by resetting the cooling coil discharge temperature higher (Figure
10), so that the building cooling loads require greater airflow.
Fig. 7 Supply Fan Warm-Up Control
Fig. 8 Duct Static Control of Return Fan
Fig. 9 Airflow Tracking Control
Design and Application of Controls 45.5
thermostat would control a hot water or steam valve to keep water
temperature above freezing.
Economizer Cycle
Economizer cycle control reduces cooling costs when outside
conditions are suitable, that is, when the outdoor air is cool enough
to be used as a cooling medium. If the outdoor air is below a high-
temperature limit, typically 18°C, the return, exhaust, and outdoor
air dampers modulate to maintain a ventilation cooling set point,
typically 13 to 16°C (Figure 16). The relief dampers are interlocked
to close, and the return air dampers to open, when the supply fan is
not operating. When the outdoor air temperature exceeds the high-
temperature limit set point, the outdoor air damper is closed to a
fixed minimum and the exhaust and return air dampers close and
open, respectively.
In enthalpy economizer control, the high-temperature limit inter-
lock system of the economizer cycle is replaced in order to further
reduce energy costs when latent loads are significant. The interlock
function (Figure 16) can be based instead on (1) a fixed enthalpy
upper limit, (2) a comparison with return air so as not to exceed
return air enthalpy, or (3) a combination of enthalpy and high-tem-
perature limits.
VAV warm-up control during unoccupied periods requires no
outdoor air; typically, outdoor and exhaust dampers remain closed.
However, in systems with a return fan (Figure 17), the outdoor air
damper should be positioned at its minimum position, and supply
airflow (volume) should be limited to return air airflow (volume) to
minimize positive or negative duct pressurization.
Night cool-down control (night purge) provides 100% outdoor
air for cooling during unoccupied periods (Figure 18). The space is
cooled to the space set point, typically 5 K above outdoor air tem-
perature. Limit controls prevent operation if outdoor air is above
space dry-bulb temperature, if outdoor air dew-point temperature is
excessive, or if outdoor air dry-bulb temperature is too cold, typi-
cally 10°C or below. The night cool-down cycle is initiated before
sunrise, when overnight outside temperatures are usually the
coolest. When outside air conditions are acceptable and the space
requires cooling, the cool-down cycle is the first phase of the opti-
mum start sequence.
Heating Coil
Heating coils that are not subject to freezing can be controlled by
simple two-way or three-way modulating valves (Figure 11). Steam
distributing coils are required to ensure proper steam coil control.
The valve is controlled by coil discharge air temperature or by space
temperature, depending on the HVAC system. Valves are set to open
to allow heating if control power fails. In many systems, the outdoor
air temperature resets the heating discharge controller.
To provide unoccupied heating or preoccupancy warm-up, a
heating coil can be added to the central fan system. During warm-up
or unoccupied periods, a constant supply duct heating temperature
is maintained and the cooling coil valve is kept closed. Once the
facility has attained the minimum required space temperature, the
central air handler will revert back to the occupied mode.
Heating coils in central air-handling units preheat, reheat, or
heat, depending on the climate and the amount of minimum outdoor
air needed.
Preheating coils using steam or hot water must have protection
against freezing, unless (1) the minimum outdoor air quantity is
small enough to keep the mixed air temperature above freezing and
(2) enough mixing occurs to prevent stratification. That is, even
when the average mixed air temperature is above freezing, inade-
quate mixing may allow freezing air to impinge on the coil.
Steam preheat coils should have two-position valves and vacuum
breakers to prevent a buildup of condensate in the coil. The valve
should be fully open when outdoor air (or mixed air) temperature is
below freezing. This causes unacceptably high coil discharge tem-
peratures at times, necessitating face and bypass dampers for final
temperature control (Figure 19). The bypass damper should be sized
to provide the same pressure drop at full bypass airflow as the com-
bination of face damper and coil does at full airflow.
Hot water preheat coils must maintain a minimum water velocity
in the tubes of 0.9 m/s to prevent freezing. A two-position valve
combined with face and bypass dampers can usually be used to con-
trol the water velocity. More commonly, a secondary pump control
in one of two configurations (Figure 20 and Figure 21) is used. The
control valve modulates to maintain the desired coil air discharge
temperature, while the pump operates to maintain the minimum
tube water velocity when outdoor air is below freezing. The system
in Figure 21 uses less pump power, allows variable flow in the hot
water supply main, and is preferred for energy conservation. The
system in Figure 20 may be required on small systems with only one
or two air handlers, or where constant main water flow is needed.
Fig. 16 Economizer Cycle Control
Fig. 17 Warm-Up Control
Fig. 18 Night Cool-Down Control
Design and Application of Controls 45.7
A desiccant-based dehumidifier can lower space humidity
below that possible with cooling/dehumidifying coils. This device
adsorbs moisture using silica gel or a similar material. For continu-
ous operation, heat is added to regenerate the material. The adsorp-
tion process also generates heat (Figure 26). Figure 27 shows a
typical control.
Humidification can be achieved by adding moisture to the sup-
ply air. Evaporative pans (usually heated), steam jets, and atomizing
spray tubes are all used for space humidification. A space or return
air humidity sensor provides the necessary signal for the controller.
A humidity sensor in the duct should be used to minimize moisture
carryover or condensation in the duct (Figure 28). With proper use
and control, humidifiers can achieve high space humidity, although
they more often maintain design minimum humidity during the
heating season.
Outdoor Air Control
Fixed, minimum outdoor air control provides ventilation air,
space pressurization (exfiltration), and makeup air for exhaust fans.
For systems without return fans, the outdoor air damper is inter-
locked to remain open only when the supply fan operates (Figure
29). The outdoor air damper should open quickly when the fan turns
on to prevent excessive negative duct pressurization. In some appli-
cations, the fan on-off switch opens the outdoor air damper before
Fig. 23 Cooling and Dehumidifying—Practical Low Limit
Fig. 24 Cooling and Dehumidifying with Reheat
Fig. 25 Sprayed Coil Dehumidifier
Fig. 26 Psychrometric Chart: Chemical Dehumidification
Fig. 27 Chemical Dehumidifier
Fig. 28 Steam Jet Humidifier
Design and Application of Controls 45.9
For spaces requiring heating, a reheat coil can be installed in the dis-
charge. As the temperature in the space drops below the set point,
the damper begins to close and reduce the flow of air to the space.
When the airflow reaches the minimum limit, the valve on the
reheat coil begins to open.
Single-duct VAV systems, which supply warm air to all zones
when heating is required and cool air to all zones when cooling is
required, have limited application and are used where heating is
required only for morning warm-up. They should not be used if
some zones require heating at the same time that others require cool-
ing. These systems, like single-duct cooling-only systems, are gen-
erally controlled during occupancy.
An induction terminal controls the space temperature by reduc-
ing the supply airflow to the space and by inducing return air from
the plenum space into the airstream for the space (Figure 35). Both
dampers are controlled simultaneously, so as the primary air open-
ing decreases, the return air opening increases. When the space tem-
perature drops below the set point, the supply air damper begins to
close and the return air damper begins to open.
A bypass terminal has a damper that diverts part of the supply
air into the return plenum (Figure 36). Control of the diverting
damper is based on the output of the space temperature sensor.
When the temperature in the space drops below the set point, the
bypass damper begins to open, routing some of the supply air to the
plenum, which reduces the amount of supply air entering the space.
When the bypass is fully open, the control valve for the reheat coil
opens as required to maintain the space temperature. A manual bal-
ancing damper in the bypass is adjusted to match the resistance in
the discharge duct. In this way, the supply of air from the primary
system remains at a constant volume. The maximum airflow
through the bypass must be restricted in order to maintain the min-
imum airflow into the space. Although the airflow to the space is
reduced, the total airflow of the fan remains constant, so the fan
power and associated energy cost are not reduced. These terminals
can be added to a single-zone constant volume system to provide
zoning without the energy penalty of a conventional reheat system.
A fan-powered terminal unit has an integral fan that supplies a
constant volume of air to the space (Figure 37). In addition to
enhancing air distribution in the space, a reheat coil can be added to
maintain a minimum temperature in the space when the primary
system is off. When the space is occupied, the fan runs constantly to
provide a constant volume of air to the space. The fan can draw air
from the return plenum to compensate for the reduced supply air. As
the temperature in the space decreases below the set point, the sup-
ply air damper begins to close and the fan draws more air from the
return plenum. Units serving the perimeter area of a building can
include a reheat coil. Then, when the supply air reaches its mini-
mum level, the valve to the reheat coil begins to open.
A plenum fan terminal has a fan that pulls air from the return
plenum and mixes it with the supply air (Figure 38). A reheat coil
may be placed in the discharge to the space or in the return plenum
Fig. 33 Constant Volume Single-Duct Zone Reheat
Fig. 34 Throttling VAV Terminal Unit
Fig. 35 Induction VAV Terminal Unit
Fig. 36 Bypass VAV Terminal Unit
Fig. 37 Fan-Powered VAV Terminal Unit
Design and Application of Controls 45.11
closed or mix cold supply air with bypass air when the hot deck
damper is closed.
A single-zone system (Figure 44) uses a constant volume air-
handling unit (usually factory-packaged). No fan speed control is
required because fan volume and duct static pressure are set by the
design and selection of components. Single-zone systems do not
require terminal boxes because the zone temperature can be main-
tained by varying the temperatures of the heating and cooling coils.
During warm-up, as determined by a time clock or manual
switch, a constant heating supply air temperature is maintained.
Because the terminal unit may be fully open, uncontrolled overheat-
ing can occur. It is preferable to allow unit thermostats to maintain
complete control of their terminal units by reversing their action to
the unit. During warm-up and unoccupied cycles, outdoor air damp-
ers should be closed.
A unit ventilator is designed to heat, ventilate, and cool a space
by introducing up to 100% outdoor air. Optionally, it can cool and
dehumidify with a cooling coil (either chilled water or direct expan-
sion). Heating can be by hot water, steam, or electric resistance. The
control of these coils can be by valves or face and bypass dampers.
Consequently, controls applied to unit ventilators are many and var-
ied. The three most commonly used control schemes are Cycle I,
Cycle II, Cycle III, and Cycle W.
Cycle I Control. Except during the warm-up stage, Cycle I (Fig-
ure 45), supplies 100% outdoor air at all times. During warm-up, the
heating valve is open, the OA damper is closed, and the RA damper
is open. As temperature rises into the operating range of the space
thermostat, the OA damper opens fully, and the RA damper closes.
The heating valve is positioned to maintain space temperature. The
airstream thermostat can override space thermostat action on the
heating valve to prevent discharge air from dropping below a min-
imum temperature. Figure 47 shows the positions of the heating
valve and ventilation dampers in relation to space temperature.
Cycle II Control. During the heating stage, Cycle II (Figure 45)
supplies a set minimum quantity of outdoor air. Outdoor air is grad-
ually increased as required for cooling. During warm-up, the heat-
ing valve is open, the OA damper is closed, and the RA damper is
open. As the space temperature rises into the operating range of the
space thermostat, ventilation dampers move to their set minimum
ventilation positions. The heating valve and ventilation dampers are
operated in sequence as required to maintain space temperature.
The airstream thermostat can override space thermostat action on
the heating valve and ventilation dampers to prevent discharge air
from dropping below a minimum temperature. Figure 49 shows the
relative positions of the heating valve and ventilation dampers with
respect to space temperature.
Cycle III Control. During the heating, ventilating, and cooling
stages, Cycle III (Figure 46) supplies a variable amount of outdoor
air as required to maintain the air entering the heating coil at fixed
temperature (typically 13°C). When heat is not required, this air is
Fig. 42 Variable, Constant Volume (ZEB) Dual-Duct
Terminal Unit
Fig. 43 Zone Mixing Dampers—Three-Deck
Multizone System
Fig. 44 Single-Zone Fan System
Fig. 45 Cycles I, II, and W Control Arrangements
45.14 1999 ASHRAE Applications Handbook (SI)
needed in each supply duct. A controller allows the sensor sensing
the lowest pressure to control the fan output, thus ensuring that there
is adequate static pressure to supply the necessary air for all zones.
Control of a return air fan is similar to that described previously
in the section on Fans in the paragraph on Return Fan Static Control.
Flow stations are usually located in each supply duct, and a signal
corresponding to the sum of the two airflows is transmitted to the
RA fan volume controller to establish the set point of the return fan
controller.
The hot deck has its own heating coil, and the cold deck has its
own cooling coil. Each coil is controlled by its own discharge air
temperature controller. The controller set point may be reset from
the greatest representative demand zone: based on zone tempera-
ture, the hot deck may be reset from the zone with the greatest heat-
ing demand, and the cold deck from the zone with the greatest
cooling demand.
Control based on the zone requiring the most heating or cooling
increases operation economy because it reduces the energy deliv-
ered at less-than-maximum load conditions. However, the expected
economy is lost if air quantity to a zone is too low, temperature in a
space is set to an extreme value, a zone sensor is placed so that it
senses spot loads (due to coffee pots, the sun, copiers, etc.), a sensor
is located in an unoccupied zone, or a zone sensor malfunctions. In
these cases, a weighted average of zone signals can recover the ben-
efit at the expense of some comfort in specific zones.
Ventilation dampers (OA, RA, and EA) are controlled for cool-
ing, with outdoor air as the first stage of cooling in sequence with
the cooling coil from the cold deck discharge temperature control-
ler. Control is similar to that in single-duct systems. A more accurate
OA flow-measuring system can replace the minimum positioning
switch.
Dual supply fan systems (Figure 51) use separate supply fans
for the heating and cooling ducts. Static pressure control is similar
to that for VAV dual-duct single-supply fan systems, except that
each supply fan has its own static pressure sensor and control. If the
system has a return air fan, volume control is similar to that
described in the section on Fans in the paragraph on Return Fan
Static Control. Temperature, ventilation, and humidity control are
similar to those for VAV dual-duct single supply fan systems.
Chillers
The manufacturer almost always supplies chillers with an auto-
matic control package installed. Control functions fall into two cat-
egories: capacity and safety.
Because of the wide variety of chiller types, sizes, drives, man-
ufacturers, piping configurations, pumps, cooling towers, distribu-
tion systems, and loads, most central chiller plants, including their
controls, are designed on a custom basis. Chapter 43 of the 1998
ASHRAE Handbook—Refrigeration describes various chillers (e.g.,
centrifugal and reciprocating). Chapter 11 of the 2000 ASHRAE
Handbook—Systems and Equipment covers variations in piping
configurations (e.g., series and parallel chilled water flow) and
some associated control concepts.
Chiller plants are generally one of two types: variable flow (Fig-
ure 52 and Figure 53) or constant flow (Figure 54). The figures
show a parallel-flow piping configuration. Control of the remote
load determines which type should be used. Throttling coil valves
vary the flow in response to the load and a temperature differential
that tends to remain near the design temperature differential. The
chilled water supply temperature typically establishes the base flow
rate. To improve energy efficiency, the set point is reset for the zone
with the greatest load (load reset) or other variances.
The constant flow system (Figure 54) is only constant flow under
each combination of chillers on line; a major upset occurs whenever
a chiller is added or dropped. The load reset function ensures that
the zone with the largest load is satisfied, while supply or return
water control treats average zone load.
Fig. 52 Variable Flow Chilled Water System
Fig. 53 Variable Flow Chilled Water System
Fig. 54 Constant Flow Chilled Water System
Design and Application of Controls 45.15
Refrigerant Pressure Optimization
Chiller efficiency is a function of the percent of full load on the
chiller and the difference in refrigerant pressure between the con-
denser and the evaporator. In practice, the pressure is represented by
condenser water exit temperature minus chilled water supply tem-
perature. To reduce the refrigerant pressure, the chilled water supply
temperature must be increased and/or the condenser water temper-
ature decreased. An energy saving of about 3% is obtained for each
degree 1 K reduction.
The following methods are used to reduce refrigerant pressure:
1. Use chilled water load reset to raise the supply set point as load
decreases. Figure 55 shows the basic function of this method.
Varying degrees of sophistication are available, including com-
puter control.
2. Lower condenser temperature to the lowest safe temperature
(use manufacturer’s recommendations) by keeping the cooling
tower bypass valve closed, operating at full condenser water
pump capacity, and maintaining full airflow in all cells of the
cooling tower until water temperature is within about 2 K of the
outdoor air wet-bulb temperature. However, the additional pump
and fan power as well as the fan power of the VAV air handlers
must be considered in calculating net energy savings.
Operation Optimization
Multiple-chiller plants should be operated at the most efficient
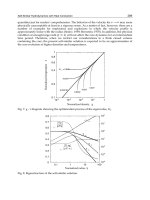
point on the part-load curve. Figure 56 shows a typical part-load
curve for a centrifugal chiller operated at design conditions. Figure
57 shows similar curves at different pressure-limiting conditions.
Figure 58 indicates the point at which a chiller should be added or
dropped in a two-unit plant. In general, the part-load curves are plot-
ted for all combinations of chillers; then, the break-even point
between n and n + 1 chillers can be determined.
Daily start-up of the chiller plant should be optimized to mini-
mize run time based on start-up time of the air-handling units.
Chillers are generally started at the same time as the first fan system.
Chillers may be started early if the water distribution loop has great
thermal mass; they may be started later if outdoor air can provide
cooling to fan systems at start-up.
The condenser water circuit and control arrangement for the
central plant are shown in Figure 59. The control system designer
works with liquid chiller control when the equipment is integrated
into the central chiller plant. Typically, cooling tower, chiller pump,
and condenser pump control must be considered if the overall plant
is to be stable and energy-efficient.
With centrifugal chillers, condenser supply water temperature is
allowed to float as long as the temperature remains above a low
limit. The manufacturer should specify the minimum entering con-
denser water temperature required for satisfactory performance of
the particular chiller. The control schematic in Figure 59 works as
follows: for a condenser supply temperature (e.g., above a set point
of 24°C), the valve is open to the tower, the bypass valve is closed,
and the tower fan or fans are operating. As water temperature
decreases (e.g., to 18°C), tower fan speed can be reduced to low-
speed operation if a two-speed motor is used. On a further decrease
in condenser water supply temperature, the tower fan or fans stop
and the bypass valve begins to modulate to maintain the acceptable
minimum water temperature.
Water Heating
A basic constant volume hydronic system is shown in Figure 60.
A variable speed drive could be added to the pump motor and the
Fig. 55 Chilled Water Load Reset
Fig. 56 Chiller Part-Load Characteristics at Design
Refrigerant Pressure
Fig. 57 Chiller Part-Load Characteristics with
Variable Pressure
Design and Application of Controls 45.17
Duct static limit control prevents excessive duct pressures, usu-
ally at the discharge of the supply fan. Two variations are used: (1)
the fan shutdown type, which is a safety high-limit control that turns
the fans off; and (2) the controlling high-limit type (Figure 28),
which is used in systems having zone fire dampers. When the zone
fire damper closes, duct pressure drops, causing the duct static con-
trol to increase fan modulation; however, the controlling high limit
will override.
Steam or hot water exchangers tend to be self-regulating and, in
that respect, differ from electrical resistance heat transfer devices.
For example, if airflow through a steam or hot water coil stops, coil
surfaces approach the temperature of the entering steam or hot
water, but cannot exceed it. Convection or radiation losses from the
steam or hot water to the surrounding area take place, so the coil is
not usually damaged. Electric coils and heaters, on the other hand,
can be damaged when air stops flowing around them. Therefore,
control and power circuits must interlock with heat transfer devices
(pumps and fans) to shut off electrical energy when the device shuts
down. Flow or differential pressure switches may be used for this
purpose; however, they should be calibrated to energize only when
there is airflow. This precaution shuts off power in case a fire
damper closes or some duct lining blocks the air passage. Limit
thermostats should also be installed to turn off the heaters when
temperatures exceed safe operating levels.
Duct Heaters
The current in individual elements of electric duct heaters is nor-
mally limited to a maximum safe value established by the National
Electrical Code or local codes. Two safety devices in addition to the
airflow interlock device are usually applied to duct heaters (Figure
62). The automatic reset high-limit thermostat normally turns off
the control circuit. If the control circuit has an inherent time delay or
uses solid-state switching devices, a separate safety contactor may
be desirable. The manual reset backup high-limit safety device is
generally set independently to interrupt all current to the heater in
case other control devices fail. An electric heater must have a min-
imum airflow switch and two high-temperature limit sensors; one
with manual reset and one with automatic reset.
DESIGN CONSIDERATIONS AND PRINCIPLES
In designing and selecting the HVAC system for the entire build-
ing, the type, size, use, and operation of the structure must be con-
sidered. Subsystems such as fan and water supply are normally
controlled by local automatic control or a local loop control. A local
loop control includes the sensors, controllers, and controlled
devices used with a single HVAC system and excludes any supervi-
sory or remote functions such as reset and start-stop. However, local
control is frequently extended to a central control point to diagnose
malfunctions that might result in damage from delay, and to reduce
labor and energy costs.
Distributed processing using microprocessors has augmented
computer use at many locations other than the central control point.
The local loop controller can be a direct digital controller (DDC)
instead of a pneumatic or electric thermostat, and some energy man-
agement functions may be performed by a DDC.
Because HVAC systems are designed to meet maximum design
conditions, they nearly always function at partial capacity. Because
the system must be adjusted and operated for many years, the sim-
plest control that produces the necessary results is usually the best.
Mechanical and Electrical Coordination
Even a pneumatic control includes wiring, conduit, switchgear,
and electrical distribution for many electrical devices. The mechan-
ical designer must inform the electrical designer of the total electri-
cal requirements if the controls are to be wired by the electrical
contractor. Requirements include (1) the devices to be furnished
and/or connected, (2) electrical load, (3) location of electrical items,
and (4) a description of each control function.
Coordination is essential. Proper coordination should produce a
control diagram that shows the interface with other control elements
to form a complete and usable system. As an option, the control
engineer may develop a complete performance specification and
require the control contractor to install all wiring related to the spec-
ified sequence. The control designer must run the final checks of
drawings and specifications. Both mechanical and electrical speci-
fications must be checked for compatibility and uniformity.
Building and System Subdivision
The following factors must be considered in the building and
mechanical system subdivision:
• Heating and cooling loads as they vary—the ability to heat or cool
the interior or exterior areas of a building at any time
• Occupancy schedules and the flexibility to meet needs without
undue initial and/or operating costs
• Fire and smoke control and possibly compartmentation that
matches the air-handling layout and operation
Control Principles for Energy Conservation
Temperature and Ventilation Control. VAV systems are typi-
cally designed to supply constant temperature air at all times. To
conserve central plant energy, the temperature of the supply air can
be raised in response to demand from the zone with the greatest load
(load analyzer control). However, because more cool air must then
be supplied to match a given load, the mechanical cooling energy
saved may be offset by an increase in fan energy. Equipment oper-
ating efficiency should be studied closely before implementing tem-
perature reset in cooling-only VAV systems.
Fig. 61 High-Limit Static Pressure Controller
Fig. 62 Duct Heater Control
45.18 1999 ASHRAE Applications Handbook (SI)
Outdoor air (OA), return air (RA), and exhaust air (EA) ventila-
tion dampers are controlled by the discharge air temperature con-
troller to provide free cooling as the first stage in the cooling
sequence. When outdoor air temperature rises to the point that it can
no longer be used for cooling, an outdoor air limit (economizer)
control overrides the discharge controller and moves ventilation
dampers to the minimum ventilation position. An enthalpy control
system can replace outdoor air limit control in some climatic areas.
After the general needs of a building have been established, and
the building and system subdivision has been made, the mechanical
system and its control approach can be considered. Designing sys-
tems that conserve energy requires knowledge of (1) the building,
(2) its operating schedule, (3) the systems to be installed, and (4)
ASHRAE Standard 90.1. The principles or approaches that con-
serve energy are as follows:
1. Run equipment only when needed. Schedule HVAC unit opera-
tion for occupied periods. Run heat at night only to maintain
internal temperature between 10 and 13°C to prevent freezing.
Start morning warm-up as late as possible to achieve design
internal temperature by occupancy time, considering residual
space temperature, outdoor temperature, and equipment capac-
ity (optimum start control). Under most conditions, equipment
can be shut down some time before the end of occupancy,
depending on internal and external load and space temperature
(optimum stop control). Calculate shutdown time so that space
temperature does not drift out of the selected comfort zone
before the end of occupancy.
2. Sequence heating and cooling. Do not supply heating and cool-
ing simultaneously. Central fan systems should use cool outdoor
air in sequence between heating and cooling. Zoning and system
selection should eliminate, or at least minimize, simultaneous
heating and cooling. Also, humidification and dehumidification
should not take place concurrently.
3. Provide only the heating or cooling actually needed. Reset the
supply temperature of hot and cold air (or water).
4. Supply heating and cooling from the most efficient source. Use
free or low-cost energy sources first, then higher cost sources as
necessary.
5. Apply outdoor air control. When on minimum outdoor air, use
no less than that recommended by ASHRAE Standard 62. In
areas where it is cost-effective, use enthalpy rather than dry-bulb
temperature to determine whether outdoor or return air is the
most energy-efficient air source for the cooling mode.
System Selection
The mechanical system significantly affects the control of zones
and subsystems. The type of system and the number and location of
zones influence the amount of simultaneous heating and cooling
that occurs. For exterior building sections, heating and cooling
should be controlled in sequence to minimize simultaneous heating
and cooling. In general, this sequencing must be accomplished by
the control system because only a few mechanical systems (e.g.,
two-pipe systems and single-coil systems) have the ability to pre-
vent simultaneous heating and cooling. Systems that require engi-
neered control systems to minimize simultaneous heating and
cooling include the following:
• VAV cooling with zone reheat. Reduce cooling energy and/or air
volume to a minimum before applying reheat.
• Four-pipe heating and cooling for unitary equipment. Sequence
heating and cooling.
• Dual-duct systems. Condition only one duct (either hot or cold) at
a time. The other duct should supply a mixture of outdoor and
return air.
• Single-zone heating/cooling. Sequence heating and cooling.
Some exceptions exist, such as of dehumidification with reheat.
Control zones are determined by the location of the thermostat or
temperature sensor that sets the requirements for heating and cool-
ing supplied to the space. Typically, control zones are for a room or
an open area of a floor.
Many jurisdictions in the United States no longer permit constant
volume systems that reheat cold air or that mix heated and cooled
air. Such systems should be avoided. If selected, they should be
designed for minimal use of the reheat function through zoning to
match actual dynamic loads and resetting cold and warm air tem-
peratures based on the zone(s) with the greatest demand. Heating
and cooling supply zones should be structured to cover areas of sim-
ilar load. Areas with different exterior exposures should have dif-
ferent supply zones.
Systems that provide changeover switching between heating and
cooling prevent simultaneous heating and cooling. Some examples
are hot or cold secondary water for fan coils or single-zone fan sys-
tems. They usually require small operational zones, which have low
load diversity, to permit changeover from warm to cold water with-
out occupant dissatisfaction.
Systems for building interiors usually require year-round cooling
and are somewhat simpler to control than exterior systems. These
interior areas normally use all-air systems with a constant supply air
temperature, with or without VAV control. Proper control tech-
niques and operational understanding can reduce the energy used to
treat these areas. Reheat should be avoided. General load character-
istics of different parts of a building may lead to selecting different
systems for each.
Load Matching
With individual room control, the environment in a space can be
controlled more accurately and energy can be conserved if the entire
system can be controlled in response to the major factor influencing
the load. Thus, water temperature in a water heating system, steam
temperature or pressure in a steam heating system, or delivered air
temperature in a central fan system can be varied as building load
varies. Control on the entire system relieves individual space con-
trols of part of their burden and provides more accurate space con-
trol. Also, modifying the basic rate of heating or cooling input in
accordance with the entire system load reduces losses in the distri-
bution system.
The system must always satisfy the area or room with the great-
est demand. Individual controls handle demand variations in the
area the system serves. The more accurate the system zoning, the
greater is the control, the smaller are the distribution losses, and
the more effectively space conditions are maintained by individual
controls.
Buildings or zones with a modular arrangement can be designed
for subdivision to meet occupant needs. Before subdivision, operat-
ing inefficiencies can occur if a zone has more than one thermostat.
In an area where one thermostat activates heating while another
activates cooling, the terminals should be controlled from a single
thermostat until the area is properly subdivided.
Size of Controlled Area
No individually controlled area should exceed about 500 m
2
because the difficulty of obtaining good distribution and of finding
a representative location for the space control increases with zone
area. Each individually controlled area must have similar load
characteristics throughout. Equitable distribution, provided
through competent engineering design, careful equipment sizing,
and proper system balancing, is necessary to maintain uniform
conditions throughout an area. The control can measure conditions
only at its location; it cannot compensate for nonuniform condi-
tions caused by improper distribution or inadequate design. Areas
or rooms having dissimilar load characteristics or different condi-
tions to be maintained should be controlled individually. The
Design and Application of Controls 45.19
smaller the controlled area, the better the control and the better the
performance and flexibility.
Location of Space Sensors
Space sensors and controllers must be located where they accu-
rately sense the variables they control and where the condition is
representative of the area (zone) they serve. In large open areas hav-
ing more than one zone, thermostats should be located in the middle
of their zones to prevent them from sensing conditions in surround-
ing zones. Typically, space temperature controllers or sensors are
placed in the following locations.
• Wall-mounted thermostats or sensors are usually placed on
inside walls or columns in the space they serve. Avoid outside
wall locations. Mount thermostats where they will not be affected
by heat from sources such as direct sun rays; wall pipes or ducts;
convectors; or direct air currents from diffusers or equipment
(e.g., copy machines, coffee makers, or refrigerators). Air circu-
lation should be ample and unimpeded by furniture or other
obstructions, and the thermostat should be protected against
mechanical injury. Thermostats located in spaces such as corri-
dors, lobbies, or foyers should be used to control those areas only.
• Return air thermostats can control floor-mounted unitary con-
ditioners such as induction or fan-coil units and unit ventilators.
On induction and fan-coil units, the sensing element is behind the
return air grille. On classroom unit ventilators that use up to 100%
outdoor air for natural cooling, however, a forced flow sampling
chamber should be provided for the sensing element. The sensing
element should be located carefully to avoid radiant effect and to
ensure adequate air velocity across the element.
If return air sensing is used with a central fan system, locate the
sensing element as near as possible to the space being controlled
to eliminate any influence from other spaces and the effect of any
heat gain or loss in the duct. Where supply/return light fixtures are
used to return air to a ceiling plenum, the return air sensing ele-
ment can be located in the return air opening. Be sure to offset the
set point to compensate for the heat from the light fixtures.
• Diffuser-mounted thermostats usually have sensing elements
mounted on circular or square ceiling supply diffusers and depend
on aspiration of room air into the supply airstream. They should
be used only on high-aspiration diffusers adjusted for a horizontal
air pattern. The diffuser on which the element is mounted should
be in the center of the occupied area of the controlled zone.
Lowered Night Temperature
When temperatures during unoccupied periods are lower than
those normally maintained during occupied periods, an automatic
timer often establishes the proper day and night temperature time
cycle. Allow sufficient time in the morning to pick up the condition-
ing load well before there is any heavy increase. Night setback tem-
peratures are often monitored and controlled more closely with
control systems. These computer based systems take into account
variables such as outdoor temperature, system capacity, and build-
ing mass to determine optimal start-up and shutdown times.
REFERENCES
ASHRAE. 1989. Energy efficient design of new buildings except low-rise
residential buildings. ANSI/ASHRAE Standard 90.1-1989.
ASHRAE. 1989. Ventilation for acceptable indoor air quality. ANSI/ ASH-
RAE Standard 62-1989.
Englander, S.L. and L.K. Norford. 1992. Saving fan energy in VAV sys-
tems—Part 2: Supply fan control for static pressure minimization. ASH-
RAE Transactions 98(1):19-32.
NFPA. 1996. National electrical code. ANSI/NFPA Standard 70-96.
National Fire Protection Association, Quincy, MA.
CHAPTER 46
SOUND AND VIBRATION CONTROL
Data Reliability 46.1
SOUND 46.1
Acoustical Design of HVAC Systems 46.1
Basic Design Techniques 46.2
Equipment Sound Levels 46.4
Duct Element Sound Attenuation 46.11
Use of Fiberglass Products in HVAC Systems 46.17
Sound Radiation Through Duct Walls 46.17
Receiver Room Sound Correction 46.20
Indoor Sound Criteria 46.22
Outdoor Sound Criteria 46.26
Mechanical Equipment Room Sound Isolation 46.27
Sound Transmission in Return-Air Systems 46.31
Sound Transmission Through Ceilings 46.31
Fume Hood Duct Design 46.32
Sound Control for Outdoor Equipment 46.32
Design Procedures 46.34
VIBRATION ISOLATION AND CONTROL 46.37
Equipment Vibration 46.37
Vibration Criteria 46.37
Specification of Vibration Isolators 46.37
Isolation of Vibration and Noise in Piping Systems 46.42
Isolating Duct Vibration 46.44
Seismic Protection 46.45
Vibration Investigations 46.45
TROUBLESHOOTING 46.45
Determining Problem Source 46.45
Determining Problem Type 46.45
Standards 46.47
ECHANICAL equipment is one of the major sources of
Msound in a building. Primary considerations often given to
the selection and use of mechanical equipment in buildings have
generally been those directly related to the intended use of the
equipment, like cooling, heating, and ventilation. However, for
environmental considerations in critical listening spaces, like con-
ference rooms and auditoria, and for many other spaces with light
building structures and variable-volume air distribution systems,
the sound generated by mechanical equipment and its effects on the
overall acoustical environment in a building must be considered.
Thus, the selection of mechanical equipment and the design of
equipment spaces should be undertaken with an emphasis on (1) the
intended uses of the equipment and (2) the goal of providing accept-
able sound and vibration levels in occupied spaces of the building in
which the equipment is located.
The system concept of noise control is used throughout, in that
each of the components is related to the source-path-receiver chain.
The noise generation is the source; it travels from the source via a
path, which can be through the air (airborne) or through the struc-
ture (structure-borne) until it reaches the ear of the receiver. When
the combination of this chain is complex, it can be referred to it as
a system effect. So, noise propagates from the sources through the
air distribution ducts, through the structure, and through combina-
tions of paths, reaching the occupants. All mechanical components,
from dampers to diffusers to junctions, may produce sound by the
nature of the airflow through and around them. As a result, almost
all components must be considered. Since sound travels effectively
in the same or opposite direction of airflow, upstream and down-
stream paths are often equally important.
Adequate noise and vibration control in a heating, ventilating,
and air-conditioning (HVAC) system is not difficult to achieve dur-
ing the design phase of the system, providing basic noise and vibra-
tion control principles are understood. This chapter discusses basic
sound and vibration principles and data needed by HVAC designers.
Divided into two main sections, one on sound, the other on vibra-
tion, this chapter is organized differently than versions in Hand-
books prior to 1995. This chapter includes more information on
acoustic design guidelines and system design requirements. Most of
the equations associated with sound and vibration control design in
HVAC systems have been replaced by related tables and simpler
design procedures. The equations that have been removed can be
found in the 1991 and 1992 ASHRAE Handbooks. In addition, tech-
nical discussions and detailed HVAC component and system design
examples can be found in Algorithms for HVAC Acoustics (Rey-
nolds and Bledsoe 1991).
Other publications that cover sound and vibration control in
HVAC systems include the 1997 ASHRAE Handbook—Fundamen-
tals, which covers fundamentals associated with sound and vibra-
tion in HVAC; Schaffer (1991), who provides specific guidelines
for the acoustic design and related construction phases associated
with HVAC systems, troubleshooting sound and vibration prob-
lems, and HVAC sound and vibration specifications; Ebbing and
Blazier (1998), who interpret and clarify how users can make the
best use of HVAC manufacturers’ acoustical data and application
information; and Reynolds and Bevirt (1994), who cover instrument
requirements, instrument and measurement calibration procedures,
measurement procedures, and specification and construction instal-
lation review procedures associated with sound and vibration mea-
surements relative to HVAC systems.
DATA RELIABILITY
The data in this chapter comes both from consulting experience
and research studies. When applying the data, especially to situa-
tions that extrapolate from the original data, use caution. While spe-
cific uncertainties are not stated for each data set, the sound levels
or attenuation data are probably within 2 dB of measured or
expected results. However, significantly greater variations may
occur, especially in the low frequency ranges and particularly in the
63 Hz octave band. While specific data sets may have a wide uncer-
tainty range, experience has demonstrated the usefulness of com-
bining data sets for estimating the sound level. If done correctly,
these estimates usually result in space sound pressure levels within
5 dB of measured levels.
SOUND
ACOUSTICAL DESIGN OF HVAC SYSTEMS
The solution to nearly every HVAC system noise and vibration
control problem involves examining the sound sources, the sound
transmission paths, and the receivers. For most HVAC systems, the
sound sources are associated with the building mechanical and elec-
trical equipment. As indicated in Figure 1, sound travels between a
source and receiver through many possible sound and/or vibration
The preparation of this chapter is assigned to TC 2.6, Sound and Vibration
Control.
Sound and Vibration Control 46.3
3. Design duct connections at both the fan inlet and outlet for uni-
form and straight air flow. Failure to do this can result in severe
turbulence at the fan inlet and outlet and in flow separation at
the fan blades. Both of these can significantly increase the
noise generated by the fan.
4. Select duct silencers that do not significantly increase the
required fan total static pressure. Duct silencers can signifi-
cantly increase the required fan static pressure if improperly
selected. Selecting silencers with static pressure losses of
87 Pa. or less can minimize silencer airflow regenerated
noise.
5. Place fan-powered mixing boxes associated with variable-vol-
ume air distribution systems away from noise-sensitive areas.
6. Minimize flow-generated noise by elbows or duct branch take-
offs, whenever possible, by locating them at least four to five
duct diameters from each other. For high velocity systems, it
may be necessary to increase this distance to up to ten duct
diameters in critical noise areas. The use of flow straighteners
or honeycomb grids, often called “egg crates”, in the necks of
short-length takeoffs that lead directly to grilles, registers, and
diffusers is preferred to the use of volume extractors that pro-
trude into the main duct airflow.
7. Keep airflow velocity in the duct as low as possible (7.5 m/s or
less) near critical noise areas by expanding the duct cross-sec-
tion area. However, do not exceed an included expansion angle
of greater than 15°. Flow separation, resulting from expansion
angles greater than 15°, may produce rumble noise. Expanding
the duct cross-section area will reduce potential flow noise
associated with turbulence in these areas.
8. Use turning vanes in large 90° rectangular elbows and branch
takeoffs. This provides a smoother transition in which the air
can change flow direction, thus reducing turbulence.
9. Place grilles, diffusers and registers into occupied spaces as far
as possible from elbows and branch takeoffs.
10. Minimize the use of volume dampers near grills, diffusers and
registers in acoustically critical situations.
11. Vibration isolate all vibrating reciprocating and rotating equip-
ment if mechanical equipment is located on upper floors or is
roof-mounted. Also, it is usually necessary to vibration isolate
the mechanical equipment that is located in the basement of a
building as well as piping supported from the ceiling slab of a
basement, directly below tenant space. It may be necessary to
use flexible piping connectors and flexible electrical conduit
between rotating or reciprocating equipment and pipes and
ducts that are connected to the equipment.
12. Vibration isolate ducts and pipes, using spring and/or neoprene
hangers for at least the first 15 m from the vibration-isolated
equipment.
13. Use barriers near outdoor equipment when noise associated
with the equipment will disturb adjacent properties if barriers
are not used. In normal practice, barriers typically produce no
more than 15 dB of sound attenuation in the mid frequency
range.
Table 1 lists several common sound sources associated with
mechanical equipment noise. Anticipated sound transmission paths
and recommended noise reduction methods are also listed in the
table. Airborne and/or structure-borne sound can follow any or all
of the transmission paths associated with a specified sound source.
Schaffer (1991) has more detailed information in this area.
Table 1 Sound Sources, Transmission Paths, and Recommended Noise Reduction Methods
Sound Source Path No.
Circulating fans; grilles; registers; diffusers; unitary equipment in room 1
Induction coil and fan-powered VAV mixing units 1, 2
Unitary equipment located outside of room served; remotely located air-handling equipment,
such as fans, blowers, dampers, duct fittings, and air washers
2, 3
Compressors, pumps, and other reciprocating and rotating equipment (excluding air-handling equipment) 4, 5, 6
Cooling towers; air-cooled condensers 4, 5, 6, 7
Exhaust fans; window air conditioners 7, 8
Sound transmission between rooms 9, 10
No. Transmission Paths Noise Reduction Methods
1 Direct sound radiated from sound source to ear Direct sound can be controlled only by selecting quiet equipment.
Reflected sound from walls, ceiling, and floor Reflected sound is controlled by adding sound absorption to the room
and to equipment location.
2 Air- and structure-borne sound radiated from casings and through walls of
ducts and plenums is transmitted through walls and ceiling into room
Design duct and fittings for low turbulence; locate high velocity ducts in
noncritical areas; isolate ducts and sound plenums from structure with
neoprene or spring hangers.
3 Airborne sound radiated through supply and return air ducts to diffusers in
room and then to listener by Path 1
Select fans for minimum sound power; use ducts lined with
sound-absorbing material; use duct silencers or sound plenums
in supply and return air ducts.
4 Noise transmitted through equipment room walls and floors to adjacent
rooms
Locate equipment rooms away from critical areas; use masonry blocks or
concrete for equipment room walls and floor.
5 Vibration transmitted via building structure to adjacent walls and ceilings,
from which it radiates as noise into room by Path 1
Mount all machines on properly designed vibration isolators; design
mechanical equipment room for dynamic loads; balance rotating and
reciprocating equipment.
6 Vibration transmission along pipes and duct walls Isolate pipe and ducts from structure with neoprene or spring hangers;
install flexible connectors between pipes, ducts, and vibrating machines.
7 Noise radiated to outside enters room windows Locate equipment away from critical areas; use barriers and covers to
interrupt noise paths; select quiet equipment.
8 Inside noise follows Path 1 Select quiet equipment.
9 Noise transmitted to an air diffuser in a room, into a duct, and out through
an air diffuser in another room
Design and install duct attenuation to match transmission loss of wall
between rooms.
10 Sound transmission through, over, and around room partition Extend partition to ceiling slab and tightly seal all around; seal all pipe,
conduit, duct, and other partition penetrations.
Sound and Vibration Control 46.5
possible sound power levels, commensurate with other fan selec-
tion requirements.
• Many fans generate tones at the blade passage frequency and its
harmonics that may require additional acoustical treatment. The
amplitude of these tones can be affected by resonance in the duct
system, fan design, and inlet flow distortions caused by poor inlet
duct design, or by the operation of an inlet volume control
damper. When possible, variable speed control for volume con-
trol is preferable to volume control dampers to control fan noise.
• Design duct connections at both the fan inlet and outlet for uni-
form and straight airflow. Avoid unstable, turbulent, and swirling
inlet airflow. Deviation from acceptable practice can severely
degrade both the aerodynamic and acoustic performance of any
fan and invalidate the manufacturer’s ratings or other perfor-
mance predictions.
Variable Air Volume (VAV) Systems
General Design Factors. VAV systems can significantly reduce
energy cost due to their ability to modulate air capacity. But they can
be the source of fan noise that is very difficult to mitigate. To avoid
these potential problems, the designer should carefully design the
ductwork and the static pressure control systems and select the fan
or air handling unit and its air modulation device.
As in other aspects of HVAC design, the duct system should be
designed for the lowest practical static pressure loss, especially in
the ductwork closest to the fan or air handling unit. High airflow
velocity and convoluted duct routing can cause airflow distortions
that result in excessive pressure drop and fan instabilities that are
responsible for excessive noise, fan stall, or both.
Many VAV noise complaints have been traced to control prob-
lems. While most of the problems are associated with improper
installation, many are caused by poor design. The designer should
specify high-quality fans or air handling units that will operate in
their optimum ranges, not at the edge of their operation ranges
where low system tolerances can lead to inaccurate fan flow capac-
ity control. Also, the in-duct static pressure sensors should be placed
in duct sections having the lowest possible air turbulence; that is, at
least three equivalent duct diameters from any elbow, takeoff, tran-
sition, offset, or damper.
VAV noise problems have been traced to improper air balancing.
For example, air balance contractors commonly balance an air dis-
tribution system by setting all damper positions without considering
the possibility of reducing the fan speed. The end result is a duct sys-
tem in which no damper is completely open and the fan is delivering
air at a higher static pressure than would otherwise be necessary. If
the duct system is balanced with at least one balancing damper wide
open, the fan speed could be reduced with a corresponding reduc-
tion in fan noise. Lower sound levels will occur if most balancing
dampers are wide open or eliminated.
Fan Selection. For constant-volume systems, fans should be
selected to operate at maximum efficiency at the fan design airflow
rate. However, VAV systems must be selected to operate with effi-
ciency and stability throughout its range of modulation. For exam-
ple, a fan selected for peak efficiency at full output may
aerodynamically stall at an operating point of 50% of full output
resulting in significantly increased low frequency noise. Similarly,
a fan selected to operate at the 50% output point may be very inef-
ficient at full output, resulting in substantially increased fan noise at
all frequencies. In general, a fan selected for a VAV system should
be selected for a peak efficiency at an operating point of around 70
to 80% of the maximum required system capacity. This usually
means selecting a fan that is one size smaller than that required for
peak efficiency at 100% of maximum required system capacity
(Figure 6). When the smaller fan is operated at higher capacities, it
will produce up to 5 dB more noise. This occasional increase in
sound level is usually more tolerable than the stall-related sound
problems that can occur with a larger fan operating at less than
100% design capacity most of the time.
Air Modulation Devices. Variable capacity control methods can
be divided into three general categories: (1) variable inlet vanes
(sometimes called inlet guide vanes) or discharge dampers, which
yield a new fan system curve at each vane or damper setting; (2)
variable pitch fan blades (usually used on in-line axial fans), which
adjust the blade angle for optimum efficiency at varying capacity
requirements; and (3) variable speed motor drives where the motor
speed is varied by modulation of the power line frequency or by
mechanical means such as gears or continuous belt adjustment.
While inlet vane and discharge damper volume controls can add
noise to a fan system at reduced capacities, variable speed motor
drives and variable-pitch fan blade systems are quieter at reduced
air output than at full air output.
Variable Inlet Vanes and Discharge Dampers. Variable inlet
vanes vary airflow capacity by changing the inlet airflow to a fan
wheel. This type of air modulation varies the total air volume and
pressure at the fan while the fan speed remains constant. While, fan
pressure and air volume reductions at the fan result in duct system
noise reductions by reduced air velocity and pressures in the duct
work, there is an associated increase in fan noise caused by the air-
flow turbulence and flow distortions at the inlet vanes acting as a fan
inlet obstruction. Fan manufacturers’ test data have shown that, on
airfoil type centrifugal fans, as vanes mounted inside the fan inlet
(nested inlet vanes) close, the sound level at the blade passing fre-
quency of the fan increases by 2 to 8 dB, depending on the amount
of total air volume restricted. For inlet vanes that are mounted exter-
nally the increase is on the order of 2 to 3 dB. Forward curved fan
wheels with inlet vanes are about 1 to 2 dB quieter than airfoil fan
wheels. In-line axial type fans with inlet vanes generate increased
noise levels of 2 to 8 dB in the low frequency octave bands for a
25% to 50% closed vane position.
Discharge dampers are typically located immediately down-
stream of the supply air fan and reduce airflow and increase pressure
drop across the fan while the fan speed remains constant. Because of
the air turbulence and flow distortions created by the high-pressure
drop across discharge dampers there is a high probability that duct
rumble will occur near the damper location. If the dampers are throt-
tled to a very low flow, a stall condition can occur at the fan also
resulting in an increase in low-frequency noise.
Variable Pitch Fan Blades for Capacity Control. Variable pitch
fan blade controls vary the fan blade angle in order to reduce the
overall airflow through the fan. This type of capacity control system
Fig. 6 Basis for Fan Selection in VAV Systems
46.6 1999 ASHRAE Applications Handbook (SI)
is predominantly used in axial type fans. As air volume and pressure
are reduced at the fan, the corresponding noise reduction is usually
2 to 5 dB in the 125 through 4000 Hz octave bands for an 80% to
40% air volume reduction.
Variable-Speed Motor Controlled Fan. Three types of
electronic variable speed control units are used with fans: (1)
current source inverter, (2) voltage source inverter, and (3)
pulse-width modulation (PWM). The current source inverter and
third generation PWM control units are usually the quietest of
these controls. In all three controls, the matching of motors to
control units and the quality of the motor windings determines
the noise output of the motor. The motor typically emits a pure
tone whose amplitude depends on the smoothness of the wave-
form from the line current. The frequency of the motor tone
depends on the motor type, windings, and speed. Both the
inverter control units and motors should be enclosed in areas,
such as mechanical rooms or electrical rooms, where the noise
impact on surrounding rooms is minimal. The primary acoustic
advantage of a variable speed controlled fan is the reduction of
fan speed, which translates into reduced noise where dB reduc-
tion is approximately 50[log (higher speed/lower speed)].
Because this speed reduction generally follows the fan system
curve, a fan selected at optimum efficiency initially (lowest
noise) does not lose that efficiency as the speed is reduced.
The following guidelines should be observed in the use of
variable-speed controllers:
1. Select fan vibration isolators on the basis of the lowest reason-
able speed of the fan. For example, the lowest rotational speed
might be 600 rpm for a 1000 rpm fan in a commercial system.
2. Select a controller with a feature often called “critical fre-
quency jump band.” This feature allows a user to program the
controller to avoid certain fan or motor speed settings that
might excite vibration isolation system or building structure
resonance frequencies.
3. Check the intersection of the fan’s various speed curves with the
duct system curve, keeping in mind that the system curve does
not go to zero static pressure at no flow when selecting a fan that
will be controlled by a variable-speed motor controller. (The sys-
tem curve is asymptotic at the static pressure control setpoint,
typically 250 to 370 Pa) An improperly selected fan may be
forced to operate in its stall range at slower fan speeds.
Terminal Units. Fans and pressure reducing valves in VAV units
should have manufacturer published sound data that indicate the
sound power levels (1) that are discharged from the low pressure
end of the unit and (2) that radiate from the exterior shell of the unit.
These sound power levels vary as a function of valve position and
fan point of operation. Sound data for VAV units should be obtained
according to the procedures specified by ARI Standard 880.
If the VAV unit is located away from critical areas (such as above
a storeroom or corridor), the sound radiated from the shell of the
unit may be of no concern. If, however, the unit is located above a
critical space and separated from the space by a ceiling with little or
no sound transmission loss at low frequencies, the sound radiated
from the shell may produce sound in the space below that exceeds
the desired noise criterion. In this case, it may be necessary to relo-
cate the unit to a noncritical area or to enclose it with a construction
having a high transmission loss. In general, fan-powered VAV units
should not be placed above or near any room with a required sound
criterion rating of less than RC 40(N).
Systems that use VAV units that will not completely shut off are
often helpful. If too many units shut off simultaneously, excessive
duct system pressure at low flow can occur. This condition can
sometimes cause a fan stall, resulting in accompanying roar, rum-
ble, and surge. Using minimum airflow instead of shutoff VAV units
help prevents this condition from occurring.
Rooftop Mounted Air Handlers
Rooftop air handlers can have unique noise control requirements
because these units are often integrated into a light roof construc-
tion. Large roof openings are often required for supply and return air
duct connections. These ducts run directly from noise-generating
rooftop air handlers to the building interior. Generally, the space or
distance between the roof-mounted equipment and the closest occu-
pied spaces below the roof is insufficient to apply standard sound
control treatments. Rooftop units should be placed above spaces
that are not acoustically sensitive and as far as possible from the
nearest occupied space. This measure can reduce the amount of
sound control treatment necessary.
The four common sound transmission paths associated with
rooftop air handlers (Figure 7) are
1. Airborne through the bottom of the rooftop unit to spaces below
2. Structure-borne from vibrating equipment in the rooftop unit to
the building structure
3. Duct-borne through the supply air duct from the air handler
4. Duct-borne through return air duct to the air handler
Airborne paths are associated with casing-radiated sound that
passes through the air handler enclosure and roof structure to the
spaces below. Airborne sound can either be a result of air handler
noise or from other equipment in the rooftop unit. When a rooftop
unit is placed over a large opening in the roof structure through
which the supply and return air ducts pass, the opening should be
divided into two openings sized to accommodate only the supply
and return air ducts. These openings should be properly sealed after
the installation of the ducts. If a large single opening exists under the
rooftop unit, it should be structurally and acoustically sealed around
the supply and return air ducts with one or more layers of gypsum
board or other similar material. Airborne sound transmission to
spaces below a rooftop unit can be greatly reduced. One way is by
placing a rooftop unit on a structural support extending above the
roof structure and running the supply and return air ducts horizon-
tally along the roof for several duct diameters before the ducts turn
to penetrate the roof. The roof deck/ceiling system below the unit
can be constructed to adequately attenuate the sound radiated from
the bottom of the unit.
Proper vibration isolation can minimize structure-borne sound
and vibration from vibrating equipment in a rooftop unit. Special
curb mounting bases are available to support and isolate rooftop
units. For roofs constructed with open web joists, thin long span
slabs, wooden construction, and any unusually light construction,
evaluate all equipment with a mass of more than 130 kg to deter-
mine the additional deflection of the structure at the mounting
points caused by the equipment. Isolator deflection should be a min-
imum of 15 times the additional deflection. If the required spring
isolator deflection exceeds commercially available products, stiffen
the supporting structure or change the equipment location.
Fig. 7 Sound Paths for Typical Rooftop Installations
Sound and Vibration Control 46.7
Ductborne transmission of sound through the supply air duct
consists of two components: sound transmitted from the air handler
through the supply air duct system to occupied areas and sound
transmitted via duct breakout through a section or sections of the
supply air duct close to the air handler to occupied areas. Experience
has indicated that sound transmission below 250 Hz via duct brea-
kout is often a major acoustical limitation for many rooftop instal-
lations. Excessive low-frequency noise associated with fan noise
and air turbulence in the region of the discharge section of the fan
and the first duct elbow results in duct rumble, which is difficult to
attenuate. This problem is often made worse by the presence of a
duct with a high aspect ratio at the discharge section of the fan.
Rectangular ducts with duct lagging are often ineffective in
reducing duct breakout noise. Using either a single- or dual-wall
round duct with a radiused elbow coming off the discharge section
of the fan can control duct breakout. If space does not allow for the
use of a single duct, the duct can be split into several parallel round
ducts. Another method that is effective is the use of an acoustic ple-
num chamber constructed with a minimum 50 mm thick, dual-wall
plenum panel, which is lined with fiberglass and which has a per-
forated inner liner at the discharge section of the fan. Either round
or rectangular ducts can be taken off the plenum as necessary to
supply the rest of the air distribution system. Table 2 illustrates
twelve possible rooftop discharge duct configurations with their
associated low-frequency noise reduction potential (Harold 1986,
1991; Beatty 1987).
Ductborne transmission of sound through the return air duct of
a rooftop unit is often a problem. Generally only one short return
air duct section runs from the plenum space above a ceiling and
the return air section of the air handler. This short run does not
Table 2 Duct Breakout Insertion Loss—Potential Low-Frequency Improvement over Bare Duct and Elbow
Discharge Duct Configuration, 3660 mm of Horizontal Supply Duct
Duct Breakout Insertion Loss
at Low Frequencies, dB
Side View End View63 Hz 125 Hz 250 Hz
Rectangular duct: no turning vanes (reference) 0 0 0
Rectangular duct: one-dimensional turning vanes 0 1 1
Rectangular duct: two-dimensional turning vanes 0 1 1
Rectangular duct: wrapped with foam insulation and two layers of lead 4 3 5
Rectangular duct: wrapped with glass fiber and
one layer16 mm gypsum board
476
Rectangular duct: wrapped with glass fiber and
two layers 16 mm gypsum board
799
Rectangular plenum drop (12 ga.): three parallel
rectangular supply ducts (22 ga.)
124
Rectangular plenum drop (12 ga.): one round supply duct (18 ga.) 8 10 6
Rectangular plenum drop (12 ga.): three parallel round supply ducts (24 ga.) 11 14 8
Rectangular (14 ga.) to multiple drop: round mitered elbows with
turning vanes, three parallel round supply ducts (24 ga.)
18 12 13
Rectangular (14 ga.) to multiple drop: round mitered elbows with turning
vanes, three parallel round lined double-wall, 560 mm OD supply ducts
(24 ga.)
18 13 16
Round drop: radius elbow (14 ga.), single 940 mm diameter supply duct 15 17 10
46.8 1999 ASHRAE Applications Handbook (SI)
adequately attenuate the sound between the fan inlet and the
spaces below the air handler. The sound attenuation through the
return air duct can be improved by adding at least one (more if
possible) branch division where the return air duct is split into two
sections that extend several duct diameters before they terminate
into the plenum space above the ceiling. The inside surfaces of all
the return air ducts should be lined with a minimum of 25 mm
thick duct liner. If conditions permit, duct silencers in the duct
branches or an acoustic plenum chamber at the air handler inlet
gives better sound conditions.
Aerodynamically Generated Sound in Ducts
Although fans are a major source of sound in HVAC systems,
they are not the only sound source. Aerodynamic sound is generated
at duct elbows, dampers, branch takeoffs, air modulation units,
sound attenuators, and other duct elements. Produced by the inter-
action of moving air with the structure, the sound power levels in
each octave frequency band depend on the duct element geometry
and the turbulence of the airflow and the airflow velocity in the
vicinity of the duct element. Duct-related aerodynamic noise prob-
lems can be avoided by
• Sizing ductwork or duct configurations so that air velocity is low
(see Tables 3 and 4)
• Avoiding abrupt changes in duct cross-section area
• Providing smooth transitions at duct branches, takeoffs, and
bends
• Attenuating sound generated at duct fittings with sufficient sound
attenuation elements between a fitting and corresponding air-ter-
minal device
Duct Velocity. The amplitude of aerodynamically generated
sound in ducts is generally proportional to between the fifth and
sixth power of the duct airflow velocity in the vicinity of a duct fit-
ting. So reducing duct airflow velocity significantly reduces flow
generated noise. Table 3 (Schaffer 1991) and Table 4 (Egan 1988)
recommend the maximum air velocities in duct sections and duct
outlets to avoid problems associated with aerodynamically gener-
ated sound in ducts.
Dampers. Depending on its location relative to a duct terminal
device, a damper can generate unwanted noise into an occupied area
of a building. The noise can be transmitted down the duct to the dis-
charge, or through the ceiling space into the occupied space below.
Volume dampers should not be placed closer than 1.5 m from an
air outlet for good design. When a volume control damper is
installed close to an air outlet, the acoustic performance of the air
outlet must be based on the air volume handled and on the pressure
drop across the damper. The sound level produced by the damper is
accounted for by adding a quantity to the diffuser sound rating. This
quantity is proportional to the pressure ratio, which is the throttled
pressure drop across the damper divided by the minimum pressure
drop across the damper. Table 5 provides quantities to determine the
effect of damper location on diffuser sound ratings.
Balancing dampers, equalizers, and other similar devices should
not be placed directly upstream of air devices or open-ended ducts
in acoustically critical spaces. They should be located 5 to 10 duct
diameters from the termination device with acoustically lined duct
joining the damper and duct termination device.
Plenums may be used to keep dampers further away from diffus-
ers. Dampers may be installed at the plenum entrance with linear
diffusers installed in the distribution plenum. The further a damper
is installed from the outlet, the lower the resultant sound level.
Air Devices. Manufacturers’ test data should be obtained in
accordance with ASHRAE Standard 70 or ARI Standard 890(P) for
room air terminal devices such as grilles, registers, diffusers, air
handling light fixtures, and air-handling suspension bars. The room
duct termination device should be selected to meet the noise crite-
rion required or specified for the room. However, the manufac-
turer’s sound power rating is obtained with a uniform velocity
distribution throughout the diffuser neck or grille collar, which is
often not met in practice. If a duct turn precedes the entrance to the
diffuser or if a balancing damper is installed immediately before the
diffuser, the airflow will be turbulent and the noise generated by the
device will be substantially higher than the manufacturer’s data by
as much as 12 dB. In some cases, placing an equalizer grid in the
neck of the diffuser reduces this turbulence substantially. The equal-
izer grid can help provide a uniform velocity gradient in the neck of
the diffuser so the sound power generated in the field is closer to that
listed in the manufacturer’s catalog.
A flexible duct connection between the diffuser and the air sup-
ply duct or VAV unit provides a convenient means to align the dif-
fuser with the ceiling grid. A misalignment in this connection that
Table 3 Maximum Recommended Duct Airflow Velocities
Needed to Achieve Specified Acoustic Design Criteria
Main Duct Location
Design
RC(N)
Maximum Airflow
Velocity, m/s
Rectangular
Duct
Circular
Duct
In shaft or above drywall ceiling 45 17.8 25.4
35 12.7 17.8
25 8.6 12.7
Above suspended acoustic ceiling 45 12.7 22.9
35 8.9 15.2
25 6.1 10.2
Duct located within occupied space 45 10.2 19.8
35 7.4 13.2
25 4.8 8.6
Notes:
1. Branch ducts should have airflow velocities of about 80% of the values listed.
2. Velocities in final runouts to outlets should be 50% of the values or less.
3. Elbows and other fittings can increase airflow noise substantially, depending on the
type. Thus, duct airflow velocities should be reduced accordingly.
Table 4 Maximum Recommended “Free” Supply Outlet and
Return Air Opening Velocities Needed to Achieve Specified
Acoustic Design Criteria
Type of Opening Design RC(N)
“Free” Opening Airflow
Velocity, m/s
Supply air outlet 45 3.2
40 2.8
35 2.5
30 2.2
25 1.8
Return air opening 45 3.8
40 3.4
35 3.0
30 2.5
25 2.2
Note: The presence of diffusers or grilles can increase sound levels a little or a lot,
depending on how many diffusers or grilles are installed and on their design, construc-
tion, installation, etc. Thus, allowable outlet or opening airflow velocities should be
reduced accordingly.
Table 5 Decibels to Be Added to Diffuser Sound Rating to
Allow for Throttling of Volume Damper
Damper Pressure Ratio
1.5 2 2.5 3 4 6
Location of Volume Damper
dB to Be Added to
Diffuser Sound Rating
In neck of linear diffuser 5 9 12 15 18 24
In inlet of plenum of linear
diffuser
23 4569
In supply duct at least 1.5 m from
inlet plenum of linear diffuser
00 0235
Sound and Vibration Control 46.9
exceeds 1/4 the diffuser neck diameter over a length equal to two
times the diffuser neck diameter can cause a significant increase in
the diffuser sound power levels relative to the levels provided by the
manufacturer. If the diffuser offset is less than 1/8 the length of the
connection diameter, no appreciable increase in the sound power
level will occur. If the offset is equal to or greater than the neck dif-
fuser diameter over a connection length equal to two times the dif-
fuser neck diameter, the sound power levels associated with the
diffuser can increase as much as 12 dB.
At present, diffusers are rated in terms of noise criterion (NC)
levels, which include a receiver room sound correction of usually 8
to 10 dB. The ratings may be useful for comparison between and
among different diffusers, but are not helpful for design. The
designer should request from the diffuser manufacturer the compo-
nent sound power level data in octave bands, and use the sound
power to estimate the effects of the diffusers on the sound level in
different spaces.
Chillers and Air Cooled Condensers
All chillers and their associated equipment produce significant
amounts of both broadband and tonal noise. The broadband noise is
due to flows of both refrigerant and water, while the tonal noise is
caused by the rotation of compressors, motors, and fans (in fan-
cooled equipment). Chiller noise is usually significant in the octave
bands from 250 through 1000 Hz.
Compressors. All compressors, except absorption, produce
tonal noise. The acoustical differences among compressors gener-
ally relate to their tonal content.
• Centrifugal compressor tonal noise is due to the rotation of the
impeller and the gears in geared machines. The tonal content is
typically not very strong, except at reduced capacities. The cen-
trifugal compressor sound pressure level (L
p
) typically increases
at reduced chiller capacity due to the extra turbulence induced in
the refrigerant circuit by the inlet vanes. If, however, capacity is
reduced by motor speed control, the resulting compressor L
p
val-
ues decrease with decreasing capacity.
• Reciprocating compressor noise has a drumming quality,
caused by the oscillating motion of the pistons. The tonal content
is high and the sound level decreases very little with decreasing
capacity.
• Absorption chillers produce relatively little noise themselves,
but the flow of steam in their associated pumps and valves causes
significant high-frequency noise. Noise levels increase with
decreasing capacity as the valves close. Also, combustion air
blowers on direct gas fired units can be noisy.
• Scroll compressors have relatively weak tones, and when they
are found in capacities less than 260 kW, they may not cause
noise-related complaints.
• Screw compressors (sometimes called helical rotor or rotary
compressors) have very strong tones in the 250 through 2000 Hz
octave bands. The rotor-induced tones are amplified by reso-
nances in the oil separation circuit and by efficient sound radia-
tion by the condenser and evaporator shells that are rigidly
connected to the compressor via high-pressure piping. Recently,
screw compressors have been the sources of chiller noise com-
plaints; therefore, this type of compressor requires the most atten-
tion during noise and vibration control design.
Indoor Water-Cooled Chillers. The compressor is the domi-
nant noise source in most water-cooled chillers. Any of the five
compressor types listed previously can be used, but most water-
cooled chillers use a either centrifugal or screw compressors.
Factory sound data for indoor chillers is obtained via ARI Stan-
dard 575. The standard requires measuring the A-weighted and
octave band sound pressure level values at several locations that
are 1 m from the chiller and 1.5 m above the floor. Ratings are
generally available at operating points of 25%, 50%, and 100%
of a chiller’s nominal full capacity. The range of values for typi-
cal centrifugal and screw chillers is shown in Figure 8 and Figure
9, respectively.
ARI Standard 575 measurements are usually made in very large
rooms with large amounts of sound absorption. The measured levels
must be adjusted for each chiller installation to account for the size
and surface treatment conditions of the mechanical room. For a
Fig. 8 Typical Minimum and Maximum ARI-575 L
p
Values
for Centrifugal Chillers—450 to 4500 kW
Fig. 9 Typical Minimum and Maximum ARI-575 L
p
Values
for Screw Chillers—450 to 1400 kW
46.10 1999 ASHRAE Applications Handbook (SI)
given chiller at a given operating point, a small equipment room, or
one with mostly hard surface finishes, has a higher L
p
value than a
room that is large or has sound-absorbing treatments on its ceiling
and walls. Figure 10 shows maximum typical adjustment factors that
should be added to the factory provided values based on ARI Stan-
dard 575 to estimate the reverberant L
p
values in specific installa-
tions. The adjustment for each octave band requires knowing the size
of an imaginary box that is circumscribed 1 m away from the top and
sides of the chiller (the ARI Standard 575 Measurement Surface),
the dimensions of the equipment room and the average sound
absorption coefficient of the room surfaces. The adjustment in each
octave band depends on the ratio of the areas of the equipment room
and the imaginary box as well as the average sound absorption of the
room finishes. Each curve in Figure 10 is for a different value of the
average sound absorption, with the higher curves being for lower
values.
Example 1. Estimate the reverberant L
p
values in a 13.7 m by 12.2 m by 6.1
m tall mechanical equipment room (MER) that houses a 1260 kW cen-
trifugal chiller. The room has a concrete floor and gypsum board walls
and ceiling. The chiller dimensions are 1500 mm wide, 2000 mm tall,
and 3000 mm long.
Solution:
The ARI-575 Measurement Surface area S
M
is determined by add-
ing 1 m to the chiller height and 2 m to both its length and width. The
floor area is not included in this calculation. The result is a box that has
dimensions of 3500 mm wide, 5000 mm long, and 3000 mm tall. The
area of this box is approximately 70.7 m
2
. The area of the equipment
room (floor included) S
R
is 650 m
2
. Therefore, the ratio of the areas,
S
R
/S
M
, is 650/70.7 = 9.2. Assume that the average absorption coeffi-
cient value for room is 0.1 for all octave bands; therefore, refer to Fig-
ure 10 for the adjustment factor.
The approximate reverberant L
p
values in the last line of the
above example can be used along with the sound transmission loss
information found elsewhere in this chapter to estimate the trans-
mitted L
p
values in rooms adjacent to a chiller room.
Indoor chillers are offered with various types of factory noise
reduction options ranging from compressor blankets (2 to 6 dBA
reduction) to steel panel enclosures with sound absorbing inner sur-
faces (up to 18 dBA reduction). The amount of reduction is limited
because of the structure-borne transmission of compressor vibration
into the equipment frame and heat exchanger shells, which act as
sounding boards.
Field noise control options include full-size sheet metal housing
with specially-treated openings for piping, electrical conduit, and
ventilation. Sometimes upgraded building construction is neces-
sary. For more information refer to the section on Mechanical
Equipment Room Sound Isolation.
Outdoor Air-Cooled Chillers and Air-Cooled Condensers.
Most air-cooled chillers use either reciprocating, scroll, or screw
compressors. These chillers are also used as the chiller portion of
rooftop packaged units. The dominant noise sources in outdoor air-
cooled chillers are the compressors and the condenser fans, which
are typically low-cost, high-speed propeller fans. These fans are the
only significant noise source.
Factory sound data for outdoor equipment is obtained in accor-
dance with ARI Standard 370, which requires that the A-weighted
and octave band Sound Power Level (L
w
) value of the equipment be
determined. The range of ARI Standard 370 L
w
values for outdoor
chillers in the 70 to 1300 kW range is shown in Figure 11.
Factory-supplied noise reduction options for outdoor equipment
include compressor enclosures, oversized condenser fans, and vari-
able-speed condenser fans. Because air-cooled equipment needs a
free-flow of cooling air, full enclosures are not feasible; however,
strategically placed barriers can help reduce the noise propagation
on a selective basis. For more information see the section on Sound
Control for Outdoor Equipment.
Vibration Control. Typical chilled water systems include not
only compressors and fans but also water pumps. The associated
piping and conduit vibration generated by the compressors and
pumps can be transmitted to a building structure via the equipment
mounts or the attachments of the piping/conduit. Therefore, vibra-
tion isolation of a chiller requires essentially floating the entire
chiller water on resilient-attachment floor mounts and hangers.
Refer to the section on Vibration Isolation and Control for more
information on chiller vibration control.
If a chiller is to be mounted on an on-grade slab, vibration isola-
tors is not usually required unless an adjacent noise sensitive space
shares the common slab. In noise-sensitive applications (e.g., roof-
top chillers over occupied spaces), high deflection springs or air
mounts will likely be required. However, the potential problem of
wave resonance (or surge frequencies) common to all steel spring
and rubber pad vibration isolators must be considered. This reso-
nance is of particular concern with a screw chiller because the com-
pressor tones are typically in the same frequency range as the
isolator’s wave resonance. If one of the compressor tones happens to
coincide with one of the isolator resonances, the compressor tone can
readily be transmitted into the building structure causing excessive
structure-borne noise in the occupied space near the unit. It is impos-
sible to predict this occurrence in advance, so if it does happen the
Fig. 10 Estimated dB Buildup in Mechanical Room for
ARI-575 Chiller Sound Levels
63 125 250 500 1000 2000 4000 8000
ARI Std. 575
L
p
Values
73 74 73 72 74 72 69 63
Adjustment
from Fig. 10
77777 7 7 7
Approximate
rev L
p
in MER
80 81 80 79 81 79 76 70
46.12 1999 ASHRAE Applications Handbook (SI)
modes. At frequencies below f
co
, Equation (1) yields conservative
results. The actual attenuation usually exceeds the values given by
Equation (1) by 5 to 10 dB. Equation (1) usually always applies at
frequencies of 1000 Hz and higher.
Example 2. A plenum chamber is 1.8 m high, 1.2 m wide, and 1.8 m long.
The configuration of the plenum is similar to that shown in Figure 12.
The inlet and outlet are each 0.9 m wide by 0.6 m high. The horizontal
distance between centers of the plenum inlet and outlet is 0.3 m. The
vertical distance is 1.2 m. The plenum is lined with 25 mm thick, 48
kg/m
3
density fiberglass insulation board. All of the inside surfaces of
the plenum is lined with fiberglass insulation. Determine the transmis-
sion loss associated with this plenum. See Table 6 for the values of the
absorption coefficients.
Solution:
The areas of the inlet section, outlet section, and plenum cross-sec-
tion are
l = 1.8 m; r
v
= 1.2 m; and r
h
= 0.3 m. The values of r and cos θ are
The total inside surface area of the plenum is
The value of f
co
is
The results are tabulated as follows.
Unlined Rectangular Sheet Metal Ducts
Straight unlined rectangular sheet metal ducts provide a fairly
significant amount of low frequency sound attenuation. Table 7
shows the results of selected unlined rectangular sheet metal ducts
(Cummings 1983, Reynolds and Bledsoe 1989b, Ver 1978, Woods
1973). The attenuation values shown in Table 7 apply only to rect-
angular sheet metal ducts with the lightest gages allowed according
to SMACNA duct construction standards.
Sound energy attenuated at low frequencies in rectangular ducts
may manifest itself as breakout noise elsewhere along the duct.
Low-frequency breakout noise should therefore be checked.
Acoustically Lined Rectangular Sheet Metal Ducts
Internal duct lining for rectangular sheet metal ducts can be
used to attenuate sound in ducts and to thermally insulate ducts.
The thickness of duct linings associated with thermal insulation
usually varies from 13 to 50 mm. For fiberglass duct lining to be
effective for attenuating fan sound, it must have a minimum thick-
ness of 25 mm. Tables 8 and 9 give the attenuation values of
selected rectangular sheet metal ducts for 25 mm and 50 mm duct
lining, respectively (Kuntz 1986, Kuntz and Hoover 1987, Machen
and Haines 1983, Reynolds and Bledsoe 1989b). Note that the
attenuation values shown in Tables 8 and 9 are based on laboratory
tests using 3 m lengths of duct, and may be used with confidence
for lined duct lengths at 3 m. For designs incorporating more than
3 m of lined rectangular duct, actual dB/m will be less than shown
in Tables 8 and 9 while total attenuated noise will never be below
the generated noise level in the duct. The density of the fiberglass
lining used in lined rectangular sheet metal ducts usually varies
between 24 and 48 kg/m
3
.
The insertion loss values given in Tables 8 and 9 are the differ-
ence in the sound pressure level measured in a reverberation room
with sound propagating through an unlined section of rectangular
duct minus the corresponding sound pressure level that is measured
when the unlined section of rectangular duct is replaced with a sim-
ilar section of acoustically lined rectangular duct. The attenuation of
the unlined duct is subtracted out during the process of calculating
the insertion loss from measured data.
Insertion loss and attenuation values discussed in this section
apply only to rectangular sheet metal ducts made with the lightest
gages allowed according to SMACNA duct construction standards.
Unlined Round Sheet Metal Ducts
As with unlined rectangular ducts, unlined round ducts provide
some natural sound attenuation that should be considered when
designing a duct system. In contrast to rectangular ducts, round
ducts are much more rigid and, therefore, do not resonate or absorb
as much sound energy. Because of this, round ducts will only pro-
vide about 1/10 the sound attenuation at low frequencies as com-
pared to the sound attenuation associated with rectangular ducts.
Table 10 list sound attenuation values for unlined round circular
ducts (Woods 1973, ASHRAE 1987).
Acoustically Lined Round Sheet Metal Ducts
The literature has little data for the insertion loss of acousti-
cally lined round ducts. The data that are available are usually
manufacturer’s product data. Tables 11 and 12 give the insertion
loss values for dual-wall round sheet metal ducts with 25 mm and
50 mm acoustical lining, respectively (Reynolds and Bledsoe
1989a). The acoustical lining for the ducts is a 12 kg/m
3
density
fiberglass blanket, and the fiberglass is covered with an internal
liner of perforated galvanized sheet metal that has on open area of
Table 6 Sound Absorption Coefficients of
Selected Plenum Materials
Octave Band Center Frequency, Hz
63 125 250 500 1000 2000 4000
Non-Sound-Absorbing Material
Concrete 0.01 0.01 0.01 0.02 0.02 0.02 0.03
Bare sheet metal 0.04 0.04 0.04 0.05 0.05 0.05 0.07
Sound-Absorbing Material (Fiberglass Insulation Board)
25 mm, 48 kg/m
3
0.05 0.11 0.28 0.68 0.90 0.93 0.96
50 mm, 48 kg/m
3
0.10 0.17 0.86 1.00 1.00 1.00 1.00
75 mm, 48 kg/m
3
0.30 0.53 1.00 1.00 1.00 1.00 1.00
100 mm, 48 kg/m
3
0.50 0.84 1.00 1.00 1.00 1.00 0.97
Note: The 63 Hz values are estimated from higher frequency values.
Octave Band Center Frequency, Hz
63 125 250 500 1000 2000 4000
Qcosθ/4πr
2
——
0.055 0.055 0.055 0.055 0.055
(1 − α
A
)/Sα
A
——
0.1832 0.0335 0.0079 0.0054 0.0030
TL, dB —— 9 13151515
S
in
0.9 0.6
×
0.54 m
2
==
S
out
0.9 0.6
×
0.54 m
2
==
S
pl
1.8 1.2
×
2.16 m
2
==
r
2
1.8
2
1.2
2
0.3
2
+ + 2.184 m=
θ
cos 1.8 2.184
⁄
0.824==
S 2 1.2 1.8
×()
2 1.2 1.8
×()
2 1.8 1.8
×()
1.1–+ + 14.4 m
2
==
f
co
343 2 0.9
×()⁄
190 Hz==
Table 7 Sound Attenuation in Unlined Rectangular
Sheet Metal Ducts
Duct Size,
mm × mm
P/A
1/mm
Attenuation, dB/m
Octave Band Center Frequency, Hz
63 125 250 >250
150 × 150 0.26 0.98 0.66 0.33 0.33
305 × 305 0.13 1.15 0.66 0.33 0.20
305 × 610 0.10 1.31 0.66 0.33 0.16
610 × 610 0.07 0.82 0.66 0.33 0.10
1220 × 1220 0.03 0.49 0.33 0.23 0.07
1830 × 1830 0.02 0.33 0.33 0.16 0.07
Sound and Vibration Control 46.15
There are three types of HVAC duct silencers: dissipative (with
acoustic media), reactive (no media), and active silencers.
• Dissipative silencers (Figure 14) generally use perforated metal
surfaces covering acoustic grade fiberglass to attenuate sound
over a broad range of frequencies. Airflow does not significantly
affect the insertion loss if pressure drops are under 87 Pa.
• Reactive silencers use tuned perforated metal facings covering
tuned chambers void of any fibrous material. The outside physi-
cal appearance of reactive silencers is similar to its dissipative
counterpart (Figure 14). Because of tuning, broadband insertion
loss is more difficult to achieve than with dissipative silencers.
Longer lengths may be required to achieve similar insertion loss
performance as dissipative silencers. Airflow generally increases
the insertion loss of reactive silencers.
• Active duct silencers (Figure 15) reduce noise at lower frequen-
cies by producing inverse sound waves that cancel the unwanted
noise. An input microphone measures the noise in the duct and
converts it to electrical signals. These signals are processed by a
digital computer where exact opposite, mirror-image sound
waves of equal amplitude are generated. This secondary noise
source destructively interferes with the noise and cancels a signif-
icant portion of the unwanted sound. An error microphone mea-
sures the residual sound beyond the silencer and provides
feedback to adjust the computer model to increase performance.
Because the components are mounted outside the airflow, there is
no pressure loss or generated noise. Performance is limited, how-
ever, by the presence of excessive turbulence in the airflow
detected by the microphones. Manufacturers recommend using
active silencers where duct velocity is less than 7.6 m/s and where
the duct configurations are conducive to smooth evenly distrib-
uted airflow.
Data for dissipative and reactive silencers should be obtained
from tests in a manner consistent with the procedures outlined in
the most current version of ASTM Standard E477. (This standard
has not been verified for determining performance of active silenc-
ers.) Since insertion loss measurements use a substitution tech-
nique, reasonable (+
3dB) insertion loss values can be achieved
down to 63 Hz. Airflow generated noise, however, cannot be mea-
sured accurately below 100 Hz due to the lack of a standardized
means of qualifying the reverberant rooms for sound power mea-
surements at lower frequencies (a function of room size). A recent
series round robin tests has shown that airflow generated sound
Table 16 Lined Flexible Duct Insertion Loss
Diameter,
mm
Length,
m
Insertion Loss, dB
Octave Band Center Frequency, Hz
63 125 250 500 1000 2000 4000
100 3.7 6 111231 37 42 27
2.7 5 8 9 23 28 32 20
1.8 3 6 6 16 19 21 14
0.9 2 3 3 8 9 11 7
125 3.7 7 121432 38 41 26
2.75 9112429 3120
1.8 4 6 7 16 19 21 13
0.92 3 4 81010 7
150 3.7 8 121733 38 40 26
2.76 9132529 3020
1.8 4 6 9 17 19 20 13
0.92 3 4 81010 7
175 3.7 9 121933 37 38 25
2.76 9142528 2919
1.84 6101719 1913
0.9 2 3 5 8 9 10 6
200 3.7 8 112133 37 37 24
2.76 8162528 2818
1.84 6111719 1912
0.92358996
225 3.7 8 112233 37 36 22
2.76 8172528 2717
1.84 6111719 18 11
0.92368996
250 3.7 8 102232 36 34 21
2.76 8172427 2616
1.84 5111618 17 11
0.92368995
300 3.7 7 9 20 30 34 31 18
2.75 7152326 2314
1.83 5101517 16 9
0.92258985
350 3.7 5 7 16 27 31 27 14
2.74 5122023 20 11
1.8 3 4 8 14 16 14 7
0.91247874
400 3.7 2 4 9 23 28 23 9
2.7 2 3 7 17 21 17 7
1.8 1 2 5 12 14 12 5
0.91126762
Note: The 63 Hz insertion loss values are estimated from higher frequency insertion
loss values.
Fig. 14 Dissipative Duct Silencers
46.18 1999 ASHRAE Applications Handbook (SI)
be caused by variations in fan, motor or fan belt RPM or by airflow
instabilities transmitted to the fan housing or nearby connected
ductwork. When the air pressure fluctuations encounter large, flat,
unreinforced duct surfaces that have resonance frequencies near or
equal to the disturbing frequencies, the duct surfaces will vibrate
(Ebbing et al. 1978). This vibration occurs in the stiffness- or res-
onance-controlled regions of the duct. In typical HVAC duct sys-
tems, duct wall vibration can produce sound pressure levels of the
order of 65 to 95 dB at frequencies that range from 10 Hz to 100 Hz.
This type of duct-generated sound is generally called duct rumble
(Figure 16).
Figure 17 shows typical duct configurations that can exist near a
centrifugal fan. Fair to bad configurations can result in duct rumble.
Good to optimum designs of fan inlet and discharge transitions min-
imize the potential for duct rumble; however, these designs may not
completely eliminate the potential for duct rumble.
Duct rumble can be eliminated or reduced by several methods.
One method is to alter the fan, motor, or fan belt speed. This method
changes the frequency of the air pressure fluctuations so that they
differ from the duct wall resonance frequencies, and duct rumble
may not occur or at least will be reduced. Another measure is to
apply rigid materials, such as duct reinforcements and drywall,
directly to the duct wall to change the wall resonant frequency (Fig-
ure 18). Noise reductions of 5 to 11 dB in the 31.5 Hz and 63 Hz
octave frequency bands have been recorded using this treatment.
Mass-loaded materials applied in combination with absorptive
materials do not alleviate duct rumble noise into a space unless both
materials are completely decoupled from the vibrating duct wall.
This means they are significantly separated from the duct and do not
touch it. An example of this type of construction, using two layers
of drywall, is shown in Figure 19. Because the treatment is decou-
pled from the duct wall, it provides the greatest noise reduction.
Mass-loaded materials combined with absorptive materials that are
directly attached to the duct wall are not effective in reducing duct
rumble (Figure 20). Mass-loaded flexible material wrapped over an
absorptive layer of material on a round duct (which is less prone to
low frequency rumble due to the greater inherent stiffness compared
to rectangular ducts) can effectively control noise and may be the
only one possible solution due to space limitations. This type of
treatment is often used on piping.
Sound Breakout and Breakin from Ducts
Breakout is the sound associated with fan or airflow noise inside
a duct that radiates through the duct walls into the surrounding area
(Figure 21). Breakout can be a problem if it is not adequately atten-
uated before the duct runs over an occupied space (Cummings 1983,
Lilly 1987). Sound that is transmitted into a duct from the surround-
ing area is called breakin (Figure 22).
The transmission loss characteristics of ducts are presented in
this volume in a simpler form than in previous editions of the hand-
book to make them easier to understand and use. This simplified
treatment ignores sound energy attenuation along the duct and can
be applied to ducts where the critical length of duct for noise radia-
tion is the first 6 to 9 m.
Fig. 18 Drywall Lagging on Duct for Duct Rumble
Fig. 19 Decoupled Drywall Enclosure for Duct Rumble
Fig. 20 Rectangular Duct with External Lagging
Fig. 21 Duct Breakout
Fig. 22 Duct Breakin
Sound and Vibration Control 46.19
Breakout Sound Transmission from Ducts. The sound power
level associated with sound transmitted through a duct wall and then
radiated from the exterior surface of the duct wall is given by
(7)
where
L
w(out)
= sound power level of sound radiated from outside surface of
duct walls, dB
L
w(in)
= sound power level of sound inside duct, dB
S = surface area of outside sound-radiating surface of duct, m
2
A = cross-sectional area of inside of duct, m
2
TL
out
= normalized duct breakout transmission loss
(independent of S and A), dB
Values for TL
out
for rectangular ducts are given in Table 20, for
round ducts are given in Table 21, and for flat-oval ducts are given
in Table 22 (Cummings 1983, 1985). The equations for S and A for
rectangular ducts are
S = 2L(a + b)(8)
A = ab (9)
where
a = larger duct cross-section dimension, m
b = smaller duct cross-section dimension, m
L = length of the duct sound radiating surface, m
The equations for S and A for round ducts are
S = Lπd (10)
A = πd
2
/4 (11)
where
d = duct diameter, m
L = length of duct sound radiating surface, m
The equations for S and A for flat-oval ducts are
L[2(a − b) + πb](12)
(13)
where
a = length of larger major axis, m
b = length of minor duct axis, m
L = length of duct sound radiating surface, m
Equation (7) assumes no interior sound attenuation along the
length of the duct sound radiating surface. Thus, it is valid only for
unlined ducts. It is generally valid for duct lengths up to 9 m. L
w(out)
must always be equal to or less than L
w(in)
.
For applications where the duct is exposed, the sound pressure
level in an occupied space as a result of duct sound breakout can be
obtained from
L
p
= L
w(out)
- 10log(p rL)(14)
where
L
p
= sound pressure level at specified point in the space, dB
L
w(out)
= sound power level of sound radiated from outside surface
of duct walls given by Equation (7), dB
r = distance between duct and position at which L
p
is being calculated, m
L = length of duct sound radiating surface, m
Equation (14) does not apply when the duct is in a plenum, con-
cealed behind a suspended ceiling. In such cases, simply subtract
the attenuation for ceilings listed in Table 23 instead of 10log(prL)
and assume the sound field in the room is uniform.
Example 3. A 305 mm by 1220 mm by 4.57 m long rectangular supply
duct above a mineral fiber lay-in tile ceiling is constructed of 22 gage
(0.853 mm) sheet metal. Given the sound power levels in the duct, what
are the sound pressure levels at a listener 1.52 m from the duct?
Solution:
The RC level associated with the above L
p
values is RC 28 (LFVb).
Table 20 TL
out
Versus Frequency for Rectangular Ducts
Duct Size,
mm × mm Gage
TL
out
, dB
Octave Band Center Frequency, Hz
63 125 250 500 1000 2000 4000 8000
305 × 30524 2124273033364145
305 × 61024 1922252831354145
305 × 1220 22 19 22 25 28 31 37 43 45
610 × 61022 20232629 32374345
610 × 122020 2023262931394545
1220 × 1220 18 21 24 27 30 35 41 45 45
1220 × 2440 18 19 22 25 29 35 41 45 45
Note: The data are for duct lengths of 6.1 m, but the values may be used for the cross-
section shown regardless of length.
Table 21 Experimentally Measured TL
out
Versus Frequency
for Round Ducts
Diameter,
mm
Length,
m Gage
TL
out
, dB
Octave Band Center Frequency, Hz
63 125 250 500 1000 2000 4000
Long Seam Ducts
205 4.6 26 >45 (53) 55 52 44 35 34
355 4.6 24 >50 60 54 36 34 31 25
560 4.6 22 >47 53 37 33 33 27 25
815 4.6 22 (51) 46 26 26 24 22 38
Spiral Wound Ducts
205 3.0 26 >48 >64 >75 72 56 56 46
355 3.0 26 >43 >53 55 33 34 35 25
660 3.0 24 >45 50 26 26 25 22 36
660 3.0 16 >48 53 36 32 32 28 41
815 3.0 22 >43 42 28 25 26 24 40
Note: In cases where background sound swamped the sound radiated from the duct
walls, a lower limit on TL
out
is indicated by a > sign. Parentheses indicate measure-
ments in which background sound has produced a greater uncertainty than usual.
Table 22 TL
out
Versus Frequency for Flat Oval Ducts
Duct Size,
mm × mm Gage
TL
out
, dB
Octave Band Center Frequency, Hz
63 125 250 500 1000 2000 4000
305 × 150243134374043——
610 × 150242427303336——
610 × 3052428313437———
1220 × 305 22 23 26 29 32 — — —
1220 × 610 22 27 30 33 — — — —
2440 × 610 20 22 25 28 — — — —
2440 × 1220 18 28 31—————
Note: The data are for duct lengths of 6.1 m, but the values may be used for the cross-
section shown regardless of length.
L
w out
()
L
win
()
10 SA⁄()log TL
out
–+=
Octave Band Center Frequency, Hz
63 125 250 500 1000 2000 4000
L
w(in)
90 85 80 75 70 65 60
− TL
out
(Table 20) −19 −22 −25 −28 −31 −37 −43
10 log (S/A)16161616161616
L
w(out)
87 79 71 63 55 44 33
− Ceiling tile (Table 23) −13 −16 −18 −20 −26 −.31 −36
L
p
, dB 74 63 53 43 29 13 −3
Abab–()
πb
2
4
+=
Sound and Vibration Control 46.21
For a point source in an enclosed space, classical diffuse-field
theory predicts that as the distance between the source and point of
observation is increased, the sound pressure level initially decreases
at the rate of 6 dB per doubling of distance. At some point, the rever-
berant sound field begins to dominate and the sound pressure level
remains at a constant level.
Schultz (1985) and Thompson (1981) found that diffuse-field
theory does not apply in real-world rooms with furniture or other
sound-scattering objects. Instead, the sound pressure levels
decrease at the rate of around 3 dB per every doubling of distance
between the sound source and the point of observation. Generally, a
reverberant sound field does not exist in small rooms (room vol-
umes less than 420 m
3
). In large rooms (room volumes greater than
420 m
3
), reverberant fields usually exist, but usually at distances
from the sound sources that are significantly greater than those pre-
dicted by diffuse-field theory.
Point Sound Sources
Most normally furnished rooms with regular proportions have
acoustic characteristics that range from average to medium dead.
These usually include carpeted rooms that have sound absorptive
ceilings. If a normally furnished room has a room volume less than
420 m
3
and the sound source is a single point source, the sound pres-
sure levels associated with the sound source can be obtained from
(16)
where
L
p
= sound pressure level at specified distance from sound source, dB
L
w
= sound power level of sound source, dB
Values for A and B are given in Tables 27 and 28. If a normally
furnished room has a room volume greater than 420 m
3
and the
sound source is a single point source, the sound pressure levels asso-
ciated with the sound source can be obtained from
(17)
Values for C are given in Table 29. Equation (17) can be used for
room volumes of up to 4250 m
3
. The accuracy of Equations (16) and
(17) is typically within 2 to 5 dB.
Table 24 TL
in
Versus Frequency for Rectangular Ducts
Duct Size,
mm × mm Gage
TL
out
, dB
Octave Band Center Frequency, Hz
63 125 250 500 1000 2000 4000 8000
305 × 305 24 16 16 16 25 30 33 38 42
305 × 610 24 15 15 17 25 28 32 38 42
305 × 1220 22 14 14 22 25 28 34 40 42
610 × 610 22 13 13 21 26 29 34 40 42
610 × 1220 20 12 15 23 26 28 36 42 42
1220 × 122018 10192427 32384242
1220 × 244018 11192226 32384242
Note: The data are for duct lengths of 6.1 m, but the values may be used for the cross-
section shown regardless of length.
Table 25 Experimentally Measured TL
in
Versus Frequency
for Circular Ducts
Diameter,
mm
Length,
m Gage
TL
in
, dB
Octave Band Center Frequency, Hz
63 125 250 500 1000 2000 4000
Long Seam Ducts
205 4.6 26 >17 (31) 39 42 41 32 31
355 4.6 24>2743433131 28 22
560 4.6 22>2840303030 24 22
815 4.6 22 (35) 36 23 23 21 19 35
Spiral Wound Ducts
205 3.0 26 >20 >42 >59 >62 53 43 26
355 3.0 26 >20 >36 44 28 31 32 22
660 3.0 24>2738202322 19 33
660 3.0 16 >30 >41 30 29 29 25 38
815 3.0 22>2732252223 21 37
Note: In cases where background sound swamped the sound radiated from the duct
walls, a lower limit on TL
in
is indicated by a > sign. Parentheses indicate measure-
ments in which background sound has produced a greater uncertainty than usual.
Table 26 TL
in
Versus Frequency for Flat Oval Ducts
Duct Size,
mm × mm Gage
TL
in
, dB
Octave Band Center Frequency, Hz
63 125 250 500 1000 2000 4000
305 × 150 24 18 18 22 31 40 — —
610 × 150 24 17 17 18 30 33 — —
610 × 305 24 15 16 25 34 — — —
1220 × 305 22 14 14 26 29 — — —
1220 × 610 22 12 21 30 ————
2440 × 610 20 11 22 25 ————
2440 × 122018 1928—————
Note: The data are for duct lengths of 6.1 m, but the values may be used for the cross-
section shown regardless of length.
Table 27 Values for A in Equation (16)
Room Volume,
m
3
Value for A, dB
Octave Band Center Frequency, Hz
63 125 250 500 1000 2000 4000
42 43210−1 −2
71 3210−1 −2 −3
113 2 1 0 −1 −2 −3 −4
170 1 0 −1 −2 −3 −4 −5
283 0 −1 −2 −3 −4 −5 −6
425 −1 −2 −3 −4 −5 −6 −7
Table 28 Values for B in Equation (16)
Distance from Sound Source, m Value for B, dB
0.9 5
1.2 6
1.5 7
1.8 8
2.4 9
3.0 10
4.0 11
4.9 12
6.1 13
Table 29 Values for C in Equation (17)
Distance from
Sound Source, m
Value for C, dB
Octave Band Center Frequency, Hz
63 125 250 500 1000 2000 4000
0.9 55666710
1.2 67778912
1.5 788891114
1.8 8 9 9 9101216
2.4 9 10 10 11 12 14 18
3.0 10111212131620
4.0 11121313151822
4.9 12131415161924
6.1 13151516172026
7.6 14161617192228
9.8 15171718202330
L
p
L
w
AB–+=
L
p
L
w
C–5–=
Sound and Vibration Control 46.23
1995). The shape of these curves differs from the NC curves so as to
achieve a well-balanced bland-sounding spectrum, and two addi-
tional octave bands (16 and 31 Hz) are added to include possible
excessive low-frequency noise. This rating procedure assesses
background noise in spaces, both on the basis of its effect on speech
communication and on subjective sound quality. The rating is
expressed as RC followed by a number to show the level of the noise
and a letter to indicate the quality, for example, RC 35(N) where N
denotes neutral.
dBA A-Weighted Sound Level
The A-weighted sound level (described in Chapter 7 of the 1997
ASHRAE Handbook—Fundamentals) is a single-number measure
of the relative loudness of noise that is used extensively in outdoor
environmental noise standards. The rating is expressed as a number
followed by dBA, for example, 40 dBA.
A-weighted sound levels can be measured with simple sound
level meters. The ratings correlate well with human judgments of
relative loudness but take no account of spectral balance or sound
quality. Thus many different-sounding spectra can result in the same
numeric value, but have quite different subjective qualities.
NCB Balanced Noise Criteria Method
The NCB method (Beranek 1989) is used to specify or evaluate
room noise and includes noise due to occupant activities. The NCB
criterion curves (Figure 24) are intended as replacements for the NC
curves, and include two additional low frequency octave bands (16
and 31 Hz), and lower permissible noise levels at high frequencies
(4000 and 8000 Hz). The NCB rating procedure is based on a speech
interference level (SIL) (SIL = average of four sound pressure levels
at octave band mid-frequencies of 500, 1000, 2000, and 4000 Hz),
and on additional tests for rumble and hiss compliance. The rating
is expressed as NCB followed by a number, for example, NCB 40.
The NCB method is better than the NC method in determining
whether a noise spectrum has an unbalanced shape sufficient to
demand corrective action, and it addresses the issue of low fre-
quency noise. The rating procedure is, however, more complicated
than the familiar tangency method.
RC Mark II Room Criteria Method
Based on experience and the findings from ASHRAE sponsored
research (Broner 1994), the RC method was revised to the RC Mark
II method (Blazier 1997). Like its predecessor, the RC Mark II
method is intended for rating the sound performance of an HVAC
system as a whole. The method can also be used as a diagnostic tool
for analyzing noise problems in the field. The RC Mark II method
is more complicated to use than the RC method, but spreadsheet
macros are available to do the calculations and graphical analysis.
The RC Mark II method has three parts: (1) a family of criterion
curves such as shown in Figure 25, (2) a procedure for determining
the RC numerical rating and the noise spectral balance (quality),
and (3) a procedure for estimation of occupant satisfaction when the
spectrum does not have the shape of an RC curve (Quality Assess-
ment Index) (Blazier 1995).
The rating is expressed as RC followed by a number and a letter,
for example, RC 35(N). The number is the arithmetic average
rounded to the nearest integer of the sound pressure levels in the
500, 1000, and 2000 Hz octave bands (the principal speech fre-
quency region). The letter identifies the perceived character of the
sound: (N) for neutral, (LF) for low frequency rumble, (MF) for mid
frequency roar, and (HF) for high frequency hiss. There are also two
subcategories of the low frequency descriptor: (LFB), denoting a
moderate but perceptible degree of sound induced ceiling/wall
vibration, and (LFA), denoting a noticeable degree of sound
induced vibration.
Each reference curve in Figure 25 identifies the shape of a neu-
tral, bland-sounding spectrum, indexed to a curve number corre-
sponding to the sound level in the 1000 Hz octave-band. The shape
of these curves is based on work by Blazier (1981a,b), modified at
16 Hz following research by Broner (1994). Regions A and B
denote levels at which sound can induce vibration in light wall and
ceiling construction that can potentially cause rattles in light fix-
tures, furniture, etc. Curve T is the octave-band threshold of hearing
as defined by ANSI Standard S12.2.
Table 31 Comparison of Sound Rating Methods
Meth. Overview
Considers
Speech
Inter-
ference
Evaluates
Sound
Quality
Components
Currently
Rated by
Method
NC Can rate components
No quality assessment
Does not evaluate
low-frequency rumble
Yes No Air terminals
Diffusers
RC Used to evaluate systems
Should not be used to
evaluate components
Can be used to evaluate
sound quality
Provides some diagnostic
capability
Yes Yes
dBA Can be determined using
sound level meter
No quality assessment
Frequently used for outdoor
noise ordinances
Yes No Cooling
towers
Water chillers
Condensing
units
NCB Can rate components
Some quality assessment
Yes Yes
RC
Mark
II
Evaluates sound quality
Provides improved
diagnostics capability
Yes Yes
Fig. 24 NCB Noise Criterion Curves
Drawn from ANSI Standard S 12.2