Báo cáo y học: "BCR-ABL1-independent PI3Kinase activation causing imatinib-resistance" ppsx
Bạn đang xem bản rút gọn của tài liệu. Xem và tải ngay bản đầy đủ của tài liệu tại đây (878.15 KB, 10 trang )
RESEARCH Open Access
BCR-ABL1-independent PI3Kinase activation
causing imatinib-resistance
Hilmar Quentmeier
*
, Sonja Eberth, Julia Romani, Margarete Zaborski, Hans G Drexler
Abstract
Background: The BCR-ABL1 translocation occurs in chronic myeloid leukemia (CML) and in 25% of cases with
acute lymphoblastic leukemia (ALL). The advent of tyrosine kinase inhibitors (TKI) has fundamentally changed the
treatment of CML. However, TKI are not equally effective for treating ALL. Furthermore, de novo or secondary TKI-
resistance is a significant problem in CML. We screened a panel of BCR-ABL1 positive ALL and CML cell lines to find
models for imatinib-resistance.
Results: Five of 19 BCR-ABL1 positive cell lines were resistant to imatinib-induced apoptosis (KCL-22, MHH-TALL1,
NALM-1, SD-1, SUP-B15). None of the resistant cell lines carried mutations in the kinase domain of BCR-ABL1 and all
showed resistance to second generation TKI, nilotinib or dasatinib. STAT5, ERK1/2 and the ribosomal S6 protein
(RPS6) are BCR-ABL1 downstream effectors, and all three proteins are dephosphorylated by imatinib in sensitive cell
lines. TKI-resistant phosphorylation of RPS6, but responsiveness as regards JAK/STAT5 and ERK1/2 signalling were
characteristic for resistant cell lines. PI3K pathway inhibitors effected dephosphorylation of RPS6 in imatinib-resistant
cell lines suggesting that an oncogene other than BCR-ABL1 might be responsible for activation of the PI3K/AKT1/
mTOR pathway, which would explain the TKI resistance of these cells. We show that the TKI-resistant cell line KCL-
22 carries a PI3Ka E545G mutation, a site critical for the constitutive activatio n of the PI3K/AKT1 pathway.
Apoptosis in TKI-resistant cells could be induced by inhibition of AKT1, but not of mTOR.
Conclusion: We introduce five Philadelphia-chromosome positive cell lines as TKI-resistance models. None of these
cell lines carries mutations in the kinase domain of BCR-ABL1 or other molecular aberrations previously indicted in
the context of imatinib-resistance. These cell lines are unique as they dephosphorylate ERK1/2 and STAT5 after
treatment with imatinib, while PI3K/AKT1/mTOR activity remains unaffected. Inhibition of AKT1 leads to apoptosis
in the imatinib-resistant cell lines. In conclusion, Ph+ cell lines show a form of imatinib-resistance attributable to
constitutive activation of the PI3K/AKT1 pathway. Mutations in PIK3CA, as observed in cell line KCL-22, or PI3K
activating oncogenes may undelie TKI-resistance in these cell lines.
Background
Expression of the Philadelphia c hromosome (Ph), result-
ing from fusion of the non-receptor tyrosine kinase ABL1
on chromosome 9 with BCR on chro mosome 21, is the
hallmark of chronic myeloid leukemia (CML), but is also
found in 20-30% of acute lymphoblastic leukemia (ALL)
cases. The developmen t of clinically applicable tyrosine
kinase inhibitors (TKI) has fundamentally changed the
treatment of patients with CML: imatinib mesylate
induces hematologic remission in nearly all CML patients
[1]. In Ph+ ALL, i matinib is much less effective [2].
Causes for imatinib-resistance are (i) the development of
cell clones carrying mut ations in the kinase domain of
BCR-ABL1 [3,4]; (ii) low intracellular drug levels caused
by disordered expression of influx and efflux transporters
[5,6]; (iii) overexpression of BCR-ABL1 [7,8]; and (iv)
activation of alternative signalling pathways by oncogenic
enzymes like v-src sarcoma viral oncogene homolog
(SRC) kinases [9,10] or guanosine triphosphatases
(GTPases) [11].
Many studies performed to elucidate imatinib-resis-
tance have made use of cells ectopically expressing
BCR-ABL1 or of cell lines which gained resistance after
prolonged e xposure to rising drug concentrations [6,7].
Cell lines that were inherently imatinib-resistant have
* Correspondence:
Leibniz-Institute DSMZ - German Collection of Microorganisms and Cell
Cultures, Braunschweig, Germany
Quentmeier et al. Journal of Hematology & Oncology 2011, 4:6
/>JOURNAL OF HEMATOLOGY
& ONCOLOGY
© 2011 Quentmeier et al; licensee BioMed Central Ltd. This is an Open Access article distributed under the terms of the Creative
Commons Attribution License (http://creat ivecommons.org/licenses/by/2.0), which permits unrestricted use, distribution, and
reproduction in any medium, provided the original work is properly cited.
rarely been used, which is aston ishing because imatinib-
resistant cell lines KCL-22 and SD-1 were described
very early, in 1997 [12]. Here, we screened the DSMZ
cell lines bank to find imatinib-resistant BCR-ABL1
positive cell lines. Five out of 19 Ph+ cell lines (26%)
were resistant to imatinib. We set out to investigate
whether these cell lines displayed t he known mole cular
and cellular causes for imatinib-resistance.
Results and Disc ussion
Imatinib-resistant BCR-ABL1 positive cell lines
A panel of Ph+ ALL and CML cell lines was tested in
[
3
H]-thymidine and annexin-V/propidium iodide (PI)
assays to find models for TKI-resistance studies (Figure 1).
In 14/19 BCR-ABL1 positive cell lines, IC50 values for
imatinib were in the range of 50 nM to 200 nM. Five cell
lines showed markedly higher IC50 values: KCL-22
(800 nM), MHH-TALL1 (1 μM), NALM-1 (> 10 μM), SD-
1(>10μM) , and SUP-B15 (2 μM) (Table 1). These cell
lines were inherently resistant to imatinib according to the
results of proliferation and apoptosis assays, as they had
not been preincubated with the TKI.
BCR-ABL1 mutations, BCR-ABL1 expression, imatinib
transporters
Point mutations in the kinase domain of BCR-ABL1 are
the main cause of imatinib-resistanc e in the chronic
phase of CML [13]. Although second generation BCR-
ABL1 inhibitors (nilotinib, dasatinib) are effective in
most BCR-ABL1 mutated cases, all 5 imatinib-insensitive
cell lines identified here were also resistant to nilotinib
sugges ting that resistance might not be caused by BCR-
ABL1 mutations (Table 1). In accordance with this
notion, genomic sequencing showed no sequence altera-
tions in the kinase domain of the resistant cell lines
(Table 1).
The DNA-binding protein Ikaros is a major regulator
of lymphoid development [14]. Deletion of Ikaros is
found in the majority of BCR-ABL1-positive ALL and of
CML in progression to lymphoid blast crisis [15,16].
Public genomic arr ay data indicate hemizygous loss of
the 7p12 region in cell line NALM-1, includi ng IKZF1
and the neighbouring gene Dopa decarboxylase (DDC)
/>10kCGHviewer.cgi?chr=7&dna=NALM-1. Genomic PCR
analysis confirmed loss of IKZF1 in this cell line, but
not in cell lines SD-1, SUP-B15 and MHH-TALL-1
(Additional File 1). However, the majority of Ph+ ALL
with IKZF1 aberrations do not show deletion of the
whole gene, but instead intragenic loss of various IKZF1
exons, leading to the expression of mRNA variants that
mimic “normal” splice variants [15,16]. A recent publi-
cation correlates expression of the Ikaros variant Ik6
with high BCR-ABL1 mRNA levels and imatinib-
resistance in Ph+ ALL [17]. We could not confirm this
correlation among Ph+ ALL and CML cell lines: Ik6
was expressed in 2/19 BCR-ABL1 positive cell lines, one
being imatinib sensitive (BV-173) and one resistant
(SUP-B15) (Table 1). Neither cell line SUP-B15 nor
most other TKI-resistant cell lines showed particularly
high BCR-ABL1 expression levels according to quantita-
tive RT-PCR analysis (Table 1). The only exception was
cell line KCL-22 with about 2-fold higher BCR-ABL1
expression levels, both at the mRNA (Table 1) and the
protein level (not shown). While supporting the notion
that a causative correlation might exist between the
high expression of the mutated kinase and imatinib-
resistance for cell line KCL-22, these results also showed
that in 4/5 cell lines TKI-resistance was not the conse-
quence of BCR-ABL1 overexpression (Table 1).
Thus, neither BCR-ABL1 mutations nor overexpres-
sion of the kinase were the general cause for ima tinib-
resistance in these cell lines. Further analyses showed
that also dysregulation of drug transporters was improb-
able: unlike imatinib, nilotinib is neither imported via
hOCT-1, nor export ed via ABCB1 [5,18]. All five imati-
nib-resistant cell lines were nilotinib-res istant (Table 1).
Therefore, it appeared unlikely that imatinib-resistance
was caused by deregulated transport proteins. Finally,
the finding that both imatinib and nilotinib induced
dephosphorylation of s ignal transducer and activator of
transcription 5 (STAT5) in the TKI-resistant cell line
SUP-B15 as shown in Figure 2 further excludes resis-
tance being due to low intracellular drug levels. Both
drugs were transported into the cells which responded
by dephosphorylating STAT5 while retaining viability.
SRC kinases
SRC kinases had been described to play an important role
in BCR-ABL1 positive ALL (Figure 3) [9,19-21]. Interest-
ingly, 4/5 imatinib-resistant Ph+ cell lines were from
patients with pre-B ALL, T-ALL, or CML in B-cell blast
crisis (Table 1). Among lymphoid Ph+ cell lines 5/7 were
imatinib-resistant, including TOM-1, a pre-B cell line
classed “semiresistant” displaying normal IC50 values in
the thymidine uptake assay while remaining relatively
unresponsive to higher concentrations (Table 1). There-
fore, we applied dasatinib to elucidate whether activity of
SRC kinases was important for the growth of imatinib-
resistant cells. Dasatinib is a dual BCR-ABL1 and SRC
kinase inhibitor, as evidenced by its ability to inhibit
phosphorylation of SRC and ST AT5 in TKI-responsive
JURL-MK2 cells (Additional File 2). However, two of
three imatinib-resistant cell lines tested (NALM-1, SUP-
B15) were resistant to dasatinib in the proliferat ion assay
(Table 1). Furthermore, TKI-resistant SUP-B15 cells did
not express an active, phosphorylated SRC kinase and
dasatinib did not affect RSP6 phosphorylation in this cell
Quentmeier et al. Journal of Hematology & Oncology 2011, 4:6
/>Page 2 of 10
0
2000
4000
6000
8000
10000
12000
14000
0.0 0.014 0.04 0.12 0.37 1.1 3.3 10.0
JURL-MK2 (sensitive)
SUP-B15 (resistant)
A
3H-thymidine uptake (cpm)
imatinib (PM)
0
5000
10000
15000
20000
25000
30000
35000
40000
45000
1234
0 nM
100 nM
1000 nM
SUP-B15 (resistant)
3H-thymidine uptake (cpm)
time (d)
B
imatinib
JURL-MK2
(sensitive)
imatinib
SUP-B15
(resistant)
Propidium iodide
Annexin-V
control
70% 15% 4%
91%
14%
39%
30%
3%
9%
4%
29% 87%
C
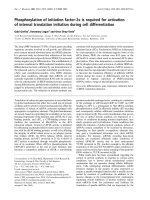
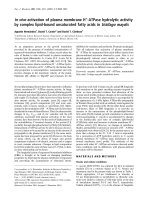
Figure 1 Imatinib-responsive and -resistant BCR-ABL1 positive cell lines.A)[
3
H]-thymidine incorporation after 24 h incubation with imatinib.
Results of cell line JURL-MK2 are representative for imatinib-sensitive, results of cell line SUP-B15 are representative for imatinib-resistant cell lines.
B) Time-course data confirm resistance of cell line SUP-B15 to imatinib (100 nM) for a period of four days. C) Apoptosis assessed by annexin-V/PI
staining. Imatinib (1 μM, 24 h) induced apoptosis in sensitive JURL-MK2 cells, but not in the imatinib-resistant cell line SUP-B15. Control: cells
cultivated for 24 h in medium without TKI.
Quentmeier et al. Journal of Hematology & Oncology 2011, 4:6
/>Page 3 of 10
line (Additional File 2). These results are not consistent
with the notion that SRC kinases are the cause of imati-
nib-resistance in these cell lines.
Imatinib induces dephosphorylation of ERK1/2 and of
STAT5 in TKI-resistant cell lines
BCR-ABL1 positive cells are characterized by stimulation
of the Janus kinase 2 (JAK2)/STAT5, extracellular-signal-
regulated-kinase (ERK) 1/2 and phosphoinositide-3-
kinase/v-Akt murine thymoma viral oncogene homolog
1/mammalian target of rapamycin (PI3K/AKT1/mTOR)
pathways (Figure 3) [21-23]. To determi ne the activity of
these signalling cascades, we assessed the phosphoryla-
tion status of STAT5, ERK1/2 and of the mTOR complex
1 (mTORC1) substrate ribosomal S6 protein (RPS6).
In TKI-sensitive cells, imatinib induced dephosphory-
lation of all three proteins (Figure 4). In TKI-resistant
cell lines, treatment with TKI reduced phosphorylation
of STAT5 (5/5 cell lines) and of ERK1/2 (4/5 cell lines)
but did not comparably affect phosphorylation of RPS6
(Figure 2 Figure 4). This observation allowed three con-
clusions: (i) cells that survive in the presence of imatinib
are not neces sarily completely unresponsive to the drug;
(ii) activation of ERK1/2 and the JAK/STAT5 pathway is
not obligatory for short-term proliferation of Ph+ posi-
tive cell lines; (iii) TKI-resistance is correlated with - if
not actually caused by - t he constitutive and imatinib-
resistant activity of the PI3K/AKT1/mTOR pathway.
BCR-ABL1-resistant cell lines show constitutive activation
of mTORC1
The PI3K/AKT1/mTOR/p70S6k inase (p70S6K) pathway
is a BCR-ABL1 downstream target and implicated in the
survival of leukemic cells (Figure 3) [23,24]. A major dif-
ference between TKI-sensitive and -resistant cell lines
was seen with respect to the phosphorylation level of
the p70S6K substrate RPS6: incubation with imatinib
inhibited RPS6 phosphorylation in TKI-responsive, but
Table 1 TKI-resistance of BCR-ABL1-positive cell lines
CML stage IC50 imatinib
(nM)
IC50 nilotinib
(nM)
IC50 dasatinib
(nM)
BCR-ABL1 mu/
wt
BCR-ABL1
breakpoint
Ikaros
Ik6
BCR-ABL1
mRNA
expression
level
BV-173 B BC 100 < 10 n.d. n.d. b2-a2 yes 1.6
CML-T1 T BC 200 20 n.d. n.d. b2-a2 no 0.5
EM-2 M BC 80 < 10 n.d. wt b3-a2 no n.d.
HNT-34 M BC 100 10 n.d. n.d. b3-a2 no n.d.
JK-1 M BC 100 10 n.d. n.d. b2-a2 no 1
JURL-MK1 M BC 200 < 10 < 1 n.d. b3-a2 no n.d.
JURL-MK2 M BC 50 < 10 < 1 n.d. b3-a2 no n.d.
K-562 M BC 200 20 n.d. n.d. b3-a2 no n.d.
KCL-22 M BC 800 40 1 wt b2-a2 no 1.7
KU-812 M BC 50 < 10 n.d. n.d. b3-a2 no n.d.
KYO-1 M BC 80 < 10 < 1 n.d. b2-a2 no 0.9
LAMA-84 M BC 100 < 10 < 1 n.d. b3-a2 no n.d.
MEG-01 M BC 200 < 10 < 1 n.d. b2-a2 no n.d.
MOLM-6 M BC 50 < 10 < 1 n.d. b2-a2 no n.d.
NALM-1 B BC > 10000 5000 > 1000 wt b2-a2 no 1
pre B-ALL
SD-1 B
lymph
> 10000 2000 n.d. wt e1-a2 no 0.1
SUP-B15 pre B 2000 500 100 wt e1-a2 yes 1.1
TOM-1 pre B 80 5 n.d. n.d. e1-a2 no 1
T-ALL
MHH-
TALL-1
T-ALL 1000 1000 n.d. wt e6-a2 no n.d.
IC50 values for TKI imatinib, nilotinib and dasatinib were determined by [
3
H]-thymidine uptake 24 h after onset of incubation with varying concentrations of the
individual inhibitors (bold: TKI-resistant cell lines). Note that imatinib-resistant cell line s were also resistant to second-gen eration inhibitors nilotinib and dasatinib.
The BCR-ABL1 kinase domain of TKI-resistant cell lines was sequenced and found to be wild-type (wt). Expression of Ikaros splice variant 6 (Ik6) was determined
by conventional PCR. BCR-ABL1 mRNA expression levels in cell lines with different breakpoints (b2-a2; e1-a2) were determined with quantitative real-time PCR.
BCR-ABL1 expression of cell line JK-1 was set to 1 for b2-a2 positive cell lines; for e1-a2 positive cell lines, TOM-1 was the reference cell line. B-cell BC: B blast
crisis; B lymph: B lymphoblastoid; T BC: T-cell blast crisis; M BC: myeloid blast crisis; mu: mutant; wt: wild-type; n.d.: not done.
Quentmeier et al. Journal of Hematology & Oncology 2011, 4:6
/>Page 4 of 10
not - or to a much lesser degree - in TKI-resistant cell
lines (Figure 2 Figure 4). p70S6K is an exclusive sub-
strate of mTOR comple x 1 (mTORC1). Rapamycin inhi-
bits this complex, but not mTORC2 [25]. Recent studies
suggest that targeting mTOR might become an efficient
anti-cancer therapy [25]. Rapamycin arrests Ph+ K-562
cells in the G1 phase of the cell cycle and induces apop-
tosis in primary CML cells [26]. Antil eukemic effects of
rapamycin in patients with TKI-resistant CML have
been shown [27]. These results prompted us to test
whether rapamycin inhibits constitutive RPS6 phosphor-
ylation, whether it reduces cell growth of TKI-resistant
CML cell lines and - most importantly - whether the
combination of rapamycin and imati nib induces apopto-
sis in imatinib-resistant cells.
Rapamycin effected dephosphorylation of RPS6 in imati-
nib-sensitive and imatinib-resistant cell lines (Figure 5).
Rapamycin alone did not induce apoptosis in imatinib-
resistant cell lines, a s evidenced by an ne xin-V staining (Fig-
ure 6A). However, in 6/6 cell lines, rapamycin (10 nM, for
24 h) reduced [
3
H]-thymidine uptake, which was paralleled
by an increase in the percentage of G1-phase cells (Table
2). For multiple myeloma, it has been shown that an anti-
proliferative drug, th e CDK4/6 inhibitor PD0332991 can
sensitize cells to a second agent, a cytotoxic drug (bortezo-
mib) [28]. Therefore, we speculated that rapamycin and
imatinib might cooperate in a similar way, rapamycin act-
ing as growth inhibitor and imatinib as cytotoxic agent.
The combination of rapamycin plus imatinib had the same
inhibitory effect on phosphorylation of RPS6 and of
STAT5 in TKI-resistant cells as imatinib alone had in TKI-
sensitive cells (Figure 5). However, the c ombination of ima-
tinib and ra pamycin did not l ead to a significan t increase of
apoptotic cells in imatinib-resistant cells, compared to the
effects of each drug alone (Figure 6A). Thus, inhibition of
mTORC1 was insuffic ient to restore responsive ness in
TKI-resistant cell lines.
AKT1, mediator of imatinib-induced apoptosis
As shown in this study, 2/3 BCR-ABL1 downstream sig-
nalling cascades - the JAK2/STAT5 and the ERK1/2
pathways - are druggable by TKI in imatinib-resistant
SUP-B15
(resistant)
GAPDH
pSTAT5
RPS6
STAT5
pRPS6
control
0.2
P
M imatinib
1.0
P
M imatinib
0.1
P
M nilotinib
0.02
P
M nilotinib
JURL-MK2
(sensitive)
control
0.2
P
Mimatinib
1.0
P
Mimatinib
0.1
P
M Nilotinib
0.02
P
M nilotinib
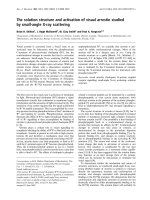
Figure 2 Effect of tyrosine-kinase inhibitors on phosphorylation
of STAT5 and RPS6 in TKI-sensitive and -resistant cell lines. Cell
lines JURL-MK2 and SUP-B15 were treated for 3 h with imatinib or
nilotinib. Phosphorylation of STAT5 and RPS6 was determined by
Western blot analysis using the appropriate antibodies. Note that
imatinib and nilotinib inhibited STAT5 phosphorylation (as shown by
loss of pSTAT5) in TKI-sensitive and -resistant cell lines. GAPDH was
used as loading control.
BCR-ABL1
CBL
GRB2
RAS PI3K
p85
AKT1
SRC
ERK1/2
STAT5
AKT1
mTOR
Survival
Survival
Proliferation
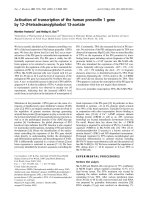
Figure 3 B CR-ABL1 signall ing cascades.BCR-ABL1induces
activation of JAK2/STAT5, RAS/RAF/ERK and PI3K/AKT1/mTOR
signalling pathways. SRC kinase family members may interact with
BCR-ABL1 leading to mutual activation. The scheme has been
adopted [11,18,19]. RPS6 is a downstream target of AKT1/mTOR/
p70S6K.
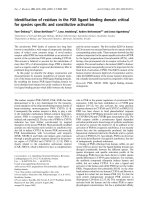
NALM-1
GAPDH
pSTAT5
S6
STAT5
pS6
KCL-22EM-2 SD-1 TOM-1
imatinib
- + - + - + - + - +
s r r r sr
pERK1/2
Figure 4 Phosphorylation levels of STAT5, ERK1/2 and RPS6 in
TKI-sensitive and -resistant cell lines. Cell lines were treated for 3
h with/without imatinib (200 nM). Phosphorylation of STAT5, ERK1/2
and RPS6 was determined by Western blot analysis. Note that
imatinib spares or only marginally induces dephosphorylation of
RPS6 in imatinib-resistant cell lines. ERK1/2 dephosphorylation is
seen in most imatinib-resistant cell lines. Abbreviations: s TKI-
sensitive; r TKI-resistant; sr semi-resistant.
Quentmeier et al. Journal of Hematology & Oncology 2011, 4:6
/>Page 5 of 10
cell lines (Figure 4). The PI3K/mTOR pathway was not
comparably inactivated by imatinib, as assessed by RPS6
phosphorylation (Figure 2 Figure 4). These results imply
that TKI-resistance is caused by constitutive TKI-unre-
sponsive activation of the PI3K/mTOR pathway. How-
ever, rapamycin - despite efficiently dephosphorylating
RPS6 - failed to i nduce apoptosis, whether alone or in
combination with imatinib (Figure 6A). Therefore, we
concluded that another member of the PI3K pathway,
upstream of mTOR might confer resistance, inhibiting
imatinib-triggered apoptosis. It has been shown in
another experimental setting that the inhibition of the
serine-threonine kinase AKT1 sensitizes tumor cells to
apoptotic stimuli [29]. AKT1 stimulates proliferation by
activation of mTORC1, and suppresses apoptosis by
phosphorylation of proapoptotic proteins like BCL2-
associated agonist of cell death (BAD) (Figure 3). We
inhibited AKT1 with Akt inhibitor IV, as evidenced by
dephosphorylation of RPS6 (Additional File 3). Inhibi-
tion of AKT1 triggered apoptosis in imatinib-sensitive
and -resistant cell lines (Figure 6B). These data suggest
that AKT1, rather than mTOR is the PI3K pathway
member that should be inhibited to trigger apoptosis in
TKI-resistant cells.
Role of PI3Ka in imatinib-resistance in Ph+ cell lines
remains elusive
In this study we show that imatinib-resistance of Ph+ cell
lines may be ascribed to the TKI-insensitiv e activation of
the PI3K/AKT1/mTOR pathway. Although other BCR-
ABL1-triggered signalling cascades (ERK1/2, JAK2/
STAT5) proved to be imatinib-responsive, inhibition of
these pathways did not affect the viability of cells. In con-
trast to imatinib, wortmannin (PI3K inhibitor), OSU-
03102 (PDK1 inhibitor) and rapamycin (mTOR inhibitor)
inhibited the PI3K/AKT1/mTOR pathway, suggesting
imatinib-resistant
GAPDH
pSTAT5
RPS6
STAT5
pRPS6
control
imatinib
imatinib-sensitive
control
imatinib
rapamycin
ima + rapa
rapamycin
ima + rapa
JURL-MK2
GAPDH
pSTAT5
RPS6
STAT5
pRPS6
EM-2
NALM-1
SUP-B15
Figure 5 Effect of imatinib and rapamycin on phosphorylation
of STAT5 and RPS6. Cell lines were treated for 24 h with imatinib
(1 μM), rapamycin (10 nM) or a combination of both agents.
Phosphorylation of STAT5 and RPS6 was determined by Western
blot analysis. Note that imatinib induces dephosphorylation of
STAT5 and of RPS6 in TKI-sensitive cell lines, dephosphorylation of
STAT5 in TKI-resistant cell lines. Rapamycin inhibits phosphorylation
of RPS6; ima = imatinib; rapa = rapamycin.
0
10
20
30
40
50
60
control imatinib rapamycin rapa + ima
EM-2 (sensitive)
SUP-B15 (resistant)
A
Annexin-V positive cells (%)
0
10
20
30
40
50
60
70
80
control imatinib Akt inh. IV Akt inh. IV +
ima
EM-2 (sensitive)
SUP-B15 (resistant)
B
Annexin-V positive cells (%)
Figure 6 Inhibition of AKT1, but not of mTORC1 induces
apoptosis in imatinib-resistant cell lines. Apoptosis was assessed
by Annexin-V staining. Experiments were performed in triplicates.
Cell lines were treated for 24 h with A) imatinib (1 μM), rapamycin
(10 nM), or a combination of both agents. Note that rapamycin did
not induce apoptosis and did not sensitize resistant cells to
imatinib. Additional experiments showed that preincubation with
rapamycin did not sensitize resistant cells, as well. B) Imatinib (1
μM), Akt inhibitor IV (1 μM), or both agents were applied for 24 h;
additional experiments showed that 1 μM Akt inhibitor IV induced
apoptosis also in cell lines BV-173 (imatinib-sensitive) and NALM-1
(imatinib-resistant).
Quentmeier et al. Journal of Hematology & Oncology 2011, 4:6
/>Page 6 of 10
that the TKI-resistance observed in the Ph+ cell lines
might be caused by a PI3K-activating oncogene other
than BCR-ABL1 itself (Additional File 4). To identify this
oncogene we looked for mutations and aberrant expres-
sion of genes known to mediate activation of PI3K, such
as RAS, CBL and p85 (Figure 3). In ad dition, PI3K itself
was a candidate for genetic alterations causing constitu-
tive activation of the PI3K/AKT1 pathway.
RAS mutations occur quite fre quentl y in he ma tolog ic
malignancies (5% K-RAS,12%N-RAS)[30].However,
none of the TKI-resistant cell lines showed mutations of
the most af fected regions of the genes (amino acids 12,
13 and 60 in K-RAS, amino acids 12, 13, and 61 in N-
RAS; data not shown), a finding which was scarcely
unexpected because RAS mutations would not only sti-
mulate PI3K, b ut also ERK1/2 in an imatinib-ins ensitive
manner (Figure 3). However, ERK1/2 was silenced by
imatinib in 4/5 cell lines (Figure 2 Figure 4).
The PI3K subunit p85b (PIK3R2)andtheCasitas
B-Cell lymphoma gene (CBL) belong to those seven
genes identified as core components for coordinating
the onco genic functions of BCR-ABL1 [21]. Phosphory-
lation of CBL recruits the p85 subunit of PI3K leading
to activation of PI3K/AKT1/mTOR pathway [31]. Quan-
titative RT-PCR did not reveal major differences in the
expression of CBL and p85 between imatinib-sensitive
and -resistant cell lines (data not shown). Besides, we
did not detect alterations in exons 7-9 of CBL, described
as transforming mutations in myeloid malignancies (data
not shown) [31,32].
Class I PI3Ks are heterodimer ic proteins consisting of
a catalytic and a regulatory adaptor subunit (e.g. p85b).
To find out which specific PI3K might be involved in
imatinib-resistant activation of AKT1/mTOR, we
applied inhibitors with differing specifi cities for the
various PI3K cata lytic subunits. [
3
H]-thymidine incor-
poration data suggested that PI3Ka (PIK3CA), but not
PI3K b or PI3Kg play a role in the imatinib-r esistance of
the cell lines tested (Figure 7). Mutations occurring in
the catalytic subunit PIK3CA result in constitutive acti-
vation and oncogenicity [33]. The majority of PIK3CA
mutations occur eith er in the helical (exon 10) or in the
kinase domain (exon 21) of the gene [34]. Thus, we
sequenced the respective regions of PIK3CA (database
number ENST000000263967) in all imatinib-resistant
cell lines. We did not find mutations in the kinase
domain, but cell line KCL-22 carried a heterozygous
point mutation in the helical domain, leading to the
amino acid change PI3Ka E545G (Figure 8). PI3K a
E545 mutations have been observed in clinical samples
of solid tumors and the E545A mutation has been
shown to constitutively activate the PI3K pathway [33].
These data suggest that also the PI3Ka E545G muta-
tion that we identified in cell line KCL-22 may be
responsible for the constitutive activity of the PI3K/
AKT1 pathway conferring TKI-resistance to the cells.
Deep sequencing might help to elucidate whether acti-
vating mutations in oncog enes other than BCR-ABL1 or
PIK3CA, or loss of tumor suppressor genes trigger the
PI3K in cell lines NALM-1, SD-1, SUP-B15 and MHH-
TALL1, thus causing TKI-resistance.
Conclusion
In this study a n unexpectedly high number (5/19, 26%)
of Ph+ ALL and CML cell lines tested imatinib-resistant.
The unresponsiveness of the cell lines was not attributa-
ble to known causes as BCR-ABL1 mutations or activa-
tion of SRC kinases. While the BCR-ABL1-triggered
Table 2 Effect of rapamycin on proliferation of BCR-ABL1-
positive cell lines
[
3
H]-thymidine (SI) % cells in G1
control rapamycin control rapamycin
TKI-sensitive
BV-173 1 0.3 +/- 0.1 63 +/- 4 69 +/- 4
EM-2 1 0.5 +/- 0.1 61 +/- 2 68 +/- 1
JURL-MK2 1 0.6 +/- 0.1 73 +/- 1 81 +/- 2
TKI-resistant
KCL-22 1 0.4 +/- 0 60 +/- 5 74 +/- 2
NALM-1 1 0.6 +/- 0.1 76 +/- 2 80 +/- 1
SUP-B15 1 0.5 +/- 0.1 66 +/- 1 83 +/- 2
Proliferation was assessed applying the [
3
H]-thymidine incorporation assay.
Stimulation index (SI) was determined setting uptake (cpm) of untreated cells
to 1. Shown are results of three experiments, each done in triplicate. Cell
cycle analysis was performed by flow cytometry with ethanol-fixed, PI stained
cells. Experiments were performed in triplicates. Both assays were performed
after 24 h with/without rapamycin (10 nM).
0
200
400
600
800
1000
1200
1400
1600
1800
2000
0 1 4 16 62 250 1000 4000
PI3K alpha Inh. VIII
PI3K beta Inh. VI
PI3K gamma Inh. VII
SUP-B15 (resistant)
(nM)
3H-thymidine uptake (cpm)
Figure 7 PI3Ka is important for cell growth of Ph+ cell lines.
[
3
H]-thymidine incorporation after 24 h incubation with inhibitors
for PI3Ka, PI3Kb and PI3Kg in cell line SUP-B15. Experiments with
cell lines NALM-1 (resistant) and BV-173 (sensitive) yielded similar
results, confirming the importance of PI3Ka for growth of Ph+ cell
lines.
Quentmeier et al. Journal of Hematology & Oncology 2011, 4:6
/>Page 7 of 10
JAK2/STAT5 and ERK1/2 pathways were inhibited by
imatinib, the resistant cell lines stand out by the consti-
tutive activation of the PI3K/AKT1/mTOR pathway.
The mTOR inhibitor rapamycin inhibited cell growth,
but did not induce apoptosis and did not sensitize resis-
tant cells to imatinib. Instead, inhibition of AKT1
induced apoptosis in TKI-resistant cell lines. Cell line
KCL-22 carries a heterozygous mutation in the helical
domain of PIK3CA, a site critical for activation of the
gene. These results suggest that activating mutations in
the PI3K itself or in PI3K-stimulating oncogenes might
be the molecular cause for TKI resistance.
Methods
Human cell lines
The cell lines applied in this study were taken from the
stock of the cell bank (DSMZ - Ge rman Collection of
Microorganisms and Cell Cultures) or were provided by
originators. Detailed references and cultivation protocols
have been described previously [35].
Inhibitors
Imatinib and nilotinib were generously provided by
Novartis (Basel, Swizerland). Ten mM stock solutions
were prepared in H
2
O (imatinib) or DMSO (nilotinib).
Dasatinib (100 mM in DMSO) was obtained from LC
Laboratories (Woburn, MA, USA). The SRC inhibitor
SU 6656 (40 mM in DMSO) was obtained from Cayman
Chemical (Ann Arbor, MI, USA). Rapamycin (100 μM
in DMSO) was purchased from Cell Signalling (New
England Biolabs, Frankfurt, Germany). Akt inhibitor IV,
Akt inhibitor VIII, PI3Ka inhibitor VIII, PI3Kb inhibitor
VI, PI3Kg inhibitor VII and Raf1 kinase inhibitor I (each
10 mM in DMSO) were purchased from Merck (Not-
tingham, GB). OSU-03012 (100 mM in DSMO) was
obtained from Tebu-bio (Offenbach, Germany). All
solutions were stored at -20°C.
[
3
H]-Thymidine uptake, cell cycle analysis and detection
of apoptotic cells
Assays of [
3
H]-thymidine incorporation were executed
as follows: 1.25 × 10
4
cells (in 100 μl) were seeded in
triplicate in 96-well flat-bottom microtiter plates. Inhibi-
tors were added as 2x concentrated solution in a 100 μl
volume. For the last 3 h of the incubation period, 1 μCi
[
3
H]-thymidine (Hartmann Analytic, Braunschweig, Ger-
many) was added to each w ell. Apoptotic cells were
detected and quantified with t he annexin-V/PI method
using the TACS Annexin-V-FITC kit (R&D Systems,
Wiesbaden, Germany) according to the manufacturer’s
instructions. Binding of fluorescein isothiocyanate-
labeled annexin-V and PI staining of the cells was deter-
mined by flow cytometry on the FACSCalibur (Becton
Dickinson, Heidelberg, Germany). For cell cycle analysis,
cells were fixed with 70% ethanol (-20°C, 20 min on
ice), washed with phosphat e-buffered saline, and stained
with PI (20 μg/ml). DNA content of the cells wa s deter-
mined by flow cytometry.
Sequencing of the BCR-ABL1 kinase domain, of CBL exons
7-9 and of PIK3CA exons 10 and 21
Exclusively to amplify the kinase domain of BCR-ABL1,
hemi-nested PCR was performed according to Hochhaus
et al. [36]. For cell lines carrying b2-a2 and b3-a2 BCR-
ABL1 fusion, the following primers were used in first-
round PCR: BCR exon 13 forward: 5’ -AC A GCA TTC
CGC TGA CCA TCA ATA AG-3’; ABL1 exon 7 reverse
(A7-): 5’-AGA CGT CGG ACT TGA TGG AGA ACT-
3’. For cell lines with e1-a2 and e6-a2 BCR-ABL1 trans-
location, the same AB L1 exon 7 reverse primer (A7-)
was combined with the BCR exon 1 forward primer: 5’-
CCC CCG GAG TTT TG A GGA TTG C-3’ [37]. First-
round PCRs were performed at 60 °C, respectively 59°C
for 35 cycles. The PCR products were diluted (1/10
6
)
and applied in a second-round PCR at 59°C for 25
cycles using reverse primer A7- and the ABL1 exon 4
forward primer: 5’ -TGG TTC ATC ATC A TT CAA
CGG TGG-3’. Purified PCR products were sequenced
using the second-round primers.
The following primers were used t o amplify and to
sequence CBL exons 7-9 from cDNA. CBL exon 6 for-
ward: 5’-TCC CTC ACA ATA AAC CTC TCT TCC-3’;
CBL exon 10 reverse primer: 5’-GCC ATG GAG AAT
GGA GAA GGC-3’ .RT-PCRwasperformedfor
PIK3CA wt/mu
KCL-22
Figure 8 PI3Ka E545G mutation i n cell line KCL-22. Genomic
sequencing and cDNA sequencing (shown here) showed that cell
line KCL-22 heterozygously carried PI3Ka E545G. No mutations were
found in the helical (exon 10) and kinase domains (exon 21) of the
remaining TKI-resistant cell lines.
Quentmeier et al. Journal of Hematology & Oncology 2011, 4:6
/>Page 8 of 10
32 cycles with an an nealing temperature of 56°C. Pri-
mers for genomic PIK3CA PCR were: PIK3CA intron 9/
10 forward: 5’-GAT TGG TTC TTT CCT GTC TCT
TG-3’; PIK3CA intron 10/11 reverse: 5’-CCA CAA ATA
TCA ATT TAC AAC CAT TG-3’; PIK3CA intron 20/
21 forward: 5 ’ -TGA CAT TTG AGC AAA GAC CTG;
PIK3CA exon 21 reverse: 5’-TGG ACT TAA GGC ATA
ACA TG-3’ . Primers for PI K3CA RT-PCR were:
PIK3CA exon 9 forward: 5’-TGG AGT TTG ACT GGT
TCA GC-3’ , PIK3CA exon 11 reverse: 5’ -GGG TAG
AAT TTC GGG GAT AG-3’ . PCR was performed at
55°C for 35 cycles.
Quantitative real-time PCR analysis
Quantitative PCR was performed on a 7500 Applied
Biosyst ems (Darmstadt, Germany) real-time PCR system
using the manufacturer’ s protocol. RNA was prepared
using the RNeasy Mini kit (Qi agen, Hilden, Germany).
For mRNA quantification, reverse transcription was per-
formed using the SuperScript II reverse transcriptase kit
(Invitrogen, Karlsruhe, Germany). Expression of BCR-
ABL1 e1-a2andb2-a2fusionmRNAs,ofCBL and of
p85b (PIK3R2) were assessed using the SYBR GREEN
PCR Master Mix (Applied Biosystems) with GAPDH as
internal control. BCR (e1) forward: 5’-GCA AGA CCG
GGC AGA TCT G-3’; BCR (b2) forward: 5’ -CAT TCC
GCT GAC CAT CAA TAA G-3’; ABL1 (a2) reverse: 5’-
AGA TGC TAC TGG CCG CTG A-3’; CBL forward: 5’-
ACCATAAGCCTCTTCAAGGAG-3’; CBL reverse:
5’ -AGA TGA GGG ACA GTT TGG TTA G-3’ ;
GAPDH forward: 5’ -TGG GTG TGA ACC ATG AGA
AG-3’; GAPDH reverse: 5’ -TCC ACG ATA CCA AAG
TTG TCA-3’; p85 forward: 5’ -CAG TCC TCC CCA
CCT GAT GT-3’; p85 reverse: 5’-GCG GTA GTG AGA
TTC GCT GT-3 ’. Relative expres sion levels were calcu-
lated using the ΔΔCt-method.
Expression analysis of Ikaros splice variant 6 (Ik6)
For detection of Ikaros splic e variant 6 (Ik6), we per-
formed PCR using the following primers: Ikaros exon 2
forward: 5’-ATG GAT GCT GAT GAG GGT CAA
GAC-3’ ; Ikaros exon 8 reverse: 5’-GAT GGC TTG GTC
CAT CAC GTG G -3’ . The PCR was performed with an
annealing temperature of 62°C. Splice variants were
detected by electrophoresis on a 1.2% agarose gel and
verified by sequencing of the PCR products.
Western blot analysis
Samples were prepared as described previously [38]. The
anti STAT5 monoclonal antibody (mAb) was purchased
from BD Transduction Laboratories (Heidelberg, Ger-
many). Anti pSTAT5, anti pRPS6 and anti pSrc (Tyr416)
antisera as well as the monoclonal antibody directed
against RPS6 were purchased from Cell Signalling (New
England Biolabs, Frankfurt, Germany). Anti FYN and anti
LYN antisera were obtained from Santa Cruz (Heidelberg,
Germany). The anti GAPDH mAb was purchased from
Abcam (Cambridge, UK). Specific bands on nitrocellulose
membranes were visualized with the biotin/streptavidin-
horseradish peroxidase system (Amersham, Freiburg,
Germany) in combination with the “Renaissance Western
Blot Chemoluminescence Reagent” protocol (Perkin
Elmer, Waltham, MA, USA).
Additional material
Additional file 1: Deletion of IKZF1 in cell line NALM-1. Quantitative
genomic PCR confirmed loss of the genes IKZF1 and DDC, located
between ELMO-1 and ADAM-22 at chromosome 7p12.2. The
cytogenetically-verified diploid B-lymphoblastoid cell line NC-NC was
used as reference, the repetitive element LINE1 was used as endogenous
control. Cell lines SD-1, SUP-B15 and MHH-TALL1 did not show loss of
IKZF1 according to quantitative PCR.
Additional file 2: Phosphorylation levels of SRC, STAT5 and RPS6 in
TKI-sensitive (JURL-MK2) and -resistant (SUP-B15) cell lines. Cell lines
were treated for 3 h with the BCR-ABL1 and SRC kinase inhibitor
dasatinib (20 nM) or with the SRC kinase inhibitor SU-6656 (2 μM) or
control. Phosphorylation of the SRC kinases Fyn and Lyn, of STAT5 and
RPS6 was determined by Western blot analysis.
Additional file 3: Phosphorylation levels of RPS6 in TKI-sensitive
and -resistant cell lines. Cell lines were treated for 3 h with imatinib (1
μM) and/or Akt inhibitor IV (1 μM). Phosphorylation of RPS6 was
determined by Western blot analysis. Note that RPS6 was
dephosphorylated with Akt inhibitor IV in both cell lines.
Additional file 4: Phosphorylation levels of STAT5, ERK1/2 and RPS6
in TKI- resistant cell line SUP-B15. Cell line SUP-B15 was treated for 3
h with/without imatinib (1 μM), Raf kinase inhibitor I (100 nM), OSU-
03012 (20 μM), wortmannin (1 μM) and rapamycin (10 nM).
Phosphorylation of STAT5, ERK1/2 and RPS6 was determined by Western
blot analysis. Note that RPS6 was dephosphorylated with all three
inhibitors of the PI3K/mTOR pathway.
Acknowledgements
We thank Dr. Roderick MacLeod (DSMZ) for critically reading the manuscript.
Authors’ contributions
HQ designed the study and wrote the manuscript, SE participated in data
analysis, JR performed Western blot analysis and [
3
H]-thymidine uptake
analysis, MZ performed quantitative real-time PCR analysis and flow-
cytometry, HGD provided cell lines and critically read the manuscript. All
authors read and approved the final manuscript.
Authors’ information
Leibniz-Institute DSMZ - German Collection of Microorganisms and Cell
Cultures, Braunschweig, Germany
Competing interests
The authors declare that they have no competing interests.
Received: 9 November 2010 Accepted: 7 February 2011
Published: 7 February 2011
References
1. Kantarjian H, Sawyers C, Hochhaus A, Guilhot F, Schiffer C, Gambacorti-
Passerini C, Niederwieser D, Resta D, Capdeville R, Zoellner U, Talpaz M,
Druker B: Hem atolog ic a nd cytogenetic responses to imatinib
mesylate in chronic myelogenous leukemia. NEnglJMed2002,
346:645-652.
Quentmeier et al. Journal of Hematology & Oncology 2011, 4:6
/>Page 9 of 10
2. Druker BJ, Sawyers CL, Kantarjian H, Resta DJ, Reese SF, Ford JM,
Capdeville R, Talpaz M: Activity of a specific inhibitor of the BCR-ABL
tyrosine kinase in the blast crisis of chronic myeloid leukemia and acute
lymphoblastic leukemia with the Philadelphia chromosome. N Engl J Med
2001, 344:1038-1042.
3. Gorre ME, Mohammed M, Ellwood K, Hsu N, Paquette R, Rao PN,
Sawyers CL: Clinical resistance to STI-571 cancer therapy caused by BCR-
ABL gene mutation or amplification. Science 2001, 293:876-880.
4. Roche-Lestienne C, Soenen-Cornu V, Grardel-Duflos N, Lai JL, Philippe N,
Facon T, Fenaux P, Preudhomme C: Several types of mutations of the Abl
gene can be found in chronic myeloid leukemia patients resistant to
STI571, and they can pre-exist to the onset of treatment. Blood 2002,
100:1014-1018.
5. Thomas J, Wang L, Clark RE, Pirmohamed M: Active transport of imatinib into
and out of cells: implications for drug resistance. Blood 2004, 104:3739-3745.
6. Mahon FX, Deininger MWN, Schultheis B, Chabrol J, Reiffers J, Goldman JM,
Melo JV: Selection and characterization of BCR-ABL positive cell lines
with differential sensitivity to the tyrosine kinase inhibitor STI571:
diverse mechanisms of resistance. Blood 2000, 96:1070-1079.
7. Weisberg E, Griffin JD: Mechanism of resistance to the ABL tyrosine
kinase inhibitor STI571 in BCR/ABL-transformed hematopoietic cell lines.
Blood 2000, 95:3498-3505.
8. le Coutre P, Tassi E, Varella-Garcia M, Barni R, Mologni L, Cabrita G,
Marchesi E, Supino R, Gambacorti-Passerini C: Induction of resistance to
the Abelson inhibitor STI571 in human leukemic cells through gene
amplification. Blood 2000, 95:1758-1766.
9. Hu Y, Liu Y, Pelletier S, Buchdunger E, Warmuth M, Fabbro D, Hallek M, van
Etten RA, Li S: Requirement of Src kinases Lyn, Hck and Fgr for BCR-
ABL1-induced B-lymphoblastic leukemia but not chronic myeloid
leukemia. Nature Genetics 2004, 36:453-461.
10. Mahon FX, Hayette S, Lagarde V, Belloc F, Turcq B, Nicolini F, Belanger C,
Manley PW, Leroy C, Etienne G, Roche S, Pasquet JM: Evidence that
resistance to nilotinib may be due to BCR-ABL, Pgp, or Src kinase
overexpression. Cancer Res 2008, 68:9809-9816.
11. Thomas EK, Cancelas JA, Zheng Y, Williams DA: Rac GTPases as key
regulators of p210-BCR-ABL-dependent leukemogenesis. Leukemia 2008,
22:894-904.
12. Deininger MWN, Goldman JM, Lydon N, Melo JV: The tyrosine kinase
inhibitor CGP57148B selectively inhibits the growth of BCR-ABL-positive
cells. Blood 1997, 90:3691-3698.
13. Breccia M, Alimena G: Nilotinib: a second-generation tyrosine kinase
inhibitor for chronic myeloid leukemia. Leukemia Res 2010, 34:129-132.
14. Dovat S, Payne KJ: Tumor suppression in T cell leukemia - the role of
Ikaros. Leukemia Res 2010, 34:416-417.
15. Mullighan CG, Miller CB, Radtke I, Phillips LA, Dalton J, Ma J, White D,
Hughes TP, Le Beau MM, Pui CH, Relling MV, Shurtleff SA, Downing JR:
BCR-ABL1 lymphoblastic leukaemia is characterized by the deletion of
Ikaros. Nature 2008, 453:110-114.
16. Iacobucci I, Storlazzi CT, Cilloni D, Lonetti A, Ottaviani E, Soverini S, Astolfi A,
Chiaretti S, Vitale A, Messa F, Impera L, Baldazzi C, D’Addabbo P,
Papayannidis C, Lonoce A, Colarossi S, Vignetti M, Piccaluga PP, Paolini S,
Russo D, Pane F, Saglio G, Baccarani M, Foà R, Marinelli G: Identification
and molecular characterization of recurrent genomic deletions on 7p12
in the IKZF1 gene in a large cohort of BCR-ABL1-positive acute
lymphoblastic leukemia patients: on behalf of Gruppo Italiano Malattie
Ematologiche dell’ Adulto Acute Leukemia Working Paty (GIMEMA AL
WP). Blood 2009, 114:2159-2167.
17. Iacobucci I, Lonetti A, Messa F, Cilloni D, Arruga F, Ottaviani E, Paolini S,
Papayannidis C, Piccaluga PP, Giannoulia P, Soverini S, Amabile M, Poerio A,
Saglio G, Pane F, Berton G, Baruzzi A, Vitale A, Charetti S, Perini G, Foa R,
Baccrani M, Martinelli G: Expression of spliced oncogenic Ikaros isoforms
in Philadelphia-positive acute lymphoblastic leukemia patients treated
with tyrosine kinase inhibitors: implications for a new mechanism of
resistance. Blood 2009, 112:3847-3855.
18. Davies A, Jordanides NE, Giannoudis A, Lucas CM, Hatziieremia S, Harris RJ,
Joergensen HG, Holyoake TL, Pirmohamed M, Clark RE, Mountford JC:
Nilotinib concentration in cell lines and primary CD34+ chronic myeloid
leukemia cells is not mediated by active uptake or efflux by major drug
transporters. Leukemia 2009, 23:1999-2006.
19. Deininger M: Src kinases in Ph+ lymphoblastic leukemia. Nature Genetics
2004, 36:440-441.
20. Li S: Src-family kinases in the development and therapy of Philadelphia
chromosome-positive chronic myeloid leukemia and acute
lymphoblastic leukemia. Leuk Lymphoma 2008, 49:19-26.
21. Kolch W, Pitt A: Functional proteomics to dissect tyrosine kinase
signalling pathways in cancer. Nat Rev Cancer 2010, 10:618-629.
22. Ilaria RL, Van Etten RA: P210 and P190
BCR/ABL
induce the tyrosine
phosphorylation and DNA binding activity of multiple specific STAT
family members. J Biol Chem 1996, 271:31704-31710.
23. Kharas MG, Fruman DA: ABL oncogenes and phosphoinositide 3-kinase:
mechanism of activation and downstream effectors. Cancer Res 2005,
65:2047-2053.
24. Burchert A, Wang Y, Cai D, von Bubnoff N, Paschka P, Müller-Brüsselbach S,
Ottmann OG, Duyster J, Hochhaus A, Neubauer A: Compensatory PI3-
kinase/Akt/mTor activation regulates imatinib resistance development.
Leukemia 2005, 19:1774-1782.
25. Guertin DA, Sabatini DM: An expanding role for mTOR in cancer. Trends
Mol Med 2005, 11:353-361.
26. Mayerhofer M, Aichberger KJ, Florian S, Krauth MT, Hauswirth AW, Derdak S,
Sperr WR, Esterbauer H, Wagner O, Marosi C, Pickl WF, Deininger M,
Weisberg E, Druker BJ, Griffin JD, Sillaber C, Valent P: Identification of
mTOR as a novel bifunctional target in chronic myeloid leukema:
dissection of growth-inhibitory and VEGF-suppressive effects of
rapamycin in leukemic cells. FASEB J 2005, 19:960-962.
27. Sillaber C, Mayerhofer M, Böhm A, Vales A, Gruze A, Aichberger KJ,
Esterbauer H, Pfeilstöcker M, Sperr WR, Pickl WF, Haas OA, Valent P:
Evaluation of antileukaemic effects of rapamycin in patients with imatinib
resistant chronic myeloid leukaemia. Eur J Clin Inv 2008, 38:43-52.
28. Menu E, Garcia J, Huang X, Di Liberto M, Toogood PL, Chen I,
Vanderkerken K, Chen-Kiang S: A novel therapeutic combination using PD
0332991 and bortezomib: study in the 5T33 MM myeloma model.
Cancer Res 2008, 68:5519-5523.
29. DeFeo-Jones D, Barnett SF, Fu S, Hancock PJ, Haskell KM, Leander KR,
McAvoy E, Robinson RG, Duggan ME, Lindsley CW, Zhao Z, Huber HE,
Jones RE: Tumor cell sensitization to apoptotic stimuli by selective
inhibition of specific Akt/PKB family members. Mol Cancer Ther 2005,
4:271-279.
30. Karnoub AE, Weinberg RA: Ras oncogenes: split personalities. Nature Rev
Mol Cell Biol 2008, 9:517-531.
31. Kales SC, Ryan PE, Nau MM, Lipkowitz S: Cbl and human myeloid
neoplasms: the Cbl oncogene comes of age. Cancer Res 2010,
70:4789-4794.
32. Reindl C, Quentmeier H, Petropoulos K, Greif PA, Benthaus T,
Argiropoulos B, Mellert G, Vempati S, Duyster J, Buske C, Bohlander SK,
Humphries KR, Hiddemann W, Spiekermann K: CBL exon 8/9 mutants
activate the FLT3 pathway and cluster in core binding factor/11q
deletion acute myeloid leukemia/myelodysplastic syndrome subtypes.
Clin Cancer Res 2009, 15:2238-2247.
33. Horn S, Bergholz U, Jücker M, McCubrey JA, Trümper L, Srocking C,
Bäsecke J: Mutations in the catalytic subunit of class IA PI3K confer
leukemogenic potential to hematopoietic cells. Oncogene 2008,
27:4096-4106.
34. Samuels Y, Wang Z, Bardelli A, Silliman N, Ptak J, Szabo S, Yan H, Gazdar A,
Powell SM, Riggins GJ, Willson JKV, Markowitz S, Kinzler KW, Vogelstein B,
Velculescu VE: High frequency of mutations of the PIK3CA gene in
human cancers. Science 2004, 304:554.
35. Drexler HG: Guide to Leukemia-Lymphoma Cell Lines. Braunschweig , 2 2010.
36. Hochhaus A, Kreil S, Corbin AS, La Rosée P, Müller MC, Lahaye T,
Hanfstein B, Schoch C, Cross NCP, Berger U, Gschaidmeier H, Druker BJ,
Hehlmann R: Molecular and chromosomal mechanisms of resistance to
imatinib (STI571) therapy. Leukemia 2002, 16:2190-2196.
37. Uphoff CC, Habig S, Fombonne S, Matsuo Y, Drexler HG: ABL-BCR
expression in BCR-ABL-positive human leukemia cell lines. Leukemia Res
1999, 23:1055-1060.
38. Quentmeier H, Schneider B, Röhrs S, Romani J, Zaborski M, MacLeod RAF,
Drexler HG: SET-NUP214 fusion in acute myeloid leukemia- and T-cell
acute lymphoblastic leukemia-derived cell lines. J Hematol Oncol 2009, 2:3.
doi:10.1186/1756-8722-4-6
Cite this article as: Quentmeier et al.: BCR-ABL1-independent PI3Kinase
activation causing imatinib-resistance. Journal of Hematology & Oncology
2011 4:6.
Quentmeier et al. Journal of Hematology & Oncology 2011, 4:6
/>Page 10 of 10