Báo cáo y học: " Relationships between foot type and dynamic rearfoot frontal plane motion" doc
Bạn đang xem bản rút gọn của tài liệu. Xem và tải ngay bản đầy đủ của tài liệu tại đây (661.71 KB, 6 trang )
JOURNAL OF FOOT
AND ANKLE RESEARCH
Chuter Journal of Foot and Ankle Research 2010, 3:9
/>Open Access
RESEARCH
© 2010 Chuter; licensee BioMed Central Ltd. This is an Open Access article distributed under the terms of the Creative Commons Attri-
bution License ( which permits unrestricted use, distribution, and reproduction in any
medium, provided the original work is properly cited.
Research
Relationships between foot type and dynamic
rearfoot frontal plane motion
Vivienne H Chuter
Abstract
Background: The Foot Posture Index (FPI) provides an easily applicable, validated method for quantifying static foot
posture. However there is limited evidence relating to the ability of the FPI to predict dynamic foot function. This study
aimed to assess the relationship between dynamic rearfoot motion and FPI scores in pronated and normal foot types.
Methods: 40 participants were recruited with equal numbers of pronated and normal foot types as classified by their
FPI score. Three dimensional rearfoot motion was collected for each of the participants. Dynamic maximum rearfoot
eversion was correlated with the total FPI score across all participants and within the normal and pronated foot types.
Linear correlations were performed between components of the total FPI scores measuring frontal plane rearfoot
position and maximum rearfoot eversion. The capacity of the total FPI score to predict maximum frontal plane motion
of the rearfoot was investigated using linear regression analysis.
Results: The correlation between the total FPI score and maximum rearfoot eversion was strongly positive (r = 0.92, p
< 0.05). Correlation performed on data subsets demonstrated the pronated foot type (FPI = +6 to +9) and maximum
rearfoot eversion angle were more strongly positively correlated (r = 0.81, p < 0.05) than the normal foot type (FPI = 0
to +5) and maximum rearfoot eversion (r = 0.76, p < 0.05). Correlations between frontal plane rearfoot FPI score and
frontal plane motion during gait were strongly positive, (r = 0.79 p < 0.05 pronated group, r = 0.71 p < 0.05 normal
group), however were less strong than the total FPI score and rearfoot motion. Linear regression analysis demonstrated
a significant and strong relationship between the total FPI score and maximum rearfoot eversion (r
2
= 0.85, p < 0.001).
Conclusions: The results of this study suggest the FPI has strong predictive ability for dynamic rearfoot function. This
will assist in clinical screening and research by allowing easy classification by functional foot type. Positive correlations
between frontal plane rearfoot measurements and maximum rearfoot eversion suggest the FPI may identify dominant
planar components of dynamic rearfoot motion and warrants further investigation.
Background
Foot posture has been implicated in biomechanical dys-
function of the lower limb and a variety of overuse inju-
ries [1-3]. Many static measures have been developed to
describe foot posture and subsequently investigated as
possible predictors of dynamic rearfoot motion [4,5].
Measures have included frontal plane calcaneal angle,
(frequently referred to as rearfoot angle), medial arch
angle and arch height, however, none has consistently
been found to be accurate predictors of dynamic rearfoot
motion for stance phase [4-8]. The clinical and research
benefits of having an easily performed static measure-
ment capable of predicting dynamic function are signifi-
cant, potentially assisting in improved accuracy of clinical
screening and orthotic prescription, and standardisation
of functional foot type for research.
The six item Foot Posture Index, (FPI), uses a validated
criterion-based observational measurement of the fore-
foot and rearfoot in a static position [9]. The reference
system differs from previously described classification
systems due to the number of observations recorded, the
inclusion of multi-segment and multiplanar measure-
ments evaluating foot position on a continuum relative to
pes planus or cavus position and the ease of application of
the model.
Measurement of the rearfoot includes a combination of
transverse and frontal plane assessments including talar
head palpation, curvature above and below the malleolus
* Correspondence:
1
Discipline of Podiatry, Faculty of Health, University of Newcastle, Ourimbah,
New South Wales, Australia
Full list of author information is available at the end of the article
Chuter Journal of Foot and Ankle Research 2010, 3:9
/>Page 2 of 6
and frontal plane position of the calcaneus. The forefoot
measurements combine transverse and sagittal plane
measurements including prominence of a talonavicular
bulge, forefoot transverse plane position and sagittal
plane congruence of the medial longitudinal arch. A score
is allocated to each measure to give a total overall score
indicative of foot posture with reference values provided
for classification purposes [9].
Previous research assessing the capacity of the FPI to
predict dynamic function has assessed three dimensional
inversion/eversion of the ankle joint complex during the
midstance of walking and midfoot motion measured via
video gait analysis and electromagnetic motion tracking.
Results so far have indicated a weak relationship between
the static FPI measurement and dynamic foot function
[9,10]. Electromagnetic tracking of the ankle joint com-
plex in a small group of participants demonstrated the
FPI predicted 41% of variance in ankle joint complex
inversion and eversion [9]. The study involved FPI being
manipulated through use of inverted or everted wedging
and the resulting ankle joint complex gait dymanics being
correlated to the contrived FPI during midstance. Whilst
this demonstrates relatively poor predictive capacity, it is
of greater strength than similar investigations of alterna-
tive static measures [5,11]. In relation to the midfoot, 45%
of variance in minimal navicular height and 13.2% vari-
ance in navicular drop were found to be predicted by the
FPI suggesting poor prediction of forefoot motion how-
ever, this is restricted to motion measured with two
dimensional techniques [10].
Due to the limited number of studies investigating the
use of the FPI as a predictor of dynamic function the
results are inconclusive. The purpose of this study was to
determine and compare the strength of correlation
between static foot position, as determined by the FPI,
and maximum dynamic three dimensional frontal plane
rearfoot eversion in both pronated and normal foot types.
Overall predictive ability of the total FPI score for
dynamic rearfoot motion was investigated.
Planar dominance of subtalar joint motion has been
linked to subtalar joint axis position, specifically the pitch
of the axis, with increased frontal plane motion of the
rearfoot thought to be associated with a lower pitched
axis [12]. The correlation between the score for the rear-
foot frontal plane components of the FPI measurement
and pure frontal plane motion of the calcaneus was calcu-
lated to determine the strength of relationship between
static frontal plane dominance at the subtalar joint and
dynamic frontal plane motion.
Methods
This project was undertaken in the Biomechanics
Department of the School of Exercise and Sports Science,
Faculty of Health Sciences, Cumberland Campus of the
University of Sydney. Ethical approval was obtained from
the University of Sydney's Ethics Committee. Informed
written consent was given by all participants prior to
their participation in this study.
Participants
Twenty male and 20 female participants were recruited
from the University of Sydney student population for par-
ticipation in this study, mean age 32.4 yrs (SD ± 4.7 yrs),
mean height 171 cm (SD ± 8.9 cm) and mean weight 69.5
kg (SD ± 4.1 kg). Only data for the right foot was
included. Participants were classified as either pronated
or normal according to reference values provided for the
FPI with a normal foot classified with a score of 0 to +5
and +6 to +9 indicative of a pronated foot type. Equal
numbers of males and females and pronated and normal
foot types were recruited into each group.
Procedure
FPI was determined for all participants recruited for this
study by an experienced clinician. Inclusion criteria for
the study required a pronated or neutral foot type as
determined by the total FPI score when applied by an
experienced clinician. Participants who had a negative
FPI score indicating a pes cavus foot type were excluded
from the study. Participants with history of major lower
limb or back trauma, surgery or any systemic disorder
affecting the musculoskeletal system were excluded from
the study.
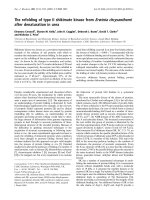
Three dimensional motion of an 11 point retro-reflec-
tive marker set attached to the subject's right limb was
collected using a Motion Analysis 9-video camera system
(Falcon 8 mm, Motion Analysis Corp., Santa Rosa, CA)
and a motion analysis system EvaRT 3.4 (Motion Analysis
Corp.). Markers were applied to the hallux, head of the
fifth metatarsal and navicular for the forefoot segment.
The rearfoot and shank consisted of medial, lateral and
posterior calcaneal markers and medial and lateral malle-
olar and upper, lower and lateral tibial makers (Figure 1).
Leg markers were 1 cm in diameter, foot markers ranged
from 0.5 cm-0.75 cm in diameter. The marker set was
used to create a rigid three-segment, three dimensional
lower limb model consisting of forefoot, rearfoot, and
shank [4]. The cameras were arranged around a central
15 m walkway, creating a capture volume approximately
2.5 m long, 1.5 m high and 1 m wide, varying slightly
according to the height and leg length of the subject.
Kinematic data were collected at 120 Hz.
Participants were required to perform barefoot walking
trials. A reference trial with the subject standing in the
anatomical position at natural angle and base of gait was
taken prior to the walking trials. The participants were
instructed to walk through the capture area. Walking tri-
als were collected at a speed of 1.4 m/s. Trials falling
Chuter Journal of Foot and Ankle Research 2010, 3:9
/>Page 3 of 6
more than 10% outside these velocities were excluded. A
minimum of five acceptable walking trials were per-
formed by each subject as this has been shown to provide
consistent kinematic data [13].
Kinematic data were low pass filtered at 6 Hz using a
zero phase second order Butterworth filter. Three dimen-
sional marker position coordinates were processed using
Kintrak 6.3, (The University of Calgary, Calgary, Canada)
to obtain joint angular displacement of the rearfoot rela-
tive to the shank. Trials were normalised to 120% of
stance (including 20% prior to heel strike) and kinematic
data were then processed using a MatLab program (The
Maths Works Inc., MA) to determine the discrete vari-
able (maximum eversion) to be entered into the statistical
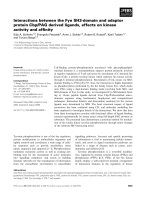
analysis. Figure 2 demonstrates a typical rearfoot frontal
plane motion time series output.
Statistical analysis
Ordinal FPI data were converted to Rasch transformed
scores allowing the data to be analysed as interval data
[14]. Linear correlations were performed to identify the
strength of relationship between maximum dynamic
rearfoot eversion and the total FPI score within the entire
population and within pronated and normal groups. A
possible relationship between evidence of frontal plane
dominance of the subtalar joint, and maximum rearfoot
eversion and was also examined [12]. Planar dominance
was determined via a breakdown of individual scores for
the FPI. Subject scores relating to inversion and eversion
of the calcaneus (associated with frontal plane motion)
and curvature above and below the lateral malleolus (rep-
resenting a combination of frontal and transverse plane
motion) were calculated and correlated with maximum
measurements for eversion giving possible scores of -4 to
+4 correlated against maximum angular eversion of the
rearfoot [9].
Correlation values above 0.8 were considered very
strong, between 0.6 and 0.8 strong and between 0.3 and
0.6 moderate. Correlation coefficient values below 0.3
were considered weak due to the relatively small sample
size [15].
Data were assessed for normality of distribution via
scatter plots and homogeneity of variance using Levene's
test to determine suitability for linear regression analysis.
Linear regression analysis was performed between the
total FPI and maximum rearfoot eversion to determine
predictive capacity of rearfoot motion for the total FPI
score. All statistical analysis was performed using SPSS
version 17 (SPSS Science, Chicago, Illinois) software.
Results
Descriptive statistics relating to maximum rearfoot ever-
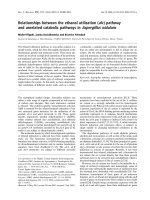
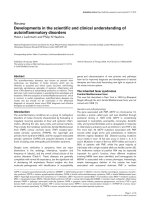
sion angle are shown in Table 1. The total FPI score was
correlated with maximum rearfoot eversion angle for the
entire subject population (Figure 3). Positive correlation
between the total FPI score and maximum eversion was
found to be very strong (r = 0.92, p < 0.05) indicating
close association between the total FPI score and maxi-
mum rearfoot eversion. Correlations between the FPI
score and maximum rearfoot eversion angle were per-
formed on data subsets representing a pronated foot
group (FPI = +6 to +9) and a normal foot group (FPI = 0
to +5). The relationship between the FPI score and maxi-
mum rearfoot angle was stronger in the pronated group
(r = 0.81, p < 0.05) than in the normal group (r = 0.76, p <
0.05).
Correlations between frontal plane rearfoot FPI score
and frontal plane motion during gait were strong and sta-
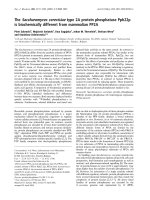
Figure 2 Walking gait frontal plane rearfoot motion mean (N = 1,
FPI Score +6) with 95% confidence intervals.
10
8
6
4
2
-2
-4
-6
10 20 30 40 50 60 70 80 90 100 110 120
% gait cycle
inversion eversion
Figure 1 Frontal and sagittal plane views of the marker set used
for the definition of segments.
Chuter Journal of Foot and Ankle Research 2010, 3:9
/>Page 4 of 6
tistically significant across all participants (r = 0.83, p <
0.05), however, less strong than the total FPI score and
rearfoot motion (r = 0.92), indicating the association
between frontal plane score and maximum eversion angle
is not as strong as the total FPI score and maximum rear-
foot eversion angle. This was consistent with correlations
of frontal plane rearfoot FPI score and frontal plane
motion during gait within the pronated and normal
groups which were strong (r = 0.79, p < 0.05, pronated
group, r = 0.71, p < 0.05 normal group), however, were
less strong than the relationship between the total FPI
and maximum reafoot eversion (0.81, p < 0.05 and 0.76, p
< 0.05 for the pronated and normal groups respectively).
Linear regression analysis demonstrated a significant
and strong relationship between the total FPI score and
maximum rearfoot eversion (r
2
= 0.85, p < 0.001) for the
entire subject cohort (n = 40). Therefore, the total FPI
score can be considered to be highly predictive of maxi-
mum rearfoot eversion angle across normal and pronated
foot types.
Discussion
Correlations of the total FPI score and maximum rearfoot
eversion angle for both the pronated and normal foot
types demonstrated a significant positive relationship (r =
0.81 and r = 0.76 respectively). Linear regression analysis
suggests strong predictive capacity of the FPI for frontal
plane motion of the rearfoot (r
2
= 0.85, p < 0.001) with the
FPI predicting 85% of the variation in maximum eversion
angle. This is in contrast to initial investigations of the
relationship between FPI and dynamic foot function
which demonstrate a weaker relationship between both
dynamic midfoot and ankle joint complex motion and
static FPI scores [9,10]. One previous study evaluated
ankle joint complex motion and the FPI score in manipu-
lated positions [9]. The method of measuring maximum
rearfoot eversion in unmodified gait and in a larger sam-
ple may explain the increased strength of relationship
found in this study. Furthermore, in this study FPI scores
were correlated with maximum rearfoot eversion when-
ever this occurred during stance phase allowing for an
inter-relationship between the midfoot and forefoot to be
included. This allowed for delayed or prolonged rearfoot
eversion, both recently identified as distinct patterns of
rearfoot motion [16] to be included in the statistical tests.
Investigation of the relationship between the FPI fron-
tal plane score of the rearfoot and maximum eversion
angle demonstrated a strong, statistically significant rela-
tionship between the two variables for both the pronated
foot type group and the normal foot type group. The
pronated group demonstrated the stronger correlation
with rearfoot motion, most likely due to greater range of
pronation providing measureable differences in the indi-
vidual planar components of rearfoot pronation. The
presence of a positive relationship in a relatively small
cohort suggests that further investigations are required,
particularly relating to a highly pronated foot type (FPI
10+) which is more likely to demonstrate significant dif-
ferences across the three planes of motion making up
subtalar pronation. Correct identification of dominant
planar components of rearfoot motion may potentially
assist with orthotic prescription, specifically in relation to
the position of the point of correction and the style of the
device, with frontal plane dominance suggesting
increased calcaneal motion control is required.
Modern three-dimensional motion analysis techniques
used for collection of rearfoot data from participants in
this study may also have contributed to findings of much
Table 1: Descriptive Statistics: maximum rearfoot eversion angle
N Minimum (°) Maximum(°) Mean (°) Std. Deviation (°)
Normal Group
FPI = 0 to +5
20 3 7 4.95 1.16
Pronated Group
FPI = +6 to +9
20 7 14 10.71 1.42
Figure 3 Scatterplot maximum rearfoot eversion versus total FPI
score, (r = 0.92, p < 0.05, n = 40).
16
14
12
10
8
6
4
2
0
0246810
foot posture index score
rearfoot eversion (
o
)
Chuter Journal of Foot and Ankle Research 2010, 3:9
/>Page 5 of 6
stronger predictive ability of the FPI than in results for
midfoot dynamic motion captured with Video Sequence
Analysis as published previously [10]. Similarly, isolation
of this study to the rearfoot ensured movement from
multiple joints in the midfoot were not included. The
ability of a static postural measurement to predict
dynamic midfoot function may be reduced as movement
occurs across multiple joints simultaneously with individ-
ual axes of motion. The midfoot FPI measurements also
concentrate on medially located structures, (talo-navicu-
lar congruence and medial arch height) however, during
gait movement occurs across the entire midfoot.
There are several limitations to this study that should
be considered. This study was restricted to normal and
pronated foot types as determined by FPI score. A supi-
nated foot type, classified by a score -5 to 0 on the FPI
scale, was not included. Due to the nature of the ordinal
scale used in the FPI, i.e. evenly distributed categories
and directional, it suggests that the predictive capacity of
the FPI may extend to a negatively scored supinated foot
type however this is currently an assumption.
In this study the investigation of the effect of planar
dominance, (identified by a breakdown of the FPI scores),
assumed the measurement of curvature above and below
the lateral malleolus to be a frontal plane measurement.
In reality, the FPI scoring system identifies this as a com-
bination of frontal and transverse plane position [9].
Therefore, this study potentially overestimates the
strength of the relationship between dynamic frontal
plane motion of the rearfoot and frontal plane dominance
in the FPI score.
Analysis was restricted to the frontal plane due to fron-
tal plane motion of the rearfoot being adequately demon-
strated by calcaneal motion allowing comparison
between static measurements and dynamic function.
Components of the FPI related to the static transverse
plane position (assessed by palpation of the talar head)
were not compared to dynamic motion as talar head
motion cannot be accurately or reliably measured by skin
mounted markers. There is no component of sagittal
plane position included in the rearfoot FPI scoring sys-
tem therefore this could not be included.
Conclusions
The FPI is a validated, quick and simple clinical measure-
ment which can be easily applied. The findings of this
study suggest that it may be an important and convenient
screening tool in evaluation of foot function and subse-
quent predisposition to injury.
Historically, research into the effect of foot orthoses
and footwear on dynamic foot function has been ham-
pered by difficulty in reliably classifying foot type for
inclusion in studies, possibly contributing to subject-spe-
cific findings and lack of homogenous response to spe-
cific orthotic styles [17,18]. The results of this study
suggest that the FPI has a strong positive relationship
with maximum eversion of the rearfoot and is capable of
predicting 85% of the variance in maximum eversion dur-
ing the stance phase of gait. This suggests the FPI has sig-
nificant predictive ability for dynamic rearfoot function
which may assist in clinical screening and in the future
research of the effect of orthotic prescription on foot
function in specific cohorts.
Positive correlations between frontal plane rearfoot
measurements and maximum rearfoot eversion suggests
the FPI may also have a role in identifying dominant pla-
nar components of dynamic rearfoot motion and war-
rants further investigation.
Competing interests
The author declares that they have no competing interests.
Acknowledgements
The author would like to acknowledge the contributions of Associate Professor
Richard Smith and Mr Ray Patton (University of Sydney) for assistance with lab-
oratory requirements.
Author Details
Discipline of Podiatry, Faculty of Health, University of Newcastle, Ourimbah,
New South Wales, Australia
References
1. Kaufman K, Brodine S, Shaffer R, Johnson C, Cullison T: The effect of foot
structure and range of motion on musculoskeletal overuse injuries.
Am J Sports Med 1999, 27:585-593.
2. Murphy D, Connolly D, Beynnon B: Risk factors for lower extremity
injury: a review of the literature. Br J Sports Med 2003, 37(1):13-29.
3. Williams Iii, McClay IS, Hamill J: Arch structure and injury patterns in
runners. Clin Biomech 2001, 16(4):341-347.
4. Hunt AE, Fahey AJ, Smith RM: Static measures of calcaneal deviation and
arch angle as predictors of rearfoot motion during walking. Aust J
Physiother 2000, 46(1):9-16.
5. McPoil TG, Cornwall MW: The relationship between static lower
extremity measurements and rearfoot motion during walking. J
Orthop Sports Phys Ther 1996, 24(5):309-314.
6. Hamill J, Bates BT, Knutzen KM, Kirkpatrick GM: Relationship between
selected static and dynamic lower extremity measures. Clin Biomech
1989, 4:217-225.
7. McPoil TG, Cornwall MW: Relationship between three static angles of
the rearfoot and the pattern of rearfoot motion during walking. J
Orthop Sports Phys Ther 1996, 23(6):370-375.
8. Nakhaee Z, Rahimi A, Abaee M, Rezasoltani A, Kalantari KK: The
relationship between the height of the medial longitudinal arch (MLA)
and the ankle and knee injuries in professional runners. The Foot 2008,
18(2):84-90.
9. Redmond AC, Crosbie J, Ouvrier RA: Development and validation of a
novel rating system for scoring standing foot posture: The Foot
Posture Index. Clin Biomech 2006, 21(1):89-98.
10. Nielsen RG, Rathleff M, Kersting UG, Simonsen O, Moelgaard C, Jensen K,
Olesen CG, Lundbye-Christensen S, Kaalund S: The predictive value of
the foot posture index on dynamic function. J Foot Ankle Res 2008,
1(Suppl 1):O37.
11. Cavanagh PR, Rodgers MM: The arch index: A useful measure from
footprints. J Biomech 1987, 20(5):547-551.
12. Payne C, Chuter V: The clash between theory and science on the
kinematic effectiveness of foot orthoses. Clin Pod Med Surg 2001,
18(4):705-13.
Received: 16 October 2009 Accepted: 16 June 2010
Published: 16 June 2010
This article is available from: 2010 Chuter; licensee BioMed Central Ltd. This is an Open Access article distributed under the terms of the Creative Commons Attribution License ( which permits unrestricted use, distribution, and reproduction in any medium, provided the original work is properly cited.Journal of Foot and Ankle Research 2010, 3:9
Chuter Journal of Foot and Ankle Research 2010, 3:9
/>Page 6 of 6
13. Diss CE: The reliability of kinetic and kinematic variables used to
analyse normal running gait. Gait Posture 2001, 14(2):98-103.
14. Keenan AM, Redmond AC, Horton M, Conaghan PG, Tennant A: The foot
posture index: rasch analysis of a novel, foot-specific outcome
measure. Arch Phys Med Rehab 2007, 88(1):88-93.
15. Minichiello V, Sullivan G, Greenwood K, Axford R, eds: Handbook of
Reasearch Methods in Health Sciences Addison Wesley Longman Australia
Pty Limited: Sydney; 1999.
16. Cornwall MW, McPoil TG: Classification of frontal plane rearfoot motion
patterns during the stance phase of walking. J Am Podiatr Med Assoc
2009, 99(5):399-405.
17. Dorsey W, McClay Davis I, Baitch SP: Effect of inverted orthoses on lower
extremity mechanics in runners. Med Sci Sport Exerc 2003,
35(12):2060-2068.
18. Stacoff A, Reinschmidt C, Nigg BM, van den Bogert AJ, Lundberg A,
Denoth J, Stüssi E: Effects of foot orthoses on skeletal motion during
running. Clin Biomech 2000, 15(1):54-64.
doi: 10.1186/1757-1146-3-9
Cite this article as: Chuter, Relationships between foot type and dynamic
rearfoot frontal plane motion Journal of Foot and Ankle Research 2010, 3:9