báo cáo khoa học: "Mitochondrial and endoplasmic reticulum stress pathways cooperate in zearalenone-induced apoptosis of human leukemic cells" doc
Bạn đang xem bản rút gọn của tài liệu. Xem và tải ngay bản đầy đủ của tài liệu tại đây (3.08 MB, 16 trang )
RESEARC H Open Access
Mitochondrial and endoplasmic reticulum stress
pathways cooperate in zearalenone-induced
apoptosis of human leukemic cells
Ratana Banjerdpongchai
1*
, Prachya Kongtawelert
1
, Orawan Khantamat
1
, Chantragan Srisomsap
2
,
Daranee Chokchaichamnankit
2
, Pantipa Subhasitanont
2
, Jisnuson Svasti
2,3
Abstract
Background: Zearalenone (ZEA) is a phytoestrogen from Fusarium species. The aims of the study was to identify
mode of human leukemic cell death induced by ZEA and the mechanisms involved.
Methods: Cell cytotoxicity of ZEA on human leukemic HL-60, U937 and peripheral blood mononuclear cells (PBMCs)
was performed by using 3-(4,5-dimethyl)-2,5-diphenyl tetrazolium bromide (MTT) assay. Reactive oxygen species
production, cell cycle analysis and mitochondrial transmembrane potential reduction was determined by employing
2’,7’-dichlorofluorescein diacetate, propidium iodide and 3,3’-dihexyloxacarbocyanine iodide and flow cytometry,
respectively. Caspase-3 and -8 activities were detected by using fluorogenic Asp-Glu-Val-Asp-7-amino-4-
methylcoumarin (DEVD-AMC) and Ile-Glu-Thr-Asp-7-amino-4-methylcoumarin (IETD-AMC) substrates, respectively.
Protein expression of cytochrome c, Bax, Bcl-2 and Bcl-xL was performed by Western blot. The expression of proteins
was assessed by two-dimensional polyacrylamide gel-electrophoresis (PAGE) coupled with LC-MS2 analysis and real-
time reverse transcription polymerase chain reaction (RT-PCR) approach.
Results: ZEA was cytotoxic to U937 > HL-60 > PBMCs and caused subdiploid peaks and G1 arrest in both cell
lines. Apoptosis of human leukemic HL-60 and U937 cell apoptosis induced by ZEA was via an activation of
mitochondrial release of cytochrome c through mitochondrial transmembrane potential reduction, activation of
caspase-3 and -8, production of reactive oxygen speci es and induction of endoplasmic reticulum stress. Bax was up
regulated in a time-dependent manner and there was down regulation of Bcl-xL expression. Two-dimensional
PAGE cou pled with LC-MS2 analysis showed that ZEA treatment of HL-60 cells produced differences in the levels
of 22 membrane proteins such as apoptosis inducing factor and the ER stress proteins including endoplasmic
reticulum protein 29 (ERp29), 78 kDa glucose-regulated protein, heat shock protein 90 and calreticulin, whereas
only ERp29 mRNA transcript increased.
Conclusion: ZEA induced human leukemic cell apoptosis via endoplasmic stress and mitochondrial pathway.
Introduction
The phytoestrogen zearalenone (ZEA) is one of the
most active naturally occurring estrogenic compounds
[1,2]. Food, snacks, dried fruits, dried vegetables and
beverages such as beer, often contain ZEA [3-5]. The
average daily intake of ZEA in adults ranges from 0.8-29
ng/kg body weight (b.w.)/day, while small children have
a higher average daily intake, 6-55 ng/kg b.w./day [6].
Treatment with Zea (10-40 μM) of Vero, Caco-2 and
DOK cells results in apoptosis as evidenced by DNA
ladder formation and presence of apoptotic bodies [7].
Recently, ZEA has been shown to induce apoptosis in
human hepatocytes (HepG2) via p53-dependent mito-
chondrial signaling pathway with the up regulation of
ATM and GADD45 involved in DNA repair [8].
In mammalian cells, there are two major pathways
involved in apoptosis: mitochondria-initiated intrinsic
* Correspondence:
1
Department of Biochemistry, Faculty of Medicine, Chiang Mai University,
Chiang Mai 50200, Thailand
Full list of author information is available at the end of the article
Banjerdpongchai et al. Journal of Hematology & Oncology 2010, 3:50
/>JOURNAL OF HEMATOLOGY
& ONCOLOGY
© 2010 Banj erdpon gchai et al; lic ensee BioMed Central Ltd. This is an Open Acces s article distributed under the ter ms of t he Creative
Commons Attribution License ( icenses/by/2.0), which permits unrestricted use, distribution, and
reproduction in any medium, provided the origina l work is properly cited.
pathway and death receptor-stimulated extrinsic path-
way [9-11]. In the former pathway, proapoptotic signals
provoke release from mitochondrial inter-membranous
space into cytosol of cytochrome c, which forms a com-
plex with Apaf-1 and dATP, known as apoptosome, and
triggers caspase-9 activation. Activation of caspase-9
leads to subsequent activation of executioner caspases,
such as caspase-3, -6, -7, which in turn stimulates a ser-
ies of apoptotic events, eventually leading to cell death
[9,12,13]. The extrinsic pathway begins with binding of
Fas ligand to Fas death receptor, and a n adaptor mole-
cule is recruited to the receptor, which allows binding
and proteolytic activa tion of c aspase-8. Activated cas-
pase-8 then cleaves effector caspase-3, -6 and -7, leading
to apoptotic cell death [10,12,14].
In addition to the ab ove mentioned pathways, apopto-
sis can be induced via endoplasmic reticulum (ER),
which normally regulates protein synthesis and intracel-
lular calcium (Ca
2+
) homeostasi s [15]. Excessive ER
stress triggers apoptosis through a variety of mechan-
isms including redox imbalance, alteration in Ca
2+
level
and activation of Bcl-2 family proteins [16].
Calreticulin (CRT) is an abundant Ca
2+
-binding cha-
perone, which is mostly present in ER lumen, although
it can also be found in other subcellular localizations
[17,18]. When present on the surface of damaged cel ls,
it can serve as an ‘eat-me’ signal and hence facilitates
the recognition and later engulfment of dying cells by
macrophages [19] or by dendritic cells [20]. It is thought
that this function determines the immunostimulatory
effect of CRT, as presentation of tumor antigens by den-
dritic cells is required for the immunogenic effect of
anthracyclin-treated cancer cells [20-22]. Alternatively,
CRT may bind tumor antigenic peptides and facilitate
their efficient presentation t o T cells [23]. Crosstalk
with the two well-characterized apopto tic pathwa ys also
exists, since ER stress can also activate caspase-8 and
caspase-9 [24,25].
The ability of ZEA to modulate leukemic cell growth
has not yet been well cha racterized. Using two human
leukemic HL-60 and U937 cell lines we found that
human leukemic cell apoptosis induced by ZEA was
related to caspase-3 and -8 activation, mitochondrial
transmembrane potential (MTP) reduction and cyto-
chrome c release. ZEA also induced oxidative stress via
ROS generation, Bax upregulation and Bcl-xL downre-
gulation. The mechanistic effect also involved increased
Ca
2+
concentration in cytosol and mitochondria indicat-
ing ER stress but there was no calreticulin exposure on
the cell surface at 30 min. Two-dimensional gel-electro-
phoresis of proteins following 24 h treatment revealed
upregulated expression of ER-mediated chaperone endo-
plasmic reticulum protein 29 (ERp29), 78 kDa glucose
regulated protein (GRP78), and calreticulin supporting
the involvement of ER stress.
Materials and methods
Chemicals and test media
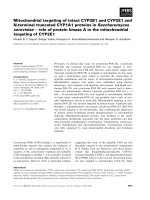
ZEA (Figure 1), lymphoprep, MTT (3-( 4,5-dimethyl)-2,5-
diphenyl tetrazolium bromide, propidium iodide (PI),
3,3’ -dihexyloxacarbocyanine iodide (DiOC
6
), 2’ ,7’ -
dichlorofluorescein diacetate (DCFH-DA), ProteoExtract
Albumin/Removal kit, and ProteoPrep Universal Protein
ExtractionkitwereobtainedfromSigma-Aldrich
(St. Louis, MO, USA). RPMI-1640 medium, SYBR
GREENER qPCR UNIVERSAL and primers sequences
were ob tained from Invitrogen, USA. DEVD-AMC (Asp-
Glu-Val-Asp-7-amino-4-methylcoumarin) and IETD-
AMC (Ile-Glu-Thr-Asp-amino-4-methylcoumarin) were
obtained from Biosource, USA. IPG gel strips were pur-
chased from GE He althcare, Uppsala, Sw eden. Trypsin
wasobtainedfromPromegaMadison,WI,USA.Mouse
monoclonal antibodies to cytochrome c, Bax and Bcl-2
and rabbit polyclonal antibody to Bcl-xL, and horseradish
peroxidase (HRP) conjugated secondary antibodies were
purchased from Abcam, Cambridge, UK. SuperSignal
West Pico Chemiluminecent Substrate was obtained
from Pierce, Rockford, IL, USA. Complete mini protease
inhibitor cocktail was obtained from Roche, Basel,
Switzerland. Fluo3-AM and Rhod2-AM were obtained
from Molecular Probes, Eugene, OR, USA. RNA extrac-
tion kit was obtained from Pharmacia Bioscience,
Uppsala, Sweden. RevertAid™ First Strand cDNA Synth-
esis kit was obtained from MBI Fermentas, Germany.
Cell culture
Human promye locytic leukemic HL-60 and human pro-
monocytic U937 cells were gifts from Dr. Sukhathida
Ubol and Dr. Watchara Kasinroek. The cells were cul-
tured in 10% fetal bovine serum in RPMI-16 40 medium
supplemented wi th penicillin G (100 units/ ml) and
Figure 1 Structure of z earalenone (ZEA; 6-[10-h ydroxy-oxo-
trans-1-undecenyl]-B-resorcyclic acid lactone).
Banjerdpongchai et al. Journal of Hematology & Oncology 2010, 3:50
/>Page 2 of 16
streptomycin (100 μg/ml) at 37°C in a humidified atmo-
sphere containing 5% CO
2
. The human leukemic cells
(1 × 10
6
) were treated with ZEA at indicated concentra-
tion and duration. ZEA was dissolved in DMSO as a
vehicle and th e maximal volume used was not exceeded
10 μl/ml of media.
The blood was obtained from adult volunteers with
IRB approval. Peripheral blood mononuclear cells
(PBMCs) were isolated from heparinized blood by d en-
sity gradient centrifugation using lymphopr ep according
to standard protocols. Cells were cultured in RPMI-
1640 medium supplemented with 10% heat-inactivated
fetal bovine serum, 2 mM glutamine, 100 U/ml penicil-
lin and 100 μg/ml streptomycin. PBMCs (3 × 10
6
)were
treated with ZEA at indicated concentration and
duration.
Cytotoxicity test
Following ZEA treatment, cell viability was assessed by
MTT (3-(4,5-dimethyl)-2,5-diphenyl tetrazolium bromide)
assay [26]. This method is based o n the ability of viable
cells to reduce MTT and form a blue formazan product.
MTT solution (sterile stock solution of 5 mg/ml) was
added to cell suspension a t a final concentration of
100 μg/ml and the solution incubated for 4 h at 37°C in a
humidified 5% CO
2
atmosphere. The medium was then
removed and cells were treated with DMSO for 30 min.
The optical density of the cell lysate was measured at
540 nm with reference wavelength of 630 nm using micro-
titer plate reader (Biotek, USA). Number of viable cells
was c alculated from untreated cells, and the da ta we re
expressed as percent cell viability.
Determination of mitochondrial transmembrane potential
and ROS production
For measurement of mitochondrial membrane potential
and intracellular ROS, either 40 nM 3,3’-dihexyloxacar-
bocyanine iodide (for mitochondrial transmembrane
potential determination) or 5 μM2’,7’ -dichlorofluores-
cein diacetate (for ROS detection) were added for
15 min at 37°C and the cells are then subjected to flow
cytometry.
For flow cyt omet ric assessment of DNA fragmentation
and cell cycle distribution, 1 × 10
6
cells were harvested
and re-suspended in a solution containing PI (50 μg/ml),
0.1% Triton X-100 and 0.1% sodium citrate in PBS. Ce lls
then were analyzed in a FACScan equipped with a
488 nm argon laser using CellQuest software (Becton-
Dickinson, USA). Data were depicted as histograms and
the percentage of cells di splaying hypodiploid DNA con-
tent was indicated. Percentage of cells in each phase was
also evaluated to determine the existence of cell cycle
arrest.
Assay of caspase-3 and caspase-8 activity
Cleavage of the fluorogenic peptide substrates DEVD-
AMC and IETD-AMC, indicative of caspase-3-like and
caspase-8-like enzyme activity, was estimated. Cell lysates
(1 × 10
6
cells) and substrate (50 μM) were combined in a
standard reaction buffer and added to a 96-well plate.
Enzyme-catalyzed release of AMC was measured by a
fluorescence plate reader (Bio-tek, USA) using 355 nm
excitation and 460 nm emission wavelengths.
Two-dimensional polyacrylamide gel-electrophoresis
(2-D PAGE)
U937 cells, treated and untreated with 20 μM ZEA for 4
and 24 h were harvested and washed twice and the cell
precipitates were used further. Albumin was first
removed using ProteoExtract Albumin/Removal kit. The
amount of protein loaded in 2-D PA GE was 200 μg/gel.
2-D PAGE w as performed using the immobiline/polya-
crylamide system. Samples were applied by overnight in-
gel rehydration of 70 mm nonlinear pH 3-10 IPG gel
strips. The first dimension (IEF) was performed at 6500
Vh for 3.5 h, using a Pharmacia LKB Multiphor II sys-
tem. IPG strips were equilibrated with buffer in two
steps. The first step employed 50 mM Tris-HCl buffer,
pH 6.8, 6 M urea, 30% glycerol, 1% SDS, and 1% DTT,
while 2.5% iodoacetamide replaced D TT in the second
step. Then IPG strips were applied to the second-
dimension 12.5% T SDS polyacrylamide gels (100 mm ×
105 mm × 1.5 mm). Electrophores is was performed in a
Hoefer system at 20 mA for 2.5 h at room t emperature.
After electrophoresis, proteins were visualized by CBR-
250 staining.
PAGE of plasma membrane proteins
ProteoPrep Universal Protein Extraction kit was u sed to
isolate membrane and cytosolic proteins from HL-60
cell line. The cytoplasmic extraction reagent was added
to the cell pellet and the sample was sonicated at 4°C
and centrifuged at 14,000 × g for 45 min. The superna-
tant was collected. The same reagent was added to the
remaining pellet, foll owed by sonication and centrifuga-
tion, and the resulting supernatant was pooled with t hat
obtained earlier. The pooled supernatant was dried
using Speed Vac. The dried sample was resuspended in
the soluble protein resuspension reagent (Sup1).
The precipi tate was resuspended in cellular and orga-
nellemembranesolubilizingreagent.Thesamplewas
centrifuged at 14,000 × g for 45 min at 15°C. The super-
natant was collected as Sup2. Sup1 a nd 2 were treated
with 5 mM tributylphosphine (TBP) (reduction) for 1 h
at room temperature, then 15 mM iodoacetamide (alky-
lation) was ad ded and the reaction mixture was incu-
bated for 1.5 h. The reaction was stopped by adding
Banjerdpongchai et al. Journal of Hematology & Oncology 2010, 3:50
/>Page 3 of 16
TBP and incubated for 15 min. The sample was centri-
fuged at 20,000 × g for 5 min at room temperature and
the clear supernatant was collected. The concentrations
of proteins in Sup1 and Sup2 were measured using the
Bradford method. Samples were prepared for 2-D PAGE
by adding ampholine and solubilizing reagent to adjust
the volume.
2-D PAGE was performed using the immobiline/poly-
acrylamide system. Samples were applied by overnight
in-gel rehydration of 70 mm nonlinear pH 3-10 IPG gel
strips. The first dimension electrophoresis (IEF) was
performed as described for U937 cells.
Tryptic in-gel digestion of protein spots
Differential expression of proteomic profiles in treated
and untreated cell lines were compared. Spots of interest
were excised and transferred to 1.5 ml tubes. A 50 μl
aliquot of 0.1 M NH
4
HCO
3
in 50% acetonitrile was
added, and the gel was incubated for 20 min at 30° C.
The solvent was discarded and the gel particles were
dried completely. Reduction and alkylation was per-
formed by swelling the gel pieces in 50 μl buffer solu-
tion (0.1 M NH
4
HCO
3
,10mMDTT,and1mM
EDTA) and incubating at 60°C for 45 min. Then the
excess liquid was removed and quickly replaced by the
same volume of freshly prepared 100 mM iodoaceta-
mide in 0.1 M NH
4
HCO
3
solution. The gel suspension
was incubated at room temperature in the dark for
30 min and iodoacetamide solution removed. Each gel
piece was washed with 50% acetonitrile in wate r 3 times
for 10 min, and completely dried. A 50 μl aliquot of
digestion buffer (0.05 M Tris HCl, 10% acetonitrile,
1mMCaCl
2
,pH8.5)and1μl aliquot of trypsin (1 mg
trypsinin10μl 1% acetic acid) were added to the gel
pieces. The mixtures were incubated at 37°C overnight.
The digestion buffer was removed and saved. The gel
pieces were then extracted by adding 60 μl of 2% freshly
prepared trifluoroa cetic acid and incubating for 30 min
at 60°C. The extract and saved digestion buffer were
pooled and dried. Digested peptides were dissolved in
6 μl of 0.1% formic acid for MS/MS injection.
Protein identification by LC-MS/MS
LC-MS/MS analyses were carried out using a capillary
LC system (Waters, UK) coupled to a Q-TOF mass
spectrometer (Micromass, Manchester, UK) equipped
with a Z-spray ion-source working in the nanoelectros-
pray mode. Glu-fibri nopeptide was used to calibrate the
instrument in MS/MS mode. Tryptic peptides were con-
centrated and desalted on a 75 μm ID × 150 mm C18
PepMap column (LC Packings, Amsterdam, The Neth-
erlands). Eluent A and B was 0.1% formic acid in 97%
water, 3% acetonitril e and 0.1% formic acid in 97% acet-
onitrile respectively. Six μl of sample were injected into
the nanoLC system, and separation was performed using
the fol lowing gradient: 0 min 7% eluent B, 35 min 50%
B, 45 min 80% B, 49 min 80% B, 50 min 7% B, 60 min
7% B. Database search was performed with ProteinLynx
screening SWISS-PROT and NCBI. For proteins that
were difficult to find, Mascot search tool available on
the Matrix Science site screening NCBInr was used.
Gel scanning and image analysis
Stained gels were scanned using an ImageScanner II (GE
Healthcare, Uppsala, Sweden) and ImageMaster™ (GE
Healthcare, Uppsala, Sweden) was used for computer
analysis.
Flow cytometric analysis of cell surface calreticulin
HL-60 cells were plated in 24-well plates and incubated
for the indicated time. Cells were harvested, washed
twice with PBS and incubated for 30 min with primary
antibody, diluted in cold blocking buffer (2% FBS in
PBS), followed by washing and incubation for 30 min
with the FITC-conjugated monoclonal secondary anti-
body diluted 1:500 in blocking buffer. Each sample was
then analyzed by FACScan (Becton Dickinson, USA) to
identify cell surface calreticulin. Isotype m atched IgG
antibodies were used as control, and the fluorescence
intensity of stained cells was gated on PI-negative cells.
Western blot analysis
To obtain a cytosolic-rich fraction, ZEA-treated cells
were harvested and washed once in ice cold PBS and
incubated at 4°C for 10 min with ice-cold cell lysis buf-
fer (250 mM sucrose, 70 mM KCl, 0.25% Triton X-100,
100 μM PMSF, 1 mM DTT in PBS with complete mini
protease inhibitor cocktail). The cell suspensi on was
centrifuged at 20,000 × g for 20 min. The supernatan t
was collected as the cytosolic-rich fraction. Protein con-
centration of the cytosolic-rich fraction was determined
by the Bradford method. Cytosolic proteins (50 μg) were
separated by 17% SDS-PAGE and transferred onto nitro-
cellulose membranes. After treating with 5% non-fat
milk in TBS containing 0.2% Tween-20 (blocking buf-
fer), membranes were incubated with mouse monoclonal
antibodies to cytochrome c, Bax and Bcl-2 and rabbit
polyclonal antibody to Bcl-xL. For detection, appropriate
horseradish peroxidase (HRP) conjugated secondary
antibodies were used at 1:20,000 dilution. Prote in bands
were visualized on X-ray film with SuperSignal West
Pico Chemiluminecent Substrate.
FACS analysis for cytosolic and mitochondrial Ca
2+
levels
Cytosolic Ca
2+
levels were determined using the fluores-
cence dye 1 μMFluo3-AMinFITCsetting.Mitochon-
drial Ca
2+
levels were determined using the fluorescent
dye 250 nM Rhod2-AM in PE setting. After treatment
Banjerdpongchai et al. Journal of Hematology & Oncology 2010, 3:50
/>Page 4 of 16
with ZEA for 4 h, cells were incubated with fluorescent
dye for 15 min at 37°C, and washed with PBS containing
10 mM glucose and analyzed immed iately by fl ow cyto-
metry. In each analysis, 10,000 events were recorded
and analyzed by FACScan (Becton Dickinson, USA).
RNA extraction and gene expression analysis
Real-time PCR was used to examine expression of endo-
plasmic reticulum stress genes, viz. calreticulin (CRT),
glucose-regulated protein-78 (GRP78) and endoplasmic
reticulum protein-29 (ERp29), in the human leukemic
cell culture. RNA was isolated from HL-60 cell culture
using RNA extraction kit following the manufacturer’s
protocol. Total RNA (1 μg) was converted to cDNA
using RevertAid™ First Strand cDNA Synthesis Kit. For
determination of ER stress gene expression, SYBR Green
detection was used and the values were normalized
using glyceraldehyde-3-phosphate dehydrogenase
(GAPDH). Real-time quantitative polymerase chain reac-
tion (PCR) was performed in a DNA Engine (ABi 7500)
using SYBR GREENER qPCR UNIVERSAL. Primers
sequences are as in Table 1. Relative expression levels
for each primer set were normalized to the expression
of GAPDH by the 2
-ΔCT
method [27].
Statistical analysis
Results were expressed as mean ± SEM (standard error of
mean). Statistical difference between control and treated
group was determi ned by the one-way ANOVA (Kru skal
Wallis analysis) at limit of p < 0.05 in triplicate of three
independent experiments. For comparison between two
groups, data were analyzed using Student’s t-test.
Results
Cell cytotoxicity with apoptotic induction
Cell viability was evaluated in HL-60, U937 and PBMCs
after incubation with ZEA for 24 h using MTT assay.
ZEA was toxic to U937 and HL-60 cells with IC
50
value
of 5.1 μg/ml and 44 μg/ml, respectively, but was less
toxictoPBMCs,(IC
50
value > 80 μg/ml) (Figure 2A).
However, low concentrations of ZEA (5-20 μg/ml) had a
proliferative effect on PBMCs. ZEA induced apoptotic
death of HL-60 cells as evidenced by the changes in cell
morphology (condensed nuclei and apoptotic bodies)
(data not shown) and presence of cells with subdiploid
DNA (Figure 2B). There was G1 arrest in HL-60 cel ls
treated with 50 μg/ml ZEA (Figure 2C) and in U937
cells with 16 μg/ml (Figure 2D).
Mitochondria involvement in ZEA-induced HL-60 and
U937 cell apoptosis
The reduction of mitochondrial transmembrane potential
(MTP) accompanied by release of cytochrome c into cyto-
sol is often associated with apoptosis [28]. Treatment with
ZEA resulted in an increase in percent cells with reduced
MTP (Figure 3A and 3B) and cytosolic cytochrome c in a
dose dependent manner in HL-60 (Figure 3C).
Expression of Bax, Bcl-2 and Bcl-xL in ZEA-treated
HL-60 cells
The mitochondrial apopt otic signaling pathway involves
Bax, a proapoptotic Bcl-2 family member, which induces
permeabilization of the mitochondrial outer membrane
allowing release of cytochrome c [29-31]. Bax expression
in HL-60 cells was up regulated in time dependent man-
ner (Figur e 4A). Expression of anti-apoptotic Bcl-2 did
not change, whereas that of anti-apoptotic Bcl-xL was
down regulated time-dependently (Figure 4A and 4B).
ROS production of ZEA on human leukemic cells
Changes in MTP are c onsidered to involve ROS pro-
duction [32]. The ability of ZEA to generate ROS was
investigated using a fluorescence sensitive probe
(dichlorofluorescein diacetate), which detects peroxide
radicals and various other active oxygen radicals
[33,34]. ROS was produced in ZEA-treated HL-60
(Figure 5) indicating that the cause of apoptotic cell
injury was via oxidative stress.
Effect of ZEA on activities of caspase-3 and -8 in HL-60
and U937 cells
To address the role of activation of caspase activities in
ZEA-induced HL-60 and U937 apoptosis, specific cas-
pase substrates were used, namely DEVD-AMC (cas-
pase-3 substrate) and IETD-AMC (caspase-8 substrate).
ZEA induced in a do se-dependent manner activation of
caspase-3 activity but not that of caspase-8 in HL-60
(Figure 6A) and U937 cells (Figure 6B).
Protein expression in ZEA-treated U937 and HL-60 cells
TheeffectsofZEAonproteinexpressioninU937and
HL-60 cells were explored by 2D-PAGE. In U937 cells
Table 1 Primer Sequences Used for Real-time Reverse
Transcription Polymerase Chain Reaction.
Gene Sequences (5’-3’) GenBank accession
number
GRP78 Forward:
GCCTGTATTTCTAGACCTGCC
Reverse: TTCATCTTGCCAGCCAGTTG
NM_005347.3
CRT Forward:
AAATGAGAAGAGCCCCGTTCTTCCT
Reverse:
AAGCCACAGGCCTGAGATTTCATCTG
NM_004343.3
ERp29 Forward:
CCTGAAGATCATGGGGAAGA
Reverse: TTCTGGAAGGCAGTCAGGAT
NM_001034025.1
GAPDH Forward: GAAGGTGAAGGTCGGAGTC
Reverse: GAAGATGGTGATGGGATTTC
NM_002046.3
Banjerdpongchai et al. Journal of Hematology & Oncology 2010, 3:50
/>Page 5 of 16
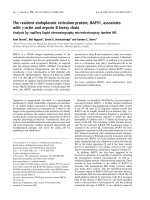
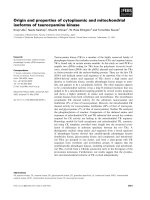
Figure 2 Effect of ZEA on cell cytotoxicity and apoptotic induction of human leukemic HL-60 and U937 cells. (A) Cell viability of HL-60,
U937 and human peripheral blood mononuclear cells using MTT assay. (B) DNA cell cycle analysis of HL-60 and U937 cells treated with ZEA for 24
h. * p < 0.05, compared with control cells. (C) and (D) Histograms of HL-60 and U937 cells treated with ZEA at indicated concentrations,
respectively. Cells were stained with PI and subjected to flow cytometer as described in Materials and methods. M1, subdiploid; M2, G1; M3, G2 M.
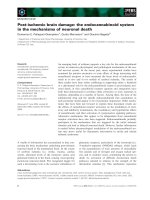
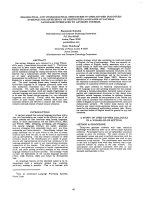
Figure 3 Mitochondria-mediated human leukemic cell apoptosis. Reduction of mitochondrial transmembrane potential of HL-60 (A) a nd
U937 (B) cells treated with ZEA. Cells were stained with 40 nM DiOC
6
for 15 min and then subjected to flow cytometry. Cells with decreased
mitochondrial transmembrane potential are less stained with DiOC
6
. (C) Release of cytochrome c from mitochondria. HL-60 cells were treated
with ZEA (10, 50 μg/ml) for 4 h and cytosolic cytochrome c was detected by Western blotting. Representative data from three independent
experiments are shown.
Banjerdpongchai et al. Journal of Hematology & Oncology 2010, 3:50
/>Page 6 of 16
treated with ZEA for 4 and 24 h, 4 spot differences were
detected (Figure 7A), which subsequently were shown
by LC-MS/MS to be fructose bisphosphate aldolase A,
muscle type, lung cancer antigen NY LU 1 (i ncreased in
ZEA-treated cells at 4 and 24 h, arrow 1), glyceralde-
hyde 3-phosphate dehydrogenase isozymes (GAPDH)
(increased in treated cells at 4 and 24 h, arrows 2 and 3)
and deoxyuridine triphosphate nucleotidohydrolase
mitochondrial precursor dUTP pyrophosphatase
(increased in treated cells at 24 h, arrow 4).
2D-PAGE revealed 22 proteins with different expres-
sion in the plasma membrane of HL-60 cells treated
with ZEA for 24 h compared to control (Figure 7B and
Table 2). LC-MS/MS indicated that the up regulated
proteins included 78 kDa glucose-regulated protein or
GRP78 (Figure 7B and Table 2, dot no. 3; 1.93 folded-
increase), calreticulin or CRT (dot no. 5; 2.39 folded-
increase), endoplasmic reticulum protein ERp29 (dot no.
21; 2.99 folded-increase), and apoptosis inducing factor
(AIF) (dot no. 11; 2.18 folded-increase), wh ereas expres-
sion of heat shock protein 90 (HSP90), which plays a
role in ER protein folding [35], was decreased (dot no.
2; 1.55 folded-decrease, Table 2). These results point to
the presence of ER stress in ZEA-treated leukemic cells.
ER stress gene expression at mRNA levels
The results of 2-dimensional gel electrophoresis led us to
examine the ER stress gene expression at mRNA levels of
three genes (GRP78, CRT and ERp29), which were
increased in 2-D PAGE (Table 2), employing real-time
RT-PCR. GRP78 mRNA had a tendency to be up regu-
lated in a time response manner whereas CRT mRNA was
down regulated in a time response pattern as shown in
Figure 8. However, ERp29 mRNA expression prominently
increased 3.8 folds compared to control (Figure 8), which
supported the rising amo unt of ERp29 prot ein in 2-D
(2.99 folds as in Table 2).
Cytosolic and mitochondrial Ca
2+
status in ZEA-treated
leukemic cells
Increases in cytosolic and mitochondrial Ca
2+
levels
have been found in ER stressed cells [36]. As indicated
above, apoptosis of leukemic cells induced by ZEA also
involved ER stress, Ca
2+
levels in both mitochondria and
cytosol were measured. FACS analysis histograms of
Fluo3-AM-stained (Figure 9A) and Rhod2-stained
(Figure 9B) HL-60 cells treated with 10 and 2 0 μg/ml
ZEA revealed increased Ca
2+
levels in both cytosolic and
mitochondrial compartments.
Effect of ZEA treatment on calreticulin exposure on
cell surface
Reduction of ER Ca
2+
level (ER stress) favors cell surface
exposure of calreticulin [37]. Exposure for 30 min of
HL-60 cells to ZEA (10, 20 and 50 μg/ml) d id not pro-
duce an increase in the presence of calreticuli n on the
cell surface as assessed by FACS (Figure 10).
Discussion
ZEA is a non-steroidal estrogenic mycotoxin produced
as a secondary metabolite by several fungi of t he genus
Figure 4 Expression of Bax, B cl-2 and Bcl-xL in ZEA-treated HL-
60 cells. Bax, Bcl-2 and Bcl-xL expression (A) and the ratio of Bax/Bcl-
xL (B) are from the same sample of cells. Representative data from
three independent experiments are shown. The density of bands are
plotted as ratio of Bax/Bcl-xL and the results are mean ± S.E.M. from
three independent experiments. *, p < 0.05, compared to control.
Figure 5 Generation by ZEA of reactive oxygen species (ROS)
in HL-60 cells. HL-60 cells were treated with 20 μg/ml ZEA for 4 h,
incubated with 5 μM DCFH-DA for 15 min and subjected to flow
cytometry. Histograms from flow cytometry are shown and cells
with increased fluorescence are designated as M1, indicating the
presence of ROS.
Banjerdpongchai et al. Journal of Hematology & Oncology 2010, 3:50
/>Page 7 of 16
Figure 6 Effect of zearalenone (ZEA) on activation of caspase-3 and caspase-8. Activity of caspase-3 and caspase-8 of HL-60 (A) and U937
(B) cells treated for 24 h with various concentrations of ZEA were measured using specific substrate analogs as described in Materials and
methods. Data represent mean values ± S.E.M. from three independent experiments. *, p < 0.05, compared to control.
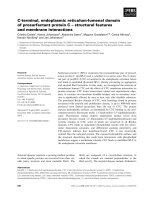
Figure 7 Two-dimensional polyacrylamide gel-electrophoresis pattern of U937 and HL-60 cells. (A) U937 cells cultured for 4 and 24 h in
the presence or absence of ZEA. (a) control 4 h cells, (b) control 24 h cells, (c) cells treated with 6 μg/ml ZEA for 4 h, (d) cells treated with 6
μg/ml ZEA for 24 h. (Arrow 1) fructose bisphosphate aldolase A, muscle type, lung cancer antigen NY LU1, (arrow 2 and 3) glyceraldehyde 3-
phosphate dehydrogenase, (arrow 4) deoxyuridine triphosphate nucleotidohydrolase, mitochondrial precursor. (B) HL-60 cell cultured for 24 h
with (right panel) and without ZEA (left panel). There are 22 protein dots of different expression in plasma membrane. The list of proteins
identified by LC/MS/MS is shown in Table 1.
Banjerdpongchai et al. Journal of Hematology & Oncology 2010, 3:50
/>Page 8 of 16
Table 2 Identified Plasma Membrane Protein Spots in 24 h ZEA-treated HL-60 Cells by LC/MS/MS
Spot
no.
Protein Name
(s)
Description MW/
pI
Peptide
match
%
Coverage
Sequence *Expression
in treated
cells (folds)
1 TERA_HUMAN Transitional endoplasmic
reticulum ATPase
89.3/
5.18
- - - -1.99
2 GFAP_HUMAN Glial fibrillary acidic
protein
49.8/
5.25
1 2.55 (K)LALDIEIATYR(K) -1.55
K2C8_HUMAN Keratin, type II
cytoskeletal 8
53.7/
5.34
1 2.28
HS90A_HUMAN Heat shock protein HSP
90-alpha
83.2/
4.97
7 10.00 K.IDIIPNPQER.T
K.EDQTEYLEER.R
K.HFSVEGQLEFR.A
R.RAPFDLFENK.K
R.GVVDSEDLPLNISR.E
K.FYEAFSK.N
K.EGLELPEDEEEK.K
3 GRP78_HUMAN 78 kDa glucose-regulated
protein precursor (GRP
78)
72.3/
5.10
- - - 1.93
4 PLSL_HUMAN L-plastin, Lymphocyte
cytosolic protein 1
70.2/
5.02
11 22.01 (K)AACLPLPGYR(V)
(K)IGLFADIELSR(N)
(R)NEALIALLR(E)
(K)LSPEELLLR(W)
(K)AYYHLLEQVAPK(G)
(R)QFVTATDVVR(G)
(K)LNLAFIANLFNR(Y)
(R)VNHLYSDLSDALVIFQLYEK(I)
(K)FSLVGIGGQDLNEGNR(T)
(R)YTLNILEEIGGGQK(V)
(K)VNDDIIVNWVNETLR(E)
-3.1
5 CALR_HUMAN Calreticulin precursor 60.6/
4.37
- - - 2.39
6 PDIA1_HUMAN Protein disulfide
isomerase precursor
51.1/
4.78
- - - 2.86
7 EF2_HUMAN Elongation factor 2 95.1/
6.78
- - - -2.87
8 gi|28317 unnamed protein
product
59.5/
5.17
3 6.00 R.ALEESNYELEGK.I
R.QSVEADINGLR.R
R.NVQALEIELQSQLALK.Q
2.26
9 DHSA_HUMAN Succinate dehydrogenase
[ubiquinone] flavoprotein
subunit, mitochondrial
72.6/
7.04
4 8.43 (R)AAFGLSEAGFNTACVTK(L)
(R)GVIALCIEDGSIHR(I)
(K)NTVVATGGYGR(T)
(R)LGANSLLDLVVFGR(A)
-1.29
TCPG_HUMAN T-complex protein 1
subunit gamma
60.5/
6.06
1 2.02 (K)TAVETAVLLLR(I)
10 SERA_HUMAN D-3-phosphoglycerate
dehydrogenase
56.6/
6.28
1 2.44 (K)GTIQVITQGTSLK(N) -1.34
TCPZ_HUMAN T-complex protein 1
subunit zeta
58.0/
6.22
1 2.26 (K)GIDPFSLDALSK(E)
gi|4502643 chaperonin containing
TCP1, subunit 6A
isoform a
58.0/
6.23
7 15.00 R.AQAALAVNISAAR.G
K.QADLYISEGLHPR.I
R.IITEGFEAAK.E
K.ALQFLEEVK.V
K.SETDTSLIR.G
K.GIDPFSLDALSK.E
K.VLAQNSGFDLQETLVK.I
gi|1002923 coronin-like protein 51.0/
6.12
7 15.00 R.HVFGQPAK.A
R.EPVVTLEGHTK.R
R.AVFVSEGK.I
K.ILTTGFSR.M
R.DAGPLLISLK.D
R.AAPEASGTPSSDAVSR.L
K.LQATVQELQK.R
11 119623333 apoptosis inducing factor
like isoform CRA d Homo
sapiens
63.7/
10.23
1 1.21 (R)LLSATSR(T) 2.18
Banjerdpongchai et al. Journal of Hematology & Oncology 2010, 3:50
/>Page 9 of 16
Table 2 Identified Plasma Membrane Protein Spots in 24 h ZEA-treated HL-60 Cells by LC/MS/MS (Continued)
RN112_HUMAN RING finger protein 112 68.3/
8.45
1 1.11 (R)LSGRYPK(V)
gi|4557014 catalase [Homo sapiens] 59.7/
6.90
12 28.00 K.ADVLTTGAGNPVGDK.L
K.LNVITVGPR.G
K.GAGAFGYFEVTHDITK.Y
R.FR.DPILFPSFIHSQK.R
STVAGESGSADTVR.D
K.NLSVEDAAR.L
R.LSQEDPDYGIR.D
R.DLFNAIATGK.Y
R.LFAYPDTHR.H
K.DAQIFIQK.K
K.NFTEVHPDYGSHIQALLDK.Y
K.NAIHTFVQSGSHLAAR.E
gi|28317 unnamed protein
product
59.5/
5.17
7 14.00 R.ALEESNYELEGK.I
K.YENEVALR.Q
R.QSVEADINGLR.R
K.ADLEMQIESLTEELAYLK.K
R.NVQALEIELQSQLALK.Q
K.QSLEASLAETEGR.Y
R.LENEIQTYR.S
12 SAM50_HUMAN Sorting and assembly
machinery component
50 homolog
51.9/
6.46
5 14.50 (K)VNQELAGYTGGDVSFIK(E)
(K)EDFELQLNK(Q)
(R)THFFLNAGNLCNLNYGEGPK(A)
(R)WSYGAGIVLR(L)
(R)ICDGVQFGAGIR(F)
-1.98
gi|7022134 unnamed protein
product
51.9/
6.62
9 20.00 K.DVVVQHVHFDGLGR.T
K.VTFQFSYGTK.E
R.NFSVNLYK.V
K.VTGQFPWSSLR.E
K.WEGVWR.E
K.VNQELAGYTGGDVSFIK.E
K.EDFELQLNK.Q
R.FYLGGPTSVR.G
R.WSYGAGIVLR.L
gi|4929571 CGI-51 protein 52.1/
6.85
10 26.00 K.DVVVQHVHFDGLGR.T
K.VTFQFSYGTK.E
R.NFSVNLYK.V
K.VTGQFPWSSLR.E
K.WEGVWR.E
K.VNQELAGYTGGDVSFIK.E
K.EDFELQLNK.Q
K.
QLIFDSVFSASFWGGMLVPIGDKPSSIADRFYLGGPTSIR.
G
R.FYLGGPTSIR.G
R.WSYGAGIVLR.L
ANX11_HUMAN Annexin A11 54.3/
7.53
5 11.00 R.GTITDAPGFDPLR.D
K.TPVLFDIYEIK.E
R.LLISLSQGNR.D
R.SETDLLDIR.S
K.SLYHDISGDTSGDYR.K
13,14 ENOA_HUMAN Alpha-enolase 47.0/
7.54
- - - -1.57,
-1.88
15 119571303 spectrin domain with
coiled coils 1 isoform
CRA d Homo sapiens
28.9/
4.97
1 4.20 (R)LQIVSLASWAR(A) 5.14
ATPG_HUMAN ATP synthase subunit
gamma, mitochondrial
33.0/
9.56
1 4.03 (R)IYGLGSLALYEK(A)
TPM3_HUMAN Tropomyosin alpha-3
chain
32.8/
4.49
1 2.82 (K)HIAEEADR(K)
ES8L1_HUMAN Epidermal growth factor
receptor kinase substrate
8-like protein 1
80.3/
5.66
1 0.69 (K)SGPSR(K)
Banjerdpongchai et al. Journal of Hematology & Oncology 2010, 3:50
/>Page 10 of 16
Table 2 Identified Plasma Membrane Protein Spots in 24 h ZEA-treated HL-60 Cells by LC/MS/MS (Continued)
gi|16877071 ATP synthase, H+
transporting,
mitochondrial F1
complex, gamma
polypeptide 1
32.9/
9.23
3 11.00 R.IYGLGSLALYEK.A
K.HLLIGVSSDR.G
K.ELIEIISGAAALD
16 LDHB_HUMAN L-lactate dehydrogenase
B chain
36.6/
5.64
2 8.08 (K)SLADELALVDVLEDK(L)
(R)VIGSGCNLDSAR(F)
-1.62
AFF4_HUMAN AF4/FMR2 family
member 4
12.7/
9.68
1 0.77 (K)NSSSTSKQK(K)
17 COMT_HUMAN Catechol O-
methyltransferase
30.0/
5.12
2 14.02 (K)VTLVVGASQDIIPQLK(K)
(K)GTVLLADNVICPGAPDFLAHVR(G)
1.07
PODXL_HUMAN Podocalyxin like protein
1 precursor
55.6/
5.23
1 2.46 (R)LASVPGSQTVVVK(E)
121944562 immunoglobulin A heavy
chain variable region
Homo sapiens
11.9/
5.64
1 5.50 (K)VDGIEK(Y)
TRM13_HUMAN tRNA guanosine-2’-O-
methyltransferase TRM13
homolog
54.2/
8.01
1 2.49 (R)KTSLETSNSTTK(R)
18 ANXA1_HUMAN Annexin A1 38.7/
6.63
5 22.00 K.GGPGSAVSPYPTFNPSSDVAALHK.A
K.GVDEATIIDILTK.R
K.ALTGHLEEVVLALLK.T
K.TPAQFDADELR.A
K.GTDVNVFNTILTTR.S
3.25
CN102_HUMAN UPF0614 protein
C14orf102
13.2/
7.60
1 0.52 (R)LISLAK(C)
19 SOCS4_HUMAN Suppressor of cytokine
signaling 4
50.6/
6.64
1 1.36 (R)SDLAFR(W) -3.12
K2C1_HUMAN Keratin, type II
cytoskeletal 1(CK-1)
65.8/
8.16
4 5.00 R.QFSSR.S
K.AEAESLYQSK.Y
K.YEELQITAGR.H
K.LALDLEIATYR.T
K2C7_HUMAN Keratin, type II
cytoskeletal 7 (CK-7)
51.2/
5.50
1 2.00 K.LALDIEIATYR.K
20 gi|189054178 unnamed protein
product [Homo sapiens]
66.0/
7.62
4 6.00 R.SLDLDSIIAEVK.A
K.YEELQITAGR.H
K.LNDLEDALQQAK.E
R.TLLEGEESR.M
-2.84
21 AF047368_1 nebulette Homo sapiens 11.6/
7.98
1 0.99 (K)ENQGNISSVK(Y) 2.99
ERp29_HUMAN Endoplasmic reticulum
protein ERp29
29.0/
6.77
7 22.00 K.GALPLDTVTFYK.V
K.GALPLDTVTFYK.V
K.FVLVK.F
R.DGDFENPVPYTGAVK.V
K.QGQDNLSSVK.E
K.WAEQYLK.I
K.SLNILTAFQK.K
22 ATP5H_HUMAN ATP synthase subunit d,
mitochondrial
18.5/
5.21
6 40.00 K.TIDWVAFAEIIPQNQK.A
K.SWNETLTSR.L
R.LAALPENPPAIDWAYYK.A
K.AGLVDDFEK.K
K.YTAQVDAEEK.E
K.YTAQVDAEEKEDVK.S
-1.08
gi|189054178 unnamed protein
product
66.0/
7.62
3 5.00 K.SLNNQFASFIDK.V
R.SLDLDSIIAEVK.A
K.LALDLEIATYR.T
23 B2MG_HUMAN Beta-2 microglobulin 12.7/
5.77
2 18.00 R.VNHVTLSQPK.I
K.VEHSDLSFSK.D
1.35
24 NDUBA_HUMAN NADH dehydrogenase
[ubiquinone] 1 beta
subcomplex subunit 10
20.8/
8.60
3 20.35 (K)AFDLIVDRPVTLVR(E)
(K)EVEQFTQVAK(A)
(R)YQDLGAYSSAR(K)
-1.05
Banjerdpongchai et al. Journal of Hematology & Oncology 2010, 3:50
/>Page 11 of 16
Fusarium [38,39]. In the present study, ZEA induced
apoptosis in human leukemic HL-60 and U937 cell
lines, but less in PBMCs, as evidenced by presence of
apoptotic bodi es and cells with subdiploid peaks (repre-
senting DNA fragmentation). ZEA is cytotoxic to bovine
lymphocytes [40] and induces human PBMC apoptosis
and necrosis depending on the concentrations of
ZEA [41].
Two central pathways have been shown to be involved
in the process of apoptotic cell d eath: one is the death
receptor pathway with direct involvemen t of caspase-8
and the other is the mitochondrial pathway in which
cytochrome c is released from mitochondria into cyto-
sol. Data presented here suggest that mitochondrial dys-
function is the mechanism involved in ZEA-induced
apoptotic death in human leukemic cells. ZEA targets
mitochondria and/or lysosomes and induces lipid perox-
idation (indicating oxidative stress) and cell death in
human colon Caco-2 cell line [42]. The loss of mito-
chondrial t ransmembrane potential and the increase of
ROS generation were early events caused by ZEA. The
following two possibilities are proposed: (i) ZEA
increases ROS production which leads to mitochondrial
dysfunction; (ii) Mitochondrial dysfunction is induced
by ZEA treatment and results in ROS generation.
Bax, a pro-apoptotic protein in Bcl-2 family, was upre-
gulated i ndicating the involvement of mitochondria, as
Bax forms channels at the outer mitochondrial m em-
brane to facilitate the release of cytochrome c [43,44].
Activation of mitochondrial permeability transition is
required for the complete release of cytochrome c
[45,46]. The increased ratios of Bax/Bcl-2 and Bax/Bcl-
xL in ZEA-treated human le ukemic cells would facilitate
this process. It has been recently reported that ZEA-
induced human hepatoma HepG2 c ell apoptosis also
involves mitochondrial a lterations including Bax reloca-
lization into the mitochondrial outer membrane, loss of
mitochondrial transmembrane potential, permeability
transition pore complex opening, ROS production and
cytochrome c release [32].
Table 2 Identified Plasma Membrane Protein Spots in 24 h ZEA-treated HL-60 Cells by LC/MS/MS (Continued)
gi|189054178 unnamed protein
product
65.9/
7.62
7 12.00 R.TNAENEFVTIK.K
R.SLDLDSIIAEVK.A
K.YEELQITAGR.H
K.LNDLEDALQQAK.E
K.LALDLEIATYR.T
R.TLLEGEESR.M
R.GSGGGSSGGSIGGR.G
25 ASCC1_HUMAN Activating signal
cointegrator 1 complex
subunit 1
45.48/
5.22
1 1.75 (R)SFALLPR(L) 1.11
PHB_HUMAN prohibitin 29.8/
5.57
11 52.00 K.FGLALAVAGGVVNSALYNVDAGHR.A
K.DLQNVNITLR.I
R.FDAGELITQR.E
R.AATFGLILDDVSLTHLTFGK.E
K.EFTEAVEAK.Q
K.QVAQQEAER.A
K.AAIISAEGDSK.A
K.AAELIANSLATAGDGLIELR.K
R.KLEAAEDIAYQLSR.S
K.LEAAEDIAYQLSR.S
R.NITYLPAGQSVLLQLPQ
26 PHB_HUMAN Prohibitin 29.8/
5.57
13 59.00 K.VFESIGK.F
K.DLQNVNITLR.I
R.ILFRPVASQLPR.I
R.IFTSIGEDYDER.V
R.VLPSITTEILK.S
R.FDAGELITQR.E
R.AATFGLILDDVSLTHLTFGK.E
K.EFTEAVEAK.Q
K.QVAQQEAER.A
K.AAIISAEGDSK.A
K.AAELIANSLATAGDGLIELR.K
R.KLEAAEDIAYQLSR.S
R.NITYLPAGQSVLLQLPQ
1.06
NDUS3_HUMAN NADH dehydrogenase
[ubiquinone] iron-sulfur
protein 3, mitochondrial
30.2/
6.99
2 9.00 K.SLVDLTAVDVPTR.Q
K.DFPLSGYVELR.Y
Note: Spot no. 1, 3, 5, 7, 13 and 14 were matched from our hepatocellular carcinoma cell line database. *The density of spots were calculated as percent volume
and shown in this table as folds of increase or decreas e (-).
Banjerdpongchai et al. Journal of Hematology & Oncology 2010, 3:50
/>Page 12 of 16
Figure 8 Real-time reverse transcription polymerase chain reaction of GRP78, CRT and ERp29 genes. HL-60 cells were treated with 20 μg/
ml ZEA for indicated time of incubation. The levels of mRNA were normalized to the level of GAPDH mRNA. After the normalization, the mRNA
level was expressed as the fold change compared to that in the basal group untreated with ZEA (at 0 h). Data are the mean ± S.E.M. of three
independent experiments. * p < 0.05 compared to control, # p < 0.01 compared to control.
Figure 9 Effect of ZEA on cytosolic (A) and mitochondrial (B) Ca
2+
level in HL-60 cells. HL-60 cells were incubated with Fluo3 (cytosolic) or
Rhod2 (mitochondrial) Ca
2+
- specific dye for 15 min after treatment with and without ZEA for 1 h, then were subjected to flow cytometry as
described in Materials and Methods. Black trace, control cells; red trace, ZEA-treated cells. Histogram of FACS analysis represents one of three
independent experiments.
Banjerdpongchai et al. Journal of Hematology & Oncology 2010, 3:50
/>Page 13 of 16
Proteomic profiling of ZEA-treated and untreated
U937 cells revealed a role of enzymes in carbohydrate
and nucleotide metabo lism in apoptosis. Besides its role
in glycolysis, GAPDH initiates a cell death cascade [47].
Diverse apoptotic stimuli activate inducible nitric oxide
synthase (iNOS) or neuronal NOS (nNOS), with the NO
S-nitrosylating G APDH, abolishing its catalytic activity
and conferring on it the ability to bind to Siah1, an E3-
ubiquitin-ligase with a nuclear localizing signal. The
GAPDH-Siah1 protein complex, in turn, translocates to
the nucleus and mediates cell death.
The involvement of ER stress in ZEA-induced apopto-
sis shown in this study led to an investigation of CRT,
an ER-resident stress-regulated chaperone with C-term-
inal KDEL signal [48,49]. Under certain circumstances,
ER dysfunction leads to an accumulation of unfolded or
misfolded proteins in the ER lumen and activates com-
pensatory mechanism, which has been referred to as ER
stress response or unfolded protein response [50]. Sev-
eral ER transmembrane proteins are identified as sen-
sors of ER stress. These include pancreatic ER kinase
(PERK), inositol requiring enzyme 1 (IRE1) and activat-
ing transcription factor 6 (ATF 6). PERK phosphorylates
the alpha subunit of eukaryotic initiation factor 2
(eIF2alpha), which attenuates the initiation of translation
in response to ER stress. The activation of IRE1 and
ATF6 signaling promotes pro-apoptotic transcription
factor CH OP and the expression of ER- localized
chaperones, such as CRT, GRP78 and GRP94, which
facilitate the restoration of proper protein folding within
the ER [50]. These protective re sponses result in an
overall decrease in translation, enhanced protein degra-
dation and increased levels of ER chaperones, which
consequently increase the protein folding capacity of the
ER. However, sustained ER stress ultimately leads to
decreased ER chaperone and cell death [50]. CRT was
translocated to the cell membrane of human leukemic
cells treated with ZEA (Figure 7B). ER also regulates cal-
cium ion homeostasis and Ca
2+
levels were increa sed in
cytosol and mitochondria, suggesting the involvement of
ER stress in ZEA-treated human leukemic cells. 2D-
PAGE of HL-60 treated cells showed increased expres-
sion of GRP78, ERp29 and CRT precursor confirming
the existence of ER stress. Real-time reverse transcrip-
tion PCR supported the involvement of ERp29 in the
human leukemic HL-60 cell apoptosis. For CRT and
GRP78 gene expression, the mRNA might not be stable
and was degraded at the measured-time. Nevertheless,
ER stress can also activate caspase-9 by releasing cyto-
chrome c from mitochondria to cytosol [24,25].
The accumulation of unfolded proteins in the ER was
a marker of cellular stress induced by ZEA. Oxidative
stress was also found in ZEA-stimulated human leuke-
mic cell apoptosis (Figure 5). The involvement of ER
stress and oxidative stress in ZEA-induced apoptosis of
human leukemic cell lines are first described, however,
further experiments are required to demonstrate the sig-
naling relationship between the oxidative stress and ER
stress.
The contents of ZEA in the daily intake might
enhance the apoptotic effect of promyelocytic and
monocytic leukemic cell lines in the leukemic patients.
ZEA-induced apoptosis and necrosis occur in human
PBMCs in vitro depending on the concentrations of
ZEA [41]. The major metabolites of ZEA in various spe-
cies are alpha and beta zearalenol. Alpha and beta zeara-
lenol inhibit cell viability and induce oxidative stress and
stress protein (HSP70 and HSP27) expression in Vero
cells (kidney epithelial cells extracted from African
green monkey) [51]. However, more studies should be
performed in in vivo model before using ZEA as a ther-
apeutic drug.
Taken together, the intrinsic (mitochondrial) and ER
stress pathways cooperat ed in ZEA-induced human leu-
kemic cell apoptosis. An understanding of the mechan-
ism of ZEA-activated leukemic cell death is a basic step
in clinical therapeutic approaches.
Acknowledgements
This work was financially supported by Thailand Research Fund (TRF) and
Commission of Higher Education (CHE), grant No. RMU5080003. We thank
Prof. Prapon Wilairat for editing the manuscript.
Figure 10 Cell surface exposure of calreticulin in ZEA-t reated
HL-60 cells. Cells were treated for 30 min with ZEA at indicated
concentrations and analyzed for the caltreticulin exposure by flow
cytometry as described in Materials and Methods. Histogram of
FACS analysis represents one of three independent experiments.
Banjerdpongchai et al. Journal of Hematology & Oncology 2010, 3:50
/>Page 14 of 16
Author details
1
Department of Biochemistry, Faculty of Medicine, Chiang Mai University,
Chiang Mai 50200, Thailand.
2
Laboratory of Biochemistry, Chulabhorn
Research Institute, Bangkok 10210, Thailand.
3
Department of Biochemistry,
Faculty of Science, Mahidol University, Rama VI Road, Bangkok 10400,
Thailand.
Authors’ contributions
RB, OK and PK conceived, designed and implemented the study, and
drafted the manuscript. The 2-D PAGE coupled with LC-MS/MS analysis were
performed and supervised by DC, PS, CS and JS. All authors read and
approved the final draft of the manuscript.
Competing interests
The authors declare that they have no competing interests.
Received: 26 October 2010 Accepted: 30 December 2010
Published: 30 December 2010
References
1. Nikov G, Hopkins N, Boue S, Alworth WL: Interactions of dietary estrogens
with human estrogen receptors and the effect on estrogen receptor-
estrogen response element complex formation. Environ Health Perspect
2000, 108:867-872.
2. Kuiper GG, Lemma JG, Carlsson B, Corton JC, Safe SH, van der Saag PT, van
der Burg B, Gustafsson JA: Interaction of estrogenic chemicals and
phytoestrogens with estrogen receptors (beta). Endocrinology 1998,
139:4252-4263.
3. Janardhana GR, Rabeas KA, Shekar Shetty H: Mycotoxin contamination of
maize grains grown in Karnataka (India). Food Chem Toxicol 1999,
37:863-868.
4. Okoye ZS: Stability of zearalenone in naturally contaminated corn during
Nigerian traditional brewing. Food Addit Contam 1987, 4:57-59.
5. Reza Oveisi M, Hajimahmoodi M, Memarian S, Sadeghi N, Shoeibi S:
Determination of zearalenone in corn flour and a cheese snack product
using high-performance liquid chromatography with fluorescence
detection. Food Addit Contam 2005, 22:443-448.
6. Minervini F, Giannoccaro A, Cavallini A, Visconti A: Investigations on
cellular proliferation induced by zearalenone and its derivatives in
relation to the estrogenic parameters. Toxicol Lett 2005, 159:272-283.
7. Abid-Essefi S, Baudrimont I, Hassen W, Ouanes Z, Mobio TA, Anane R,
Creppy EE, Bacha H: DNA fragmentation, apoptosis and cell cycle arrest
induced by zearalenone in cultured DOK, Vero and Caco-2 cells:
prevention by vitamin E. Toxicology 2003, 192:237-248.
8. Ayed-Boussema I, Bouaziz C, Rjiba K, Valenti K, Laporte F, Bacha H,
Hassen W: The mycotoxin Zearalenone induces apoptosis in human
hepatocytes (HepG2) via p53-dependent mitochondrial signaling
pathway. Toxicol In Vitro 2008, 22:1671-1680.
9. Dias N, Bailly C: Drugs targeting mitochondrial functions to control tumor
cell growth. Biochem Pharmacol 2005, 70:1-12.
10. Schulze-Osthoff K, Ferrari D, Los M, Wesselborg S, Peter M: Apoptosis
signaling by death receptors. Eur J Biochem 1998, 254:439-459.
11. Rao RV, Ellerby HM, Bredesen DE: Coupling endoplasmic reticulum stress
to the cell death program. Cell Death Differ 2004, 11:372-380.
12. Budihardjo I, Oliver H, Lutter M, Luo X, Wang X: Biochemical pathways of
caspase activation during apoptosis. Annu Rev Cell Dev Biol 1999,
15:269-290.
13. Li UX, Kim CN, Yang J, Jemmerson R, Wang X: Induction of apoptotic
program in cell-free extracts: requirement for dATP and cytochrome c.
Cell 1996, 86:147-157.
14. Thorburn A: Death receptor-induced cell killing. Cell Signal 2004,
16:139-144.
15. Boyce M, Yuan J: Cellular response to endoplasmic reticulum stress: a
matter of life or death. Cell Death Differ 2006, 13:363-373.
16. Yamaguchi H, Wang HG: CHOP is involved in endoplasmic reticulum
stress-induced apoptosis by enhancing DR5 expression in human
carcinoma cells. J Biol Chem 2004, 279:45495-45502.
17. Johnson S, Michalak M, Opas M, Eggleton P: The ins and outs of
calreticulin: from the ER lumen to the extracellular space. Trends Cell Biol
2001, 11:122-129.
18. Michalak M, Corbett EF, Mesaeli N, Nakamura K, Opas M: Calreticulin: one
protein, one gene, many functions. Biochem J 1999, 344:281-292.
19. Gardai SJ, McPhillips KA, Frasch SC, Janssen WJ, Starefeldt A, Murphy-
Ullrich JE: Cell surface calreticulin initiates clearance of viable or
apoptotic cells through transactivation of LRP on the phagocyte. Cell
2005, 123:321-334.
20. Obeid M, Tesniere A, Ghringhelli F, Fimia GM, Apetoh L, Perfettini JL:
Calreticulin exposure dictates the immunogenicity of cancer cell death.
Nat Med 2007, 13:54-61.
21. Apetoh L, Ghringhelli F, Tesniere A, Obeid M, Ortiz C, Criolo A: Toll-like
receptor 4-dependent contribution of the immune system to anti-cancer
chemo- and radiotherapy. Nat Med 2007, 13:1050-1059.
22. Casares N, Pequignot MO, Tesniere A, Ghringhelli F, Roux S, Chaput N:
Caspase-dependent immunogenicity of doxorubicin-induced tumor cell
death. J Exp Med 2005, 202:1691-1701.
23. Srivastava PK: Heat shock protein-based novel immunotherapies. Drug
News Perspect 2000, 13:517-522.
24. Momoi T: Caspases involved in ER stress-mediated cell death. J Chem
Neuroanat 2004, 28:101-105.
25. Jimbo A, Fujita E, Kouroku Y, Ohnishi J, Inohara N, Kuida K, Sakamaki K,
Yonchara S, Momoi T: ER stress induces caspase-8 activation, stimulating
cytochrome c release and caspase-9 activation. Exp Cell Res 2003,
283:156-166.
26. Su WC, Chang SL, Chen TY, Chen JS, Tsao CJ: Comparison in in vitro
growth-inhibitory activity of carboplatin and cisplatin on leukemic cells
and hematopoietic progenitors: the myelosuppressive activity of
carboplatin may be greater than its antileukemic effect. Jpn J Clin Oncol
2002, 30:562-567.
27. Livak KJ, Schmittgen TD: Analysis of relative gene expression data using
real-time quantitative PCR and the 2(-Delta Delta C(T)) Method. Methods
2001, 25:402-408.
28. Gottlieb E, Armour SM, Harris MH, Thompson CB: Mitochondrial
membrane potential regulates matrix configuration and cytochrome c
release. Cell Death Differ 2003, 10:709-717.
29. Roucou X, Montessuit S, Antonsson B, Martinou JC: Bax oligomerization in
mitochondrial membranes requires tBid (caspase-8-cleaved Bid) and a
mitochondrial protein. Biochem J 2002, 368:915-921.
30. Scorrano L, Korsmeyer SJ: Mechanisms of cytochrome c release by
proapoptotic BCL-2 family members. Biochem Biophys Res Commun 2003,
304:437-444.
31. Korsmeyer SJ, Wei MC, Saito M, Weiler S, Oh KJ, Schlesinger PH: Pro-
apoptotic cascade activates BID, which oligomerizes BAK or BAX into
pores that result in the release of cytochrome c. Cell Death Differ 2000,
7:1166-1173.
32. Bouaziz C, Sharaf El Dein O, El Golli E, Abid-Essefi S, Brenner C, Lemaire C:
Different apoptotic pathways induced by zearalenone, T-2 toxin and
ochratoxin A in human hepatoma cells. Toxicology 2008, 254:19-28.
33. Bizyukin AV, Korkina LG, Velichkovskii BT: Comparative Use of 2,7-
dichlorofluorescin diacetate, dihydrorhodamine 123, and hydroethidine
to study oxidative metabolism in phagocytic cells. Bull Eksp Biol Med
1995, 119:347-351.
34. Silveira LR, Pereira-Da-Silva L, Juel C, Hellsten Y: Formation of hydrogen
peroxide and nitric oxide in rat skeletal muscle cells during contractions.
Free Radic Biol Med 2003, 35:455-464.
35. Picard D: Heat-shock protein 90, a chaperone for folding and regulation.
Cell Mol Life Sci 2002, 59:1640-1648.
36. Zhang D, Armstrong JS: Bax and the mitochondrial permeability
transition cooperate in the release of cytochrome c during endoplasmic
reticulum-stress-induced apoptosis. Cell Death Differ 2007, 14:703-715.
37. Tufi R, Panaretakis T, Bianchi K, Criollo A, Fazi B, Di Sano F, Tesniere A,
Kepp O, Paterlini-Brechot P, Zitvogel L, Piacentini M, Szabadkai G,
Kroemer G: Reduction of endoplasmic reticulum calcium ion levels favors
plasma membrane surface exposure of calreticulin. Cell Death Differ 2007,
14:1-9.
38. D’Mello JPF, Placinta CM, MacDonald AMC: Fusarium mycotoxins: a review
of global animal health, welfare and reproductivity. Anim Feed Sci Technol
1999, 78:183-205.
39. Minervini F, Dell’Aquila ME, Maritato F, Minoia P, Visconti A: Toxic effects of
the mycotoxin zearalenone and its derivatives on in vitro maturation of
bovine oocytes and 17[beta]-estradiol levels in mural granulosa cell
cultures. Toxicol In Vitro 2001, 15:489-495.
Banjerdpongchai et al. Journal of Hematology & Oncology 2010, 3:50
/>Page 15 of 16
40. Lioi MB, Santoro A, Barbieri R, Salzano S, Ursini MV: Ochratoxin A and
zearalenone: a comparative study on genotoxic effects and cell death
induced in bovine lymphocytes. Mutat Res 2004, 557:19-27.
41. Vlata Z, Porichis F, Tzanakakis G, Tsatsakis A, Krambovitis E: A study of
zearalenone cytotoxicity on human peripheral blood mononuclear cells.
Toxicol Lett 2006, 165:274-281.
42. Kouadio JH, Mobio TA, Baudrimont I, Moukha S, Dano SD, Creppy EE:
Comparative study of cytotoxicity and oxidative stress induced by
deoxynivalenol, zearalenone or fumonisin B1 in human intestinal cell
line Caco-2. Toxicology 2005, 213:56-65.
43. Jürgensmeier JM, Xie Z, Deveraux Q, Ellerby L, Bredesen D, Reed J: Bax
directly induces release of cytochrome c from isolated mitochondria.
Proc Natl Acad Sci USA 1998, 95:4997-5002.
44. Antonsson B, Montessuit S, Lauper S, Eskes R, Martinou JC: Bax
oligomerization is required for channel-forming activity in liposomes
and to trigger cytochrome c release from mitochondria. Biochem J 2000,
345:271-278.
45. Yang JC, Cortopassi GA: Induction of the mitochondrial permeability
transition causes release of the apoptogenic factor cytochrome c. Free
Radic Biol Med 1998, 24:624-631.
46. Bradham CA, Qian T, Streetz K, Trautwein C, Brenner DA, Lemasters JJ: The
mitochondrial permeability transition is required for tumor necrosis
factor alpha-mediated apoptosis and cytochrome c release. Mol Cell Biol
1998, 18:6353-6364.
47. Hara MR, Agrawal N, Kim SF, Cascio MB, Fujimuro M, Ozeki Y, Takahashi M,
Cheah MJH, Tankou SK, Hester LD, Ferris CD, Hayward SD, Snyder SH,
Sawa A: S-nitrosylated GAPDH initiates apoptotic cell death by nuclear
translocation following Siah1 binding. Nat Cell Biol 2005, 7:665-674.
48. Munro S, Pelham HR: A C-terminal signal prevents secretion of luminal
ER proteins. Cell 1987, 48:899-907.
49. Pelham HR: Evidence that luminal ER proteins are sorted from secreted
proteins in a post-ER compartment. EMBO J 1988, 7:913-918.
50. Xu C, Bailly-Maitre B, Reed JC: Endoplasmic reticulum stress: cell life and
death decision. J Clin Invest 2005, 115:2656-2664.
51. Othmen ZO, Golli EE, Abid-Essefi S, Bacha H: Cytotoxicity effects induced
by Zearalenone metabolites, alpha Zearalenol and beta Zearalenol, on
cultured Vero cells. Toxicology 2008, 252:72-77.
doi:10.1186/1756-8722-3-50
Cite this article as: Banjerdpongchai et al.: Mitochondrial and
endoplasmic reticulum stress pathways cooperate in zearalenone-
induced apoptosis of human leukemic cells. Journal of Hematology &
Oncology 2010 3:50.
Submit your next manuscript to BioMed Central
and take full advantage of:
• Convenient online submission
• Thorough peer review
• No space constraints or color figure charges
• Immediate publication on acceptance
• Inclusion in PubMed, CAS, Scopus and Google Scholar
• Research which is freely available for redistribution
Submit your manuscript at
www.biomedcentral.com/submit
Banjerdpongchai et al. Journal of Hematology & Oncology 2010, 3:50
/>Page 16 of 16