Introduction to the Cardiovascular System - part 5 pot
Bạn đang xem bản rút gọn của tài liệu. Xem và tải ngay bản đầy đủ của tài liệu tại đây (676.48 KB, 21 trang )
that an increase in venous volume will in-
crease venous pressure. The amount by which
the pressure increases for a given change in
volume depends on the slope of the relation-
ship between the volume and pressure (i.e.,
the compliance). As with arterial vessels (see
Fig. 5-4), the relationship between venous
volume and pressure is not linear (see Fig.
5-10). The slope of the compliance curve
(⌬V/⌬P) is greater at low pressures and vol-
umes than at higher pressures and volumes.
The reason for this is that at very low pres-
sures, a large vein collapses. As the pressure
increases, the collapsed vein assumes a more
cylindrical shape with a circular cross-section.
Until a cylindrical shape is attained, the walls
of the vein are not stretched appreciably.
Therefore, small changes in pressure can re-
sult in a large change in volume by changes in
vessel geometry rather than by stretching the
vessel wall. At higher pressures, when the vein
is cylindrical in shape, increased pressure can
increase the volume only by stretching the
vessel wall, which is resisted by the structure
and composition of the wall (particularly by
collagen, smooth muscle, and elastin compo-
nents). Therefore, at higher volumes and
pressures, the change in volume for a given
change in pressure (i.e., compliance) is less.
The smooth muscle within veins is ordinar-
ily under some degree of tonic contraction.
Like arteries and arterioles, a major factor de-
termining venous smooth muscle contraction
is sympathetic adrenergic stimulation, which
occurs under basal conditions. Changes in
sympathetic activity can increase or decrease
the contraction of venous smooth muscle,
thereby altering venous tone. When this oc-
curs, a change in the volume-pressure rela-
tionship (or compliance curve) occurs, as de-
picted in Figure 5-10. For example, increased
sympathetic activation will shift the compli-
ance curve down and to the right, decreasing
its slope (compliance) at any given volume
(from point A to B in Fig. 5-10). This right-
ward diagonal shift in the venous compliance
curve results in a decrease in venous volume
and an increase in venous pressure. Drugs
that reduce venous tone (e.g., nitrodilators)
will decrease venous pressure while increas-
ing venous volume by shifting the compliance
curve to the left.
The previous discussion emphasized that
venous pressure can be altered by changes in
venous blood volume or in venous compli-
ance. These changes can be brought about by
the factors or conditions summarized in Table
5-2. Central venous pressure is increased by:
1. A decrease in cardiac output. This can re-
sult from decreased heart rate (e.g., brady-
cardia associated with atrioventricular [AV]
nodal block) or stroke volume (e.g., in ven-
tricular failure), which results in blood
backing up into the venous circulation (in-
creased venous volume) as less blood is
pumped into the arterial circulation. The
resultant increase in thoracic blood volume
increases central venous pressure.
2. An increase in total blood volume. This oc-
curs in renal failure or with activation of
the renin-angiotensin-aldosterone system
VASCULAR FUNCTION 105
Volume
Pressure
Increased
Tone
A
B
Shape of vein at different pressures
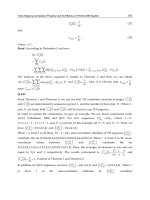
FIGURE 5-10 Compliance curves for a vein. Venous
compliance (the slope of line tangent to a point on the
curve) is very high at low pressures because veins col-
lapse. As pressure increases, the vein assumes a more
circular cross-section and its walls become stretched;
this reduces compliance (decreases slope). Point A is the
control pressure and volume. Point B is the pressure and
volume resulting from increased tone (decreased com-
pliance) brought about, for example, by sympathetic
stimulation of the vein.
Ch05_091-116_Klabunde 4/21/04 11:21 AM Page 105
(see Chapter 6) and leads to an increase in
venous pressure.
3. Venous constriction (reduced venous com-
pliance). Whether elicited by sympathetic
activation or by circulating vasoconstrictor
substances (e.g., catecholamines, an-
giotensin II), venous constriction reduces
venous compliance, thereby increasing
central venous pressure.
4. A shift in blood volume into the thoracic
venous compartment. This shift occurs
when a person changes from standing to a
supine or sitting position and results from
the effects of gravity.
5. Arterial dilation. This occurs during with-
drawal of sympathetic tone or when arterial
vasodilator drugs increase blood flow from
the arterial into the venous compartments,
thereby increasing venous volume and cen-
tral venous pressure.
6. A forceful expiration, particularly against a
high resistance (as occurs with a Valsalva
maneuver). This expiration causes external
compression of the thoracic vena cava as
intrapleural pressure rises.
7. Muscle contraction. Rhythmic muscular
contraction, particularly of the limbs and
abdomen, compresses the veins (which de-
creases their functional compliance) and
forces blood into the thoracic compart-
ment.
Mechanical Factors Affecting
Central Venous Pressure and
Venous Return
Several of the factors affecting central venous
pressure can be classified as mechanical (or
physical) factors. These include gravitational
effects, respiratory activity, and skeletal mus-
cle contraction. Gravity passively alters central
venous pressure and volume, and respiratory
activity and muscle contraction actively pro-
mote or impede the return of blood into the
central venous compartment, thereby altering
central venous pressure and volume.
Gravity
Gravity exerts significant effects on venous re-
turn. When a person changes from supine to a
standing posture, gravity acts on the vascular
volume, causing blood to accumulate in the
lower extremities. Because venous compli-
ance is much higher than arterial compliance,
most of the blood volume accumulates in
veins, leading to venous distension and an el-
evation in venous pressure in the dependent
limbs. The shift in blood volume causes cen-
tral venous volume and pressure to fall. This
reduces right ventricular filling pressure (pre-
load) and stroke volume by the Frank-Starling
mechanism. Left ventricular stroke volume
subsequently falls because of reduced pul-
106 CHAPTER 5
TABLE 5-2 FACTORS INCREASING CENTRAL VENOUS PRESSURE (CVP),
EITHER BY DECREASING VENOUS COMPLIANCE OR BY
INCREASING VENOUS BLOOD VOLUME
CVP INCREASED BY CHANGE IN:
Decreased cardiac output Volume
Increased blood volume Volume
Venous constriction Compliance
Changing from standing to supine body posture Volume
Arterial dilation Volume
Forced expiration (e.g., Valsalva) Compliance
Muscle contraction (abdominal and limb) Volume & Compliance
Ch05_091-116_Klabunde 4/21/04 11:21 AM Page 106
monary venous return to the left ventricle; the
reduced stroke volume causes cardiac output
and arterial blood pressure to decrease. If sys-
temic arterial pressure falls by more than 20
mm Hg upon standing, this is termed ortho-
static or postural hypotension. When this
occurs, cerebral perfusion may fall and a per-
son may become “light headed” and experi-
ence a transient loss of consciousness (syn-
cope). Normally, baroreceptor reflexes (see
Chapter 6) are activated to restore arterial
pressure by causing peripheral vasoconstric-
tion and cardiac stimulation (increased heart
rate and inotropy).
The effects of changes in posture on hydro-
static pressures are illustrated Figure 5-11. In
this model, mean aortic pressure (MAP) and
central venous pressure (CVP) are shown as
reservoirs. The vertical height between these
two reservoirs represents the systemic perfu-
sion pressure. Cardiac output constantly refills
the aortic reservoir as it empties into the sys-
temic circulation. In a horizontal configuration
(Figure 11, Diagram A), mean capillary hydro-
static pressure (P
C
) is some value between
MAP and CVP, typically about 25 mm Hg. If
the horizontal tube (i.e., the vasculature) is ori-
entated vertically (Diagram B), P
C
increases
because of hydrostatic forces. If the vasculature
is rigid (Diagram B), there is no volume shift
between the arterial and venous reservoirs, and
MAP and CVP remain unchanged (as does car-
diac output). However, if the vasculature is
highly compliant (as it actually is), the in-
creased hydrostatic forces increase trans-
mural pressure (intravascular minus extravas-
cular pressure; i.e., the distending pressure)
across the vessel walls and expand the vessels,
particularly the highly compliant veins
(Diagram C). The blood for this venous expan-
VASCULAR FUNCTION 107
Heart
Heart
(A) Supine
(B) Upright
(C) Upright
CVP
CVP
CVP
MAP
MAP
MAP
CO
CO
CO
P
C
P
C
P
C
∆P
∆P
∆P
Heart
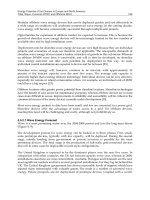
FIGURE 5-11 Effects of gravity on central venous pressure (CVP), cardiac output (CO), and mean arterial pressure
(MAP). Diagram A, supine position. Diagram B: an upright position with rigid vessel results in elevated capillary pres-
sure (P
C
) owing to hydrostatic forces, but no change in CVP, CO, MAP, or systemic perfusion pressure (⌬P). Diagram
C: upright position with compliant vessels; elevated P
C
from hydrostatic pressure owing to gravity distends blood ves-
sels (particularly veins) and increases vascular volume (especially in lower limbs), leading to a fall in CVP, MAP, ⌬P, and
CO.
Ch05_091-116_Klabunde 4/21/04 11:21 AM Page 107
sion comes from the venous and arterial reser-
voirs, thereby decreasing CVP and MAP. The
decrease in CVP decreases cardiac preload and
decrease cardiac output by the Frank-Starling
mechanism. The decreased cardiac output re-
sults in a fall in MAP (decreased reservoir
height). The net effect is reductions in both
MAP and CVP, although quantitatively, the fall
in MAP is 10 to 20 times greater than the fall in
CVP for reasons explained later in this chapter.
Upright posture not only shifts venous
blood volume from the thoracic compartment
to the dependent limbs, but it also results in a
large elevation in capillary pressure in the de-
pendent limbs. When a person is lying down,
there is no appreciable hydrostatic pressure
difference between the level of the heart and
feet. The mean aortic pressure may be 95 mm
Hg, the mean capillary pressure in the feet
may be about 20 mm Hg, and the central ve-
nous pressure near the right atrium may be
near 0 mm Hg. When the person stands up-
right, if no baroreceptor or myogenic reflexes
operate, the mean aortic and central venous
pressures will fall quite significantly. A hydro-
static column equal to the vertical distance
from the heart to the feet will increase capil-
lary pressure in the feet. If the distance from
the heart to the feet is 120 cm, the hydrostatic
pressure exerted on the capillaries in the feet
will be 120 cmH
2
0, which is the equivalent of
88 mm Hg (mercury is 13.6 times denser than
water). Theoretically, this hydrostatic pressure
added to the normal capillary pressure will in-
crease the capillary pressure in the feet to 108
mm Hg! Without the activation of important
compensatory mechanisms, this would rapidly
lead to significant edema in the feet and de-
pendent limbs (see Chapter 8) and loss of in-
travascular blood volume.
The changes depicted in Figure 5-11,
Diagram C, are rapidly compensated in a nor-
mal individual by myogenic vasoconstrictor
mechanisms, sympathetic-mediated vasocon-
striction, venous valve functioning, muscle
pump activity, and the abdominothoracic
pump. When these mechanisms are operat-
ing, capillary and venous pressures in the feet
will be elevated by only 10–20 mm Hg, mean
aortic pressure will be maintained, and central
venous pressure will be only slightly reduced.
Because of these compensatory mechanisms,
a person who is standing has a higher systemic
vascular resistance (primarily owing to sympa-
thetic activation of resistance vessels), de-
creased venous compliance (owing to sympa-
thetic activation of veins), decreased stroke
volume and cardiac output (owing to de-
creased ventricular preload), and increased
heart rate (baroreceptor-mediated tachycar-
dia). The net effect of these changes is main-
tenance of normal mean aortic pressure.
Respiratory Activity (Abdominothoracic
or Respiratory Pump)
Venous return to the right atrium from the ab-
dominal vena cava is determined by the pres-
sure difference between the abdominal vena
cava and the right atrial pressure, as well as by
the resistance to flow, which is primarily de-
termined by the diameter of the thoracic vena
cava. Therefore, increasing right atrial pres-
sure impedes venous return, whereas lower-
ing right atrial pressure facilitates venous re-
turn. These changes in venous return
significantly influence stroke volume through
the Frank-Starling mechanism.
Pressures in the right atrium and thoracic
vena cava depend on intrapleural pressure.
This pressure is measured in the space be-
tween the thoracic wall and the lungs and is
generally negative (subatmospheric). During
inspiration, the chest wall expands and the di-
aphragm descends (red arrows on chest wall
and diaphragm in Figure 5-12). This causes
the intrapleural pressure (P
pl
) to become more
negative, causing expansion of the lungs, atrial
and ventricular chambers, and vena cava
(smaller red arrows). This expansion decreases
the pressures within the vessels and cardiac
chambers. As right atrial pressure falls during
inspiration, the pressure gradient for venous
return to the heart is increased. During expira-
tion the opposite occurs, although the net ef-
fect of respiration is that the increased rate and
depth of ventilation facilitates venous return
and ventricular stroke volume.
Although it may appear paradoxical, the fall
in right atrial pressure during inspiration is as-
sociated with an increase in right atrial and
108 CHAPTER 5
Ch05_091-116_Klabunde 4/21/04 11:21 AM Page 108
ventricular preloads and right ventricular
stroke volume. This occurs because the fall in
intrapleural pressure causes the transmural
pressure to increase across the chamber walls,
thereby increasing the chamber volume,
which increases sarcomere length and myo-
cyte preload. For example, if intrapleural
pressure is normally –4 mm Hg at end-expira-
tion and right atrial pressure is 0 mm Hg, the
transmural pressure (the pressure that dis-
tends the atrial chamber) is 4 mm Hg. During
inspiration, if intrapleural pressure decreases
to –8 mm Hg and atrial pressure decreases to
–2 mm Hg, the transmural pressure across the
atrial chamber increases from 4 mm Hg to 6
mm Hg, thereby expanding the chamber. At
the same time, because blood pressure within
the atrium is diminished, this leads to an in-
crease in venous return to the right atrium
from the abdominal vena cava. Similar in-
creases in right ventricular transmural pres-
sure and preload occur during inspiration.
The increase in sarcomere length during in-
spiration augments right ventricular stroke
volume by the Frank-Starling mechanism. In
addition, changes in intrapleural pressure dur-
ing inspiration influence the left atrium and
ventricle; however, the expanding lungs and
pulmonary vasculature act as a capacitance
reservoir (pulmonary blood volume increases)
so that the left ventricular filling is not en-
hanced during inspiration. During expiration,
however, blood is forced from the pulmonary
vasculature into the left atrium and ventricle,
thereby increasing left ventricular filling and
stroke volume. Expiration, in contrast, de-
creases right atrial and ventricular filling. The
net effect of respiration is that increasing the
rate and depth of respiration increases venous
return and cardiac output.
If a person exhales forcefully against a
closed glottis (Valsalva maneuver), the large
increase in intrapleural pressure impedes ve-
nous return to the right atrium (see Valsalva
Maneuver on CD). This occurs because the
large increase in intrapleural pressure can col-
lapse the thoracic vena cava, which dramati-
cally increases resistance to venous return.
Because of the accompanying decrease in
transmural pressure across the ventricular
chamber walls, ventricular volume decreases
despite the large increase in the pressure
within the chamber. Decreased chamber vol-
ume (i.e., decreased preload) leads to a fall in
ventricular stroke volume by the Frank-
Starling mechanism. Similar changes can oc-
cur when a person strains while having a
bowel movement, or when a person lifts a
heavy weight while holding their breath.
Skeletal Muscle Pump
Veins, particularly in extremities, contain one-
way valves that permit blood flow toward the
heart and prevent retrograde flow. Deep veins
VASCULAR FUNCTION 109
-4
-8
0
-2
Venous
Return
Inspiration Expiration
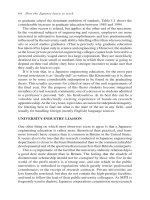
FIGURE 5-12 Effects of respiration on venous return. Left panel: During inspiration, intrapleural pressure (P
pl
) de-
creases as the chest wall expands and the diaphragm descends (large red arrows). This increases the transmural pres-
sure across the superior and inferior vena cava (SVC and IVC), right atrium (RA), and right ventricle (RV), which causes
them to expand. This facilitates venous return and leads to an increase in atrial and ventricular preloads. Right panel:
During inspiration, P
pl
and right atrial pressure (P
RA
) become more negative, which increases venous return. During
expiration, P
pl
and P
RA
become less negative and venous return falls. Numeric values for P
pl
and P
RA
are expressed as
mm Hg.
Ch05_091-116_Klabunde 4/21/04 11:21 AM Page 109
in the lower limbs are surrounded by large
groups of muscle that compress the veins
when the muscles contract. This compression
increases the pressure within the veins, which
closes upstream valves and opens downstream
valves, thereby functioning as a pumping
mechanism (Fig. 5-13). This pumping mecha-
nism plays a significant role in facilitating ve-
nous return during exercise. The muscle
pump also helps to counteract gravitational
forces when a person stands up by facilitating
venous return and lowering venous and capil-
lary pressures in the feet and lower limbs.
When the venous valves become incompe-
tent, as occurs when veins become enlarged
(varicose veins), muscle pumping becomes in-
effective. Besides the loss of muscle pumping
in aiding venous return, blood volume and
pressure increase in the veins of the depen-
dent limbs, which increases capillary pressure
and may cause edema (see Chapter 8).
VENOUS RETURN AND CARDIAC
OUTPUT
The Balance between Venous
Return and Cardiac Output
Venous return is the flow of blood back to the
heart. Previous sections described how the ve-
nous return to the right atrium from the ab-
dominal vena cava is determined by the pres-
sure gradient between the abdominal vena
cava and the right atrium, divided by the re-
sistance of the vena cava. However, that analy-
sis looks at only a short segment of the venous
system and does not show what factors deter-
mine venous return from the capillaries.
Venous return is determined by the difference
between the mean capillary and right atrial
pressures divided by the resistance of all the
post-capillary vessels. If we consider venous
return as being all the systemic flow returning
to the heart, venous return is determined by
the difference between the mean aortic and
right atrial pressures divided by the systemic
vascular resistance. Under steady-state condi-
tions, this venous return equals cardiac output
when averaged over time because the cardio-
vascular system is essentially a closed system.
(The cardiovascular system, strictly speaking,
is not a closed system because fluid is lost
through the kidneys and by evaporation
through the skin, and fluid enters the circula-
tion through the gastrointestinal tract.
Nevertheless, a balance is maintained be-
tween fluid entering and leaving the circula-
tion during steady-state conditions. There-
fore, think of cardiac output and venous
return as being equal.)
Systemic Vascular Function Curves
Blood flow through the entire systemic circu-
lation, whether viewed as the flow leaving the
heart (cardiac output) or returning to the
heart (venous return), depends on both car-
diac and systemic vascular function. As de-
scribed in more detail below, cardiac output
under normal physiologic conditions depends
on systemic vascular function. Cardiac output
is limited to a large extent by the prevailing
state of systemic vascular function. Therefore,
it is important to understand how changes in
systemic vascular function affect cardiac out-
put and venous return (or total systemic blood
flow because cardiac output and venous re-
turn are equal under steady-state conditions).
The best way to show how systemic vascu-
lar function affects systemic blood flow is by
use of systemic vascular and cardiac function
curves. Credit for the conceptual understand-
ing of the relationship between cardiac output
110 CHAPTER 5
Relaxed
Contracted
FIGURE 5-13 Rhythmic contraction of skeletal muscle
compresses veins, particularly in the lower limbs, and
propels blood toward the heart through a system of
one-way valves.
Ch05_091-116_Klabunde 4/21/04 11:21 AM Page 110
and systemic vascular function goes to Arthur
Guyton and colleagues, who conducted exten-
sive experiments in the 1950s and 1960s. To
develop the concept of systemic vascular func-
tion curves, we must understand the relation-
ship between cardiac output, mean aortic, and
right atrial pressures. Figure 5-14 shows that
at a cardiac output of 5 L/min, the right atrial
pressure is near zero and mean aortic pressure
is about 95 mm Hg. If cardiac output is re-
duced experimentally, right atrial pressure in-
creases and mean aortic pressure decreases.
The fall in aortic pressure reflects the rela-
tionship between mean aortic pressure, car-
diac output, and systemic vascular resistance
(see Equation 5-2). As cardiac output is re-
duced to zero, right atrial pressure continues
to rise and mean aortic pressure continues to
fall, until both pressures are equivalent, which
occurs when systemic blood flow ceases. The
pressure at zero systemic flow, which is called
the mean circulatory filling pressure, is
about 7 mm Hg. This value is found experi-
mentally when baroreceptor reflexes are
blocked; otherwise the value for mean circula-
tory filling pressure is higher because of vas-
cular smooth muscle contraction and de-
creased vascular compliance owing to
sympathetic activation.
The reason right atrial pressure increases
in response to a decrease in cardiac output is
that less blood per unit time is translocated by
the heart from the venous to the arterial vas-
cular compartment. This leads to a reduction
in arterial blood volume and an increase in ve-
nous blood volume, which increases right
atrial pressure. When the heart is completely
stopped and there is no flow in the systemic
circulation, the intravascular pressure found
throughout the entire vasculature is a function
of total blood volume and vascular compli-
ance.
The magnitude of the relative changes in
aortic and right atrial pressures from a normal
cardiac output to zero cardiac output is deter-
mined by the ratio of venous to arterial com-
pliances. If venous compliance (C
V
) equals the
change in venous volume (⌬V
V
) divided by the
change in venous pressure (⌬P
V)
, and arterial
compliance (C
A
) equals the change in arterial
volume (⌬V
A
) divided by the change in arte-
rial pressure (⌬P
A
), the ratio of venous to ar-
terial compliance (C
V
/C
A
) can be expressed by
the following equation:
ᎏ
C
C
A
V
ᎏ
ϭ
When the heart is stopped, the decrease in
arterial blood volume (⌬V
A
) equals the in-
crease in venous blood volume (⌬V
V
).
Because ⌬V
A
equals ⌬V
V
, Equation 5-11 can
be simplified to the following relationship:
ᎏ
C
C
A
V
ᎏ
∝
ᎏ
⌬
⌬
P
P
A
V
ᎏ
Equation 5-12 shows that the ratio of ve-
nous to arterial compliance is proportional to
the ratio of the changes in arterial to venous
pressures when the heart is stopped. This ra-
tio is usually in the range of 10–20. If, for ex-
ample, the ratio of venous to arterial compli-
ance is 15, there is a 1 mm Hg increase in
right atrial pressure for every 15 mm Hg de-
crease in mean aortic pressure.
If the right atrial pressure curve from
Figure 5-14 is plotted as cardiac output versus
right atrial pressure (i.e., reversing the axis),
⌬V
V
/
⌬P
V
ᎏ
⌬V
A
/
⌬P
A
VASCULAR FUNCTION 111
Mean
Aortic
Pressure
Right
Atrial
Pressure
5
0
0
50
100
Pressure (mmHg)
P
mc
FIGURE 5-14 Effects of cardiac output on mean aortic
and right atrial pressures. Decreasing cardiac output to
zero results in a rise in right atrial pressure and a fall in
aortic pressure. Both pressures equilibrate at the mean
circulatory filling pressure (Pmc).
Eq. 5-11
Eq. 5-12
Ch05_091-116_Klabunde 4/21/04 11:21 AM Page 111
the relationship shown in Figure 5-15 (black
curve in both panels) is observed. This curve
is called the systemic vascular function
curve. This relationship can be thought of as
either the effects of cardiac output on right
atrial pressure (cardiac output being the inde-
pendent variable) or the effect of right atrial
pressure on venous return (right atrial pres-
sure being the independent variable). When
viewed from the latter perspective, systemic
vascular function curves are sometimes called
venous return curves.
The value of the x-intercept in Figure 5-15
is the mean circulatory filling pressure, or the
pressure throughout the vascular system when
there is no blood flow. This value depends on
the vascular compliance and blood volume
(Fig. 5-15, Panel A). Increased blood volume
or decreased venous compliance causes a par-
allel shift of the vascular function curve to the
right, which increases mean circulatory filling
pressure. Decreased blood volume or in-
creased venous compliance causes a parallel
shift to the left and a decrease in the mean cir-
culatory filling pressure.
Decreased systemic vascular resistance in-
creases the slope without appreciably chang-
ing mean circulatory filling pressure (Fig.
5-15, Panel B). Increased systemic vascular
resistance decreases the slope while keeping
the same mean circulatory filling pressure.
Therefore, at a given cardiac output, a de-
crease in systemic vascular resistance in-
creases right atrial pressure, whereas an in-
crease in systemic vascular resistance
decreases right atrial pressure. These changes
can be difficult to conceptualize, but the fol-
lowing explanation might help to clarify.
When the small resistance vessels dilate, sys-
temic vascular resistance decreases. If the car-
diac output remains constant, arterial pres-
sure and arterial blood volume must decrease.
Arterial blood volume shifts over to the ve-
nous side of the circulation, and the increase
in venous volume increases the right atrial
pressure. Changes in systemic vascular resis-
tance have little effect on mean circulatory
filling pressure because the rather small
changes in arterial diameter required to pro-
duce large changes in resistance have little af-
fect on overall vascular compliance, which is
overwhelmingly determined by venous com-
pliance.
Cardiac Function Curves
According to the Frank-Starling relationship,
an increase in right atrial pressure increases
cardiac output. This relationship can be de-
picted using the same axis as used in systemic
function curves in which cardiac output (de-
pendent variable) is plotted against right atrial
112 CHAPTER 5
↑Vol
5
10
Cardiac Output (L/min)
P
mc
P
mc
P (mmHg)
RA
P
RA
(mmHg)
10
0
0
0
↓Vol
↓SVR
↑SVR
↓C
v
↑Cv
A
B
10
FIGURE 5-15 Systemic function curves. Panel A shows the effects of changes in cardiac output on right atrial pres-
sure (P
RA
) and mean circulatory filling pressures (Pmc) at different blood volumes (Vol) and venous compliances (Cv).
Panel B shows how changes in systemic vascular resistance (SVR) affect the systemic function curves.
Ch05_091-116_Klabunde 4/21/04 11:21 AM Page 112
pressure (independent variable) (Fig.
5-16). These curves are similar to the Frank-
Starling curves shown in Figure 4-9. There is
no single cardiac function curve, but rather a
family of curves that depends on the inotropic
state and afterload (see Chapter 4). Changes
in heart rate also shift the cardiac function
curve because cardiac output, not stroke vol-
ume as in Figure 4-9, is the dependent vari-
able. With a “normal” function curve, the car-
diac output is about 5 L/min at a right atrial
pressure of about 0 mm Hg. If cardiac perfor-
mance is enhanced by increasing heart rate or
inotropy or by decreasing afterload, it shifts
the cardiac function curve up and to the left.
At the same right atrial pressure of 0 mm Hg,
the cardiac output will increase. Conversely, a
depressed cardiac function curve, as occurs
with decreased heart rate or inotropy or with
increased afterload, will decrease the cardiac
output at any given right atrial pressure.
However, the magnitude by which cardiac
output changes when cardiac performance is
altered is determined in large part by the state
of systemic vascular function. Therefore, it is
necessary to examine both cardiac and system
vascular function at the same time.
Interactions between Cardiac and
Systemic Vascular Function Curves
By themselves, systemic vascular function and
cardiac function curves provide an incomplete
picture of overall cardiovascular dynamics;
however, when coupled together, these curves
can offer a new understanding as to the way
cardiac and vascular function are coupled.
When the cardiac function and vascular
function curves are superimposed (Fig.
5-17), a unique intercept between a given car-
diac and a given vascular function curve (point
A) exists. This intercept is the equilibrium
point that defines the relationship between
cardiac and vascular function. The heart func-
tions at this equilibrium until one or both
curves shift. For example, if the sympathetic
nerves to the heart are stimulated to increase
heart rate and inotropy, only a small increase
in cardiac output will occur, accompanied by a
small decrease in right atrial pressure (point
B). If at the same time the venous compliance
is decreased by sympathetic activation of ve-
nous vasculature, cardiac output will be
greatly augmented (point C). If the decrease
in venous compliance is accompanied by a de-
crease in systemic vascular resistance, cardiac
output would be further enhanced (point D).
These changes in venous compliance and sys-
temic vascular resistance, which occur during
exercise, permit the cardiac output to in-
crease. This example shows that for cardiac
output to increase significantly during cardiac
stimulation, there must be some alteration in
vascular function so that venous return is aug-
mented and right atrial pressure (ventricular
filling) is maintained. Therefore, in the normal
heart, cardiac output is limited by factors that
determine vascular function.
In pathologic conditions such as heart fail-
ure, cardiac function limits venous return. In
heart failure, ventricular inotropy is lost; total
blood volume is increased; and afterload is in-
creased (see Chapter 9). The former two lead
to an increase in atrial and ventricular pres-
sures and volumes (increased preload), which
enables the Frank-Starling mechanism to par-
tially compensate for the loss of inotropy. These
changes during heart failure can be
VASCULAR FUNCTION 113
0
10
0
5
10
P (mmHg)
RA
Cardiac
Output
(L/min)
Normal
Depressed
Enhanced
FIGURE 5-16 Cardiac function curves. Cardiac output is
plotted as a function of right atrial pressure (P
RA
); nor-
mal (solid black), enhanced (red) and depressed (red)
curves are shown. Cardiac performance, measured as
cardiac output, is enhanced (curves shift up and to the
left) by an increase in heart rate and inotropy and a de-
crease in afterload.
Ch05_091-116_Klabunde 4/21/04 11:21 AM Page 113
depicted using cardiac and systemic function
curves as shown in Figure 5-18. In this figure,
point A represents the operating point in a nor-
mal heart, and point B indicates where a heart
might operate when it is in failure in the ab-
sence of systemic compensation—cardiac out-
put would be greatly reduced and right atrial
pressure would be elevated. Compensatory in-
creases in blood volume and systemic vascular
resistance, along with reduced venous compli-
ance, shift the systemic function to the right
and decrease the slope. The new, combined in-
tercept (point C) represents a partial compen-
sation in the cardiac output at the expense of a
large increase in right atrial pressure. The in-
creased atrial pressure helps to support ven-
tricular preload and stroke volume through the
Frank-Starling mechanism.
In summary, total blood flow through the
systemic circulation (cardiac output or venous
114 CHAPTER 5
V
0
10
0
5
10
15
P (mmHg)
RA
Cardiac
Output
(L/min)
A
B
C
D
↓C
V
↓C&
↓SVR
Cardiac
Stimulation
Normal
Cardiac
Function
FIGURE 5-17 Combined cardiac and systemic function curves: effects of exercise. Cardiac output is plotted against
right atrial pressure (P
RA
) to show the effects of altering both cardiac and systemic function. Point A represents the
normal operating point described by the intercept between the normal cardiac and systemic function curves. Cardiac
stimulation alone changes the intercept from point A to B. Cardiac stimulation coupled with decreased venous com-
pliance (C
V
) (or increased venous volume) shifts the operating intercept to point C. If systemic vascular resistance (SVR)
also decreases, which is similar to what occurs during exercise, the new intercept becomes point D.
010
0
5
10
P (mmHg)
RA
Carduac Output (L/min)
A
B
C
Cardiac
Failure
20 30
↑
↓
↑
Vol
Cv
SVR
FIGURE 5-18 Combined cardiac and systemic function curves: effects of chronic heart failure. The normal operating
intercept (point A) is shifted to point B when cardiac function alone is depressed by loss of inotropy. Compensatory
increases in total blood volume (Vol) and systemic vascular resistance (SVR), along with reduced venous compliance
(C
V
), shifts the systemic function to the right and decreases the slope. The new combined intercept (point C) repre-
sents partial compensation in cardiac output at the expense of a large increase in right atrial pressure (P
RA
).
Ch05_091-116_Klabunde 4/21/04 11:21 AM Page 114
return) depends on both cardiac and systemic
vascular function. Cardiac stimulation in a
normal heart has only a modest effect on car-
diac output; however, if systemic function is
additionally altered by decreasing venous
compliance and systemic vascular resistance,
the cardiac output is able to increase. Without
changes in systemic function, cardiac output is
limited by the return of blood to the heart and
ventricular filling.
SUMMARY OF IMPORTANT
CONCEPTS
• Regulation of arterial pressure and organ
blood flow is primarily the function of the
small arteries and arterioles. Capillaries are
the principal site for exchange because
they have the greatest surface area.
Furthermore, capillaries have the lowest
velocity of flow because they have the
greatest cross-sectional area. Most of the
blood volume is found in the venous circu-
lation, which serves a capacitance function
(it acts as a blood reservoir) within the
body.
• Aortic pulse pressure is primarily deter-
mined by ventricular stroke volume and
aortic compliance.
• Mean arterial pressure is determined by
the product of cardiac output and systemic
vascular resistance, plus central venous
pressure.
• Vascular resistance is inversely related to
the vessel radius to the fourth power, and it
is directly related to vessel length and
blood viscosity. Vessel radius is the most
important factor for regulating resistance.
• The parallel arrangement of vascular beds
in the body reduces overall resistance.
Furthermore, because of this arrangement,
a resistance change in one vascular bed has
minimal influence on pressure and flow in
other vascular beds.
• The resistance of a single vessel or group of
vessels is the perfusion pressure divided by
the blood flow.
• Changes in large artery resistance have lit-
tle effect on total resistance of a vascular
bed, whereas changes in small artery and
arteriolar resistances greatly affect total re-
sistance. The reason for this is that the re-
sistance of a large artery is normally only a
small percentage of the total resistance of a
vascular bed.
• Arterial and venous vessels are normally in
a partially constricted state (i.e., they pos-
sess vascular tone), which is determined by
the net effect of vasoconstrictor and va-
sodilator influences acting upon the vessel.
• Central venous pressure is important be-
cause it determines the preload on the
heart. Central venous pressure is altered by
changes in venous blood volume and ve-
nous compliance. Gravity, respiratory activ-
ity, and the pumping action of rhythmically
contracting skeletal muscle have important
influences on central venous pressure.
• Cardiac output is strongly influenced by
changes in systemic vascular function as
described by cardiac and systemic vascular
function curves. In the normal heart, car-
diac output is limited by factors that deter-
mine vascular function.
Review Questions
Please refer to the appendix for the answers
to the review questions.
For each question, choose the one best
answer:
1. Concerning different types of blood ves-
sels in a vascular network,
a. Arterioles have the highest individ-
ual resistance, and therefore, as a
group of vessels, have the greatest
pressure drop.
b. Capillaries as a group of vessels con-
stitute the greatest resistance to flow
within an organ.
c. Capillaries and venules are the pri-
mary site for fluid exchange.
d. Large arteries are the most impor-
tant vessels for blood flow and pres-
sure regulation.
2. Arterial pulse pressure
a. Decreases at high heart rates if
stroke volume decreases.
VASCULAR FUNCTION 115
Ch05_091-116_Klabunde 4/28/04 10:19 AM Page 115
b. Decreases when cardiac inotropy is
increased.
c. Increases when aortic compliance is
increased with age.
d. Is the perfusion pressure for the sys-
temic circulation.
3. A patient who has coronary artery dis-
ease is treated with a drug that reduces
heart rate by 10% without changing
stroke volume. Furthermore, the drug is
found to decrease mean arterial pressure
by 10%. Assume that central venous
pressure remains at 0 mmHg. This drug
a. Decreases systemic vascular resis-
tance by 10%.
b. Does not alter cardiac output.
c. Does not alter systemic vascular re-
sistance.
d. Reduces pressure by dilating the
systemic vasculature.
4. Which of the following will increase
blood flow to the greatest extent in a sin-
gle isolated blood vessel?
a. Decreasing the blood temperature
by 10°C
b. Increasing perfusion pressure by
100%
c. Increasing blood viscosity by 100%
d. Increasing the vessel diameter by
50%
5. If cardiac output is 4500 mL/min, mean
arterial pressure is 94 mm Hg, and right
atrial pressure is 4 mm Hg, systemic vas-
cular resistance (in peripheral resistance
units, PRU; mm Hg/ml • min
-1
) is:
a. 0.02
b. 20
c. 50
d. 4.05 ϫ 10
5
6. If the renal artery supplying blood flow
to the kidney has its internal diameter
reduced by 50%, the blood flow to the
kidney will decrease by what amount?
Assume that renal artery resistance is 1%
of total renal resistance and that there is
no autoregulation.
a. 50%
b. Less than 20%
c. 8-fold
d. 16-fold
8. Central venous pressure is increased by
a. Forcefully exhaling against a closed
glottis.
b. Increasing cardiac output.
c. Increasing venous compliance.
d. Standing.
8. Venous return to the right atrium is
a. Decreased as cardiac output in-
creases.
b. Decreased by sympathetic activation
of veins.
c. Increased during a forced expiration
against a closed glottis.
d. Increased during inspiration.
9. Mean circulatory filling pressure is in-
creased by
a. Decreased venous compliance.
b. Increased systemic vascular resis-
tance.
c. Decreased blood volume.
d. Increased cardiac output.
10. In a normal heart, cardiac output and
right atrial pressure are both increased
by
a. Decreased blood volume.
b. Decreased systemic vascular resis-
tance.
c. Increased heart rate.
d. Increased venous compliance.
SUGGESTED READINGS
Berne RM, Levy MN. Cardiovascular Physiology. 8th
Ed. Philadelphia: Mosby, 2001.
Guyton AC, Jones CE, Coleman TG. Circulatory
Physiology: Cardiac Output and its Regulation. 2nd
Ed. Philadelphia: W.B. Saunders, 1973.
Mulvany MJ. Small artery remodeling and significance in
the development of hypertension. News Physiol Sci
2002;17:105–109.
Rhoades RA, Tanner GA. Medical Physiology. 2nd Ed.
Philadelphia: Lippincott Williams & Wilkins, 2003.
116 CHAPTER 5
Ch05_091-116_Klabunde 4/28/04 10:19 AM Page 116
LEARNING OBJECTIVES
INTRODUCTION
AUTONOMIC NEURAL CONTROL
Autonomic Innervation of the Heart
and Vasculature
Baroreceptor Feedback Regulation
of Arterial Pressure
Chemoreceptors
Other Autonomic Reflexes Affecting
the Heart and Circulation
HUMORAL CONTROL
Circulating Catecholamines
Renin-Angiotensin-Aldosterone
System
Atrial Natriuretic Peptide
Vasopressin (Antidiuretic Hormone)
SUMMARY OF NEUROHUMORAL
MECHANISMS
SUMMARY OF IMPORTANT CONCEPTS
REVIEW QUESTIONS
SUGGESTED READINGS
chapter
6
Neurohumoral Control of the Heart
and Circulation
LEARNING OBJECTIVES
Understanding the concepts presented in this chapter will enable the student to:
1. Describe the roles of the following regions of the brain in the autonomic regulation of car-
diac and vascular function: medullary “cardiovascular centers,” hypothalamus, and cortex.
2. Describe the origin and distribution of sympathetic and parasympathetic nerves to the
heart and circulation.
3. Know the location and function of alpha- and beta-adrenoceptors and muscarinic receptors
in the heart and blood vessels.
4. Describe the effects of sympathetic and parasympathetic stimulation on the heart and cir-
culation.
5. Describe the location and afferent connections from the carotid sinus, aortic arch, and car-
diopulmonary baroreceptors to the medulla oblongata.
6. Describe how carotid sinus baroreceptors respond to changes in arterial pressure (mean
pressure and pulse pressure), and explain how changes in baroreceptor activity affect sym-
pathetic and parasympathetic outflow to the heart and circulation.
7. Describe (a) the location of peripheral and central chemoreceptors; (b) the way they re-
spond to hypoxemia, hypercapnia, and acidosis; and (c) the effects of their stimulation on
autonomic control of the heart and circulation.
8. List the factors that stimulate the release of catecholamines, renin, atrial natriuretic pep-
tide, and vasopressin.
9. Describe how sympathetic nerves, circulating catecholamines, angiotensin II, aldosterone,
atrial natriuretic peptide, and vasopressin interact to regulate arterial blood pressure.
117
Ch06_117-140_Klabunde 4/21/04 11:26 AM Page 117
within the medulla of the brainstem (see Figs.
6-1 and 6-2). These cell bodies are found in
collections of neurons called the dorsal vagal
nucleus and nucleus ambiguous. Electrical
stimulation of these nuclei produces bradycar-
dia; therefore, these regions of the medulla
are sometimes referred to as the “cardioin-
hibitory center.” Under normal resting condi-
tions, these neurons are tonically active,
thereby producing what is termed “vagal
tone” on the heart, resulting in resting heart
rates significantly below the intrinsic firing
rate of the sinoatrial pacemaker. Afferent
nerves, particularly from peripheral barore-
ceptors that enter the medulla through the
NTS, modulate the activity of these vagal neu-
rons. Excitatory interneurons from the NTS,
which normally are excited by tonic barore-
ceptor activity, stimulate vagal activity. In ad-
dition, efferent fibers from the hypothalamus
modulate the vagal neurons.
Efferent vagal fibers (also referred to as
preganglionic fibers) exit the medulla as the
tenth cranial nerve and travel to the heart
within the left and right vagus nerves.
Branches from these nerves innervate specific
regions within the heart such as the sinoatrial
and atrioventricular nodes, conduction path-
ways, myocytes, and the coronary vasculature.
The preganglionic efferent fibers synapse
within or near the target tissue and form small
ganglia, from which short postganglionic
fibers innervate specific tissue sites.
Activation of these postganglionic fibers
causes the release of the neurotransmitter
acetylcholine. This neurotransmitter binds to
NEUROHUMORAL CONTROL OF THE HEART AND CIRCULATION 119
Higher Centers
Hypothalamus
Vagal
Symp
–
–
–
+
+
Receptor
Afferents
Heart
Blood Vessels
Medulla
NTS
+
FIGURE 6-2 Schematic representation of autonomic sympathetic (Symp) and vagal interconnections within the cen-
tral nervous system. Receptor afferent nerve fibers (e.g., from baroreceptors) enter the medulla at the nucleus trac-
tus solitarius (NTS), which projects inhibitory interneurons to the sympathetic neurons and excitatory fibers to the va-
gal neurons. The medulla receives input from the hypothalamus and higher brain centers. Sympathetic activation (ϩ)
of blood vessels and the heart causes smooth muscle contraction (vasoconstriction), increased heart rate (positive
chronotropy), increased conduction velocity within the heart (positive dromotropy), and increased contractility (posi-
tive inotropy). Vagal activation of the heart decreases (Ϫ) chronotropy, dromotropy, and inotropy.
Ch06_117-140_Klabunde 4/21/04 11:26 AM Page 119
muscarinic receptors (M
2
), which decreases
chronotropy, dromotropy, and inotropy (more
so in the atria than in the ventricles), and di-
lates the coronary vasculature (Table 6-1 and
Figure 6-3).
The right vagus is usually the primary vagal
branch that innervates the sinoatrial (SA)
node, whereas the left vagus primarily inner-
vates the atrioventricular (AV) node and the
ventricular conduction system. This can be
120 CHAPTER 6
TABLE 6-1 EFFECTS OF SYMPATHETIC AND PARASYMPATHETIC
STIMULATION ON CARDIAC AND VASCULAR FUNCTION
SYMPATHETIC PARASYMPATHETIC
Heart
Chronotropy (rate) + + + – – –
Inotropy (contractility) + + + – 1
Dromotropy (conduction velocity) + + – – –
Vessels (Vasoconstriction)
Resistance (arteries, arterioles) + + + – 2
Capacitance (veins, venules) + + + 0
Relative magnitude of responses (ϩ, increase; Ϫ, decrease; 0, no response) indicated by number of ϩ or Ϫ signs.
1
More pronounced in atria than ventricles.
2
Vasodilator effects only in specific organs such as genitalia.
Inotropy
Chronotropy
Dromotropy
Sympathetic
Nerve Terminal
ACh
NE
NE
NE
Vasoconstriction
Vasodilation
Parasympathetic
Nerve Terminal
α
1
M
2
M
2
M
2
α
2
α
2
α
2
α
1
β
1
β
2
β
2
β
2
_
_
_
_
Blood VesselHeart
FIGURE 6-3 Adrenergic and muscarinic receptors in the heart and blood vessels. Norepinephrine (NE) released from
sympathetic nerve terminals binds to postjunctional adrenoceptors in the heart (subtype affinity to NE: 
1
>>
2
and
␣
1
) to produce positive inotropy, chronotropy, and dromotropy. In blood vessels, NE binds to postjunctional adreno-
ceptors (subtype affinity to NE: ␣
1
>>␣
2
and 
2
). NE binding to postjunctional ␣-adrenoceptors causes vasoconstric-
tion, whereas binding to 
2
-adrenoceptors causes vasodilation. In both cardiac and vascular tissue, prejunctional ␣
2
-
adrenoceptors inhibit NE release, and prejunctional 
2
-adrenoceptors enhance NE release. Parasympathetic (vagal)
nerves in the heart release acetylcholine (ACh), which binds to prejunctional muscarinic receptors (M
2
) to inhibit NE
release. ACh also binds to postjunctional M
2
receptors to decrease inotropy, chronotropy, and dromotropy. In a few
specific organs (e.g., genitalia), ACh released by parasympathetic nerves binds to vascular M
2
receptors to produce
endothelial-dependent vasodilation.
Ch06_117-140_Klabunde 4/21/04 11:26 AM Page 120
demonstrated experimentally by electrically
stimulating the right vagus nerve, which
causes bradycardia (or SA nodal arrest) with
little change in AV nodal conduction, as evi-
denced by a relatively small increase in the P-
R interval of the electrocardiogram. Left vagal
stimulation, in contrast, usually results in a
pronounced AV nodal block (see Chapter 2),
with relatively little decrease in heart rate.
However, these responses to vagal stimulation
can be markedly different between individu-
als because of crossover of the left and right
vagal efferents.
Some efferent parasympathetic fibers in-
nervate blood vessels in specific organs in
which they directly or indirectly cause vasodi-
lation. Direct vasodilation by parasympathetic
activation in some tissues (e.g., genitalia erec-
tile tissue) is achieved through the release of
acetylcholine, which binds to muscarinic re-
ceptors on the vascular endothelium to cause
vasodilation through the subsequent forma-
tion of nitric oxide (see Chapter 3).
Parasympathetic stimulation causes indirect
vasodilation in some organs (e.g., gastroin-
testinal circulation) by stimulating non-vascu-
lar tissue to produce vasodilator substances
such as bradykinin, which then binds to vas-
cular receptors to cause vasodilation. Note
that any existing parasympathetic nerves pri-
marily serve to regulate blood flow within spe-
cific organs rather than to play a significant
role in the regulation of systemic vascular re-
sistance and arterial blood pressure.
Sympathetic Innervation
The sympathetic adrenergic control of the
heart and vasculature originates from neurons
found within the medulla. These neurons are
not organized into distinct nuclei, but instead
make up a less defined but highly complex sys-
tem of interconnected neurons. Electrical
stimulation of certain regions within the
medulla produce tachycardia and systemic
vasoconstriction; therefore, terms such as
“cardiostimulatory centers” and “pressor” and
“vasoconstrictor centers” are sometimes used
to describe these neuronal networks.
Sympathetic neurons have spontaneous action
potential activity, which results in tonic stimu-
lation of the heart and vasculature. Therefore,
acute sympathetic denervation of the heart
and systemic blood vessel usually results in
bradycardia and systemic vasodilation. At low
resting heart rates, the effects of sympathetic
denervation on the heart rate are relatively
small because the heart is under a high level
of vagal tone. In contrast, sympathetic tone is
relatively high in most organ circulations;
therefore, sudden removal of sympathetic
tone produces significant vasodilation and hy-
potension.
Parasympathetic activity within the
medulla normally inhibits sympathetic activ-
ity, and vice versa. Therefore, reciprocal acti-
vation of the medullary centers controlling va-
gal and sympathetic outflow generally occurs.
An example of this reciprocity occurs when a
person stands up and arterial blood pressure
falls. Baroreceptor reflexes cause the
medullary centers to increase sympathetic
outflow to stimulate the heart (increase heart
rate and inotropy) and to constrict the sys-
temic vasculature. These cardiac and vascular
responses help to restore normal arterial pres-
sure. As sympathetic fibers are being acti-
vated, parasympathetic activity is decreased.
This is important because without removal of
vagal influences on the heart, the ability of en-
hanced sympathetic activity to increase heart
rate is impaired.
Regions within the hypothalamus can inte-
grate and coordinate cardiovascular responses
by providing input to medullary centers.
Studies have shown that electrical stimulation
of specific hypothalamic regions produces au-
tonomic responses that mimic those that oc-
cur during exercise, or the flight-or-fight re-
sponse. These coordinated responses include
sympathetic-mediated tachycardia, increased
inotropy, catecholamine release, and systemic
vasoconstriction.
Input from higher cortical regions can alter
autonomic function as well. For example, sud-
den fear or emotion can sometimes cause va-
gal activation leading to bradycardia, with-
drawal of sympathetic vascular tone, and
fainting (vasovagal syncope). Fear and anxi-
ety can lead to sympathetic activation that
causes tachycardia, increased inotropy, and
NEUROHUMORAL CONTROL OF THE HEART AND CIRCULATION 121
Ch06_117-140_Klabunde 4/21/04 11:26 AM Page 121
hypertension. Chronic sympathetic activation
induced by long-term emotional stress can re-
sult in sustained hypertension, cardiac hyper-
trophy, and arrhythmias.
Axons from sympathetic neurons (also
termed preganglionic fibers) leave the
medulla, travel down the spinal cord, and exit
at specific thoracolumbar levels (T1–L2).
These fibers then synapse within sympathetic
paravertebral ganglia (cervical, stellate,
and thoracolumbar sympathetic chain) lo-
cated on either side of the spinal cord, or they
synapse within prevertebral ganglia located
within the abdomen (celiac, superior mesen-
teric, and inferior mesenteric ganglia) (Fig.
6-4). Postganglionic sympathetic fibers travel
to target organs where they innervate arteries
and veins; capillaries are not innervated. Small
branches of these efferent nerves are found in
the adventitia (outer) layer of blood vessels.
Varicosities, which are small enlargements
along the sympathetic nerve fibers, provide
the site of neurotransmitter release.
Postganglionic sympathetic fibers traveling
to the heart innervate the sinoatrial and atrio-
ventricular nodes, conduction system, and
cardiac myocytes, as well as the coronary vas-
culature. Sympathetic activation increases
122 CHAPTER 6
Heart
Blood
Vessels
Cervical
Thoracic
Lumbar
T1
T12
Paravertebral
Ganglia
Prevertebral
Ganglia
Cranial Nerve X
(vagus)
A
B
C
D
FIGURE 6-4 Organization of sympathetic and vagal innervation of the heart and circulation. The tenth cranial nerve
(vagus; parasympathetic) arises from the brainstem. Preganglionic fibers (solid red line, A) travel to the heart, where
they synapse with cell bodies of short postganglionic fibers that innervate the heart. Preganglionic sympathetic nerves
(solid black lines) arise from thoracic (T1–T12) and lumbar segments of the spinal cord. Some of these fibers (B) en-
ter the paravertebral ganglia (sympathetic chain) on both sides of the spinal cord, and travel within the ganglia to
synapse above (B) or below their entry level, or at their level of entry (C). Postganglionic fibers (dotted black lines)
from the cervical ganglia primarily innervate the heart, whereas those from thoracic ganglia travel to blood vessels
and to the heart. Preganglionic fibers from lower thoracic and upper lumbar segments generally synapse in prever-
tebral ganglia (D), from which postganglionic fibers travel to blood vessels.
Ch06_117-140_Klabunde 4/21/04 11:26 AM Page 122
nucleus tractus solitarius. The nucleus tractus
solitarius modulates the activity of “cardiovas-
cular centers” within the medulla. The aortic
arch baroreceptors are innervated by the aor-
tic nerve, which then combines with the vagus
nerve (cranial nerve X) before traveling to the
nucleus tractus solitarius.
The arterial baroreceptors respond to the
stretching of the vessel walls produced by in-
creases in arterial blood pressure (Figure 6-6).
Increased arterial pressure increases the firing
rate of individual receptors and nerves. Each
individual receptor has its own threshold and
sensitivity to changes in pressure; therefore,
additional receptors are recruited as pressure
increases. Overall, the receptors of the carotid
sinus respond to pressures ranging from about
60–180 mm Hg. Therefore, if arterial blood
pressure decreases from normal, it lowers the
firing rate of the carotid sinus baroreceptors;
conversely, increased arterial pressure in-
creases receptor firing.
Baroreceptors are sensitive to the rate of
pressure change and to a steady or mean pres-
sure. At a given mean arterial pressure, de-
creasing the arterial pulse pressure decreases
firing rate. This is important during conditions
such as hemorrhagic shock in which pulse
pressure (as well as mean pressure) decreases
because of the decline in stroke volume
caused by decreased ventricular preload and
increased heart rate. Therefore, reduced
pulse pressure reinforces the baroreceptor re-
flex when mean arterial pressure falls. The
curve representing the frequency of barore-
ceptor firing in Figure 6-6 is the integrated re-
ceptor firing at a given pulse pressure. At re-
duce pulse pressures, the curve shifts to the
124 CHAPTER 6
L. Internal
Carotid
R. Internal
Carotid
R. External
Carotid
L. External
Carotid
Aortic Arch
Receptors
Carotid
Sinus
Receptors
Vagus Nerve
(Cranial Nerve X)
Glossopharyngeal Nerve
(Cranial Nerve IX)
Ascending
Aorta
Sinus Nerve
FIGURE 6-5 Location and innervation of arterial barore-
ceptors. Carotid sinus receptors are located on the in-
ternal carotid artery just above the junction with the ex-
ternal carotid artery. These receptors are innervated by
the sinus nerve of Hering, which joins the glossopha-
ryngeal nerve (cranial nerve IX) before traveling up to
the medulla. Afferent nerves from the aortic arch re-
ceptors join the vagus nerve (cranial nerve X), which
then travel to the medulla. R, right; L, left.
0
100 200
50
100
Mean Arterial Pressure
(mmHg)
Integrated
Receptor
Firing Rate
(% max)
Arterial Pressure Pulse
Receptor
Firing
Carotid Sinus
Mean
Maximal
Sensitivity
Reduce
Pulse
Pressure
Normal
Pulse
Pressure
FIGURE 6-6 Effects of arterial pressure on integrated carotid sinus firing rate. Left panel: The threshold for receptor
activation occurs at mean arterial pressures of about 60 mm Hg; maximal firing occurs at about 180 mm Hg. Maximal
receptor sensitivity occurs at normal mean arterial pressures. The receptor firing-response curve shifts to the right
with decreased pulse pressures; therefore, a decrease in pulse pressure at a given mean pressure decreases firing.
Right panel: Single receptor firing in response to pulsatile pressure. Receptors fire more rapidly when arterial pressure
is rapidly increasing during cardiac systole.
Ch06_117-140_Klabunde 4/21/04 11:26 AM Page 124
right, thereby decreasing the firing at any
given mean arterial pressure.
Maximal carotid sinus sensitivity (the point
of greatest slope of the response curve in
Figure 6-6) occurs near the “set point” of nor-
mal mean arterial pressures (approximately 95
mm Hg in adults). Therefore, small deviations
from this set point elicit large changes in
baroreceptor firing frequency. This set point,
and the entire receptor response curve, is not
fixed. Chronic shifts in this curve can occur
during hypertension, heart failure, and other
disease states. In hypertension, for example,
the curve shifts to the right, thereby reducing
the firing rate at any given mean arterial pres-
sure. This resetting of the baroreceptor re-
sponse can occur at the level of the receptors
themselves as well as in the brainstem. In ar-
teriosclerosis, the carotid arteries at the region
of the carotid sinus become less compliant,
and therefore they stretch less in response to
changes in arterial blood pressure—this de-
creases their sensitivity. During exercise,
medullary and hypothalamic control centers
can modulate autonomic efferent responses at
a given level of baroreceptor firing, thereby
resetting arterial pressure to a higher level.
Receptors located within the aortic arch
function similarly to carotid sinus receptors;
however, they have a higher threshold pres-
sure for firing and are less sensitive than the
carotid sinus receptors. Therefore, the aortic
arch baroreceptors serve as secondary barore-
ceptors, with the carotid sinus receptors nor-
mally being the dominant arterial barorecep-
tor.
To understand how the baroreceptor reflex
operates, consider the events that occur in re-
sponse to a decrease in arterial pressure
(mean, pulse, or both) when a person sud-
denly stands up (Figure 6-7). When upright
posture is suddenly assumed from the supine
position, gravity causes venous blood pooling
below the heart, particularly in the legs (see
Chapter 5). This decreases venous return,
central venous pressure, and ventricular pre-
load, leading to a fall in cardiac output and ar-
terial blood pressure. Decreased stretching of
baroreceptors results in decreased barorecep-
tor firing. The “cardiovascular center” within
the medulla responds by increasing sympa-
thetic outflow, which increases systemic vas-
cular resistance (vasoconstriction) and cardiac
output (increased heart rate and inotropy).
Decreased parasympathetic outflow from the
medulla contributes to the elevation in heart
rate.
Note that baroreceptor firing normally ex-
erts a tonic inhibitory influence on sympa-
thetic outflow from the medulla. Therefore,
hypotension and decreased baroreceptor fir-
ing disinhibits sympathetic outflow (i.e., it in-
creases sympathetic activity) from the
medullary centers. The combined effects on
systemic vascular resistance and cardiac out-
put increases arterial blood pressure back to-
ward its set point.
The carotid sinus reflex can be activated by
rubbing the neck over the carotid sinus (i.e.,
carotid sinus massage). This mechanical
stimulation of the receptors increases their fir-
ing, which leads to decreased sympathetic and
increased parasympathetic outflow from the
medulla. This action is sometimes used to
abort certain types of arrhythmias by activat-
ing the vagus efferents to the heart.
In addition to arterial baroreceptors,
stretch receptors are located at the venoatrial
junctions of the heart (cardiopulmonary re-
ceptors) and respond to atrial filling and con-
traction. These tonically active receptors are
NEUROHUMORAL CONTROL OF THE HEART AND CIRCULATION 125
CNS
SVR
C
O
Decreased
Arterial
Pressure
Decrease
d
Receptor
Firing
Sympathetic↑
Parasympathetic↓
+
+
+
+
FIGURE 6-7 Baroreceptor feedback loop. A sudden de-
crease in arterial pressure, as occurs when a person sud-
denly stands up from a supine position, decreases
baroreceptor firing, activating sympathetic nerves and
inhibiting parasympathetic (vagal) nerves. This change
in autonomic balance increases (ϩ) cardiac output (CO)
and systemic vascular resistance (SVR), which helps to
restore normal arterial pressure. CNS, central nervous
system.
Ch06_117-140_Klabunde 4/21/04 11:26 AM Page 125
128 CHAPTER 6
TABLE 6-2 REFLEXES AFFECTING THE HEART AND CIRCULATION THROUGH
CHANGES IN SYMPATHETIC AND PARASYMPATHETIC ACTIVITY
RECEPTOR RECEPTOR SYMPATHETIC PARASYMPA-
REFLEX TYPE LOCATION STIMULUS ACTIVITY THETIC ACTIVITY
Arterial
Baroreceptor
Bainbridge
Cardiac
Peripheral
Chemo-
receptor
Central
Chemo-
receptors
Cushing
Reflex
Cerebral
Ischemia
Bezold-
Jarisch
Reflex
Pain
Deep Pain
Vasovagal
Reflex
Pulmonary
Stretch
Reflex
Muscle and
Joint
Reflex
Diving
Reflex
Temperature
Reflex
Mechanoreceptors sense deformation or stretch; chemoreceptors respond to chemical stimuli; nociceptors respond
to pain caused by mechanical, thermal, or chemical stimuli; proprioceptors sense position and movement; and ther-
moreceptors respond to either cold or warm temperatures. The vasovagal reflex can be triggered by several differ-
ent stimuli such as pain or strong emotion.
1
Decreased parasympathetic activity to heart contributes to the increase
in heart rate seen when respiration is augmented. If respiration is held constant, parasympathetic activity is in-
creased, leading to bradycardia.
2
Brain ischemia caused by high intracranial pressure and reduced cerebral perfusion
stimulates chemoreceptors via increased hydrogen ion concentration.
3
Cardiac ischemic pain, as well as other origins
of pain, can trigger this reflex.
4
Deep pain arising from viscera and muscle elicits this reflex.
Mechano-
receptor
Mechano-
receptor
Mechano-
receptor
Chemo-
receptor
Chemo-
receptor
Chemo-
receptor
2
Chemo-
receptor
Chemo-
receptor
Nociceptor
Nociceptor
Various
Proprio-
ceptor
Proprio-
ceptor,
Chemo-
receptor
Thermo-
receptor
Thermo-
receptor
Internal
Carotids and
Aortic Arch
Venoatrial
Junctions
Atria and
Ventricles
Carotid and
Aortic
Bodies
Medulla
Brain
Brain
Ventricles
and coro-
nary arteries
Various
3
Various
4
Various
Airways,
Respiratory
Muscles
Muscles
Face
Skin, Hypo-
thalamus
Increased
Arterial
Pressure
Increased
Venous Return
Increased
Chamber
Pressure
Hypoxia,
Hypercapnia,
Acidosis
Hypercapnia,
Acidosis
Intracranial
Pressure
Ischemia
Chemical,
Ischemia
Pain
Pain
Strong
Emotion, Pain
Lung Inflation
Muscle
Movement
Water
Submersion
Increased &
Decreased
Temperature
Decreased
Increased
Decreased
Increased
Increased
Increased
Increased
Decreased
Increased
Decreased
Decreased
Decreased
Increased
Increased
Increased or
Decreased
Increased
Decreased
Increased
Decreased
1
Decreased
Increased
Decreased
Increased
Decreased
Increased
Increased
Decreased
Decreased
Increased
Insignificant
Ch06_117-140_Klabunde 4/21/04 11:26 AM Page 128
out the body. At times of high levels of sym-
pathetic nerve activation, the amount of nor-
epinephrine spilling over into the blood can
increase dramatically.
Circulating epinephrine has several direct
cardiovascular actions that depend upon the
relative distribution of adrenergic receptors in
different organs and the relative affinities of
the different receptors for epinephrine.
Epinephrine binds to 
1
, 
2
, ␣
1
, and ␣
2
adrenoceptors; however, the affinity of epi-
nephrine for -adrenoceptors is much greater
than for ␣-adrenoceptors. The relative recep-
tor affinities explain why, at low plasma con-
centrations, epinephrine binds preferentially
to -adrenoceptors. Therefore, at low to mod-
erate circulating levels of epinephrine, heart
rate, inotropy, and dromotropy are stimulated
(primarily 
1
-adrenoceptor mediated). Epi-
nephrine at low concentrations binds to 
2
-
adrenoceptors located on small arteries and
arterioles (particularly in skeletal muscle) and
causes vasodilation.
If a low dose of epinephrine is injected in-
travenously while systemic hemodynamics are
monitored, heart rate (and cardiac output)
will increase, systemic vascular resistance will
fall, but mean arterial pressure will change
very little (Fig. 6-8; Table 6-3). At high plasma
concentrations, the cardiovascular actions of
130 CHAPTER 6
FIGURE 6-8 Effects of intravenous administration of a low dose of epinephrine on arterial pressure and heart rate. A
low dose of epinephrine increases heart rate and arterial pulse pressure (it increases systolic and decreases diastolic
pressure) with little change in mean arterial pressure. These changes occur because low concentrations of epineph-
rine preferentially bind to cardiac 
1
-adrenoceptors (produces cardiac stimulation) and vascular 
2
-adrenoceptors
(produces systemic vasodilation). Mean pressure does not change very much because the increase in cardiac output
is offset by the decrease in systemic vascular resistance.
TABLE 6-3 DIRECT EFFECTS OF LOW PLASMA CONCENTRATIONS OF
EPINEPHRINE (EPI) AND NOREPINEPHRINE (NOREPI) ON CARDIAC
AND VASCULAR FUNCTION
EPI NOREPI
Cardiac
Heart Rate ϩϩ
1
Inotropy ϩϩ
Dromotropy ϩϩ
V
asculature
Resistance Ϫ/ϩ
2
ϩ
Capacitance ϪϪ
ϩ, increases; –, decreases.
1
Decreases heart rate in
vivo owing to baroreceptor reflexes.
2
Some vascular
beds constrict, whereas others dilate.
Ch06_117-140_Klabunde 4/21/04 11:26 AM Page 130