báo cáo khoa học: " Atomic Force Microscope nanolithography on chromosomes to generate single-cell genetic probes" doc
Bạn đang xem bản rút gọn của tài liệu. Xem và tải ngay bản đầy đủ của tài liệu tại đây (1.85 MB, 7 trang )
RESEA R C H Open Access
Atomic Force Microscope nanolithography on
chromosomes to generate single-cell genetic
probes
Sebastiano Di Bucchianico
1*
, Anna M Poma
1
, Maria F Giardi
1
, Luana Di Leandro
1
, Francesco Valle
2
, Fabio Biscarini
2
and Dario Botti
1
Abstract
Background: Chromosomal dissection provides a direct advance for isolating DNA from cytogenetically
recognizable region to generate genetic probes for fluorescence in situ hybridization, a technique that became
very common in cyto and molecular genetics research and diagnostics. Several reports describing microdissection
methods (glass needle or a laser beam) to obtain specific probes from metaphase chromosomes are available.
Several limitations are imposed by the traditional methods of dissection as the need for a large number of
chromosomes for the production of a probe. In addition, the conventional methods are not suitable for single
chromosome analysis, because of the relatively big size of the microneedles. Consequently new dissection
techniques are essential for advanced research on chromosomes at the nanoscale leve l.
Results: We report the use of Atomic Force Microscope (AFM) as a tool for nanomanipulation of single
chromosomes to generate individual cell specific genetic probes. Besides new methods towards a better
nanodissection, this work is focused on the combination of molecular and nanomanipulation techniques which
enable both nanodissection and amplification of chromosomal and chromatidic DNA. Cross-sectional analysis of
the dissected chromosomes reveals 20 nm and 40 nm deep cuts. Isolated single chromosomal regions can be
directly amplified and labeled by the Degenerate Oligonucleotide-Primed Polymerase Chain Reaction (DOP-PCR)
and subsequently hybridized to chromosomes and interphasic nuclei.
Conclusions: Atomic force microscope can be easily used to visualize and to manipulate biological material with
high resolution and accuracy. The fluorescence in situ hybridization (FISH) performed with the DOP-PCR products
as test probes has been tested succesfully in avian microchromosomes and interphasic nuclei. Chromosome
nanolithography, with a resolution beyond the resolution limit of light microscopy, cou ld be useful to the
construction of chromosome band libraries and to the molecular cytogenetic mapping related to the investigation
of genetic diseases.
Background
The co nventional approach to chromosomes micr odis-
section is based on the use of thin glass needles for the
collection of chromosomes and ch romosom al regions.
The number of copies of dissected chromosomes needed
for the generation of painting probes, varies from more
than 50 [1] to less than 10 [2]. A modified protocol
which reduces the copy nu mber of microdissected DNA
fragments has been developed by laser pressure cata-
pulting and amplification using linker-adaptor PCR [3].
Chromosome recognition is a prerequisite of this techni-
que so the chromosome microdissection method was
widely used in genomics research correlated to the G-
banding technique.
Since its development in 1986 by Binnig et al [4], the
AFM has played a crucial role in the nanoscale biomedi-
cal research [5,6]. The AFM is a microscopic system
that generates a surface topography by using attractive
and repulsive interaction forces between a sharp Si or
SiO2 tip attached to a cantilever and a sample. By
* Correspondence:
1
Department of Basic and Applied Biology, University of L’Aquila, Via Vetoio
1, L’Aquila 67100, Italy
Full list of author information is available at the end of the article
Di Bucchianico et al. Journal of Nanobiotechnology 2011, 9:27
/>© 2011 Di Bucchianico et al; licensee BioMed Central Ltd. This is an Open Access article distributed under the terms of the Creative
Commons Attribution License ( which permits unrestricted use, distribution, and
reproduction in any medium, provided the original work is properly cited.
approaching the cantilever to the sample, the interaction
forces can be measured and controlled; upon scanning
the surface it will thus be possible to record the topo-
graphy of the sample. This features allow the AFM to
work on unstained and uncoated chromosomes [7]. The
AFM imaging reveals that the chromosomes are not
uniform in structure but have, along their length, ridges
and grooves that may be related to the G-positive and
G-negative bands respectively [8,9]. In this way it is pos-
sible to recognize and manipulate chromosomal regions
without staining and coating.
Cytogenetic analysis of MDCC-MSB1, a chicken T-cell
line transformed with Marek’s Disease Virus (MDV), has
been performed with both classical methods and AFM
demonstrating a duplication of the short arm of chro-
mosome 1, (1p)(p22-p23) [10].
It must be underlined that th e chicken karyotype con-
sist of 39 chromosomes, 30 of which are classed as
microchromosomes (MICs) and are cytologically impos-
sible to differentiate from each other because of their
small size [11]. For this reason it is interesting to use
the AFM as a tool to manipulate chromosomes and to
generate probes for fluorescence in situ hybridization
(FISH), confirming the duplication of chromosome 1
and making the microchromosomes univocally recogniz-
able. The generation of chromosomal painting probes
from a single unstained chromosome or a single chro-
mosomal region can be helpful in studies focusing on
comparative genomics and genomic organization, as
well as in clinic al diagnostic of mosaicisms or in hetero-
geneous cell populations.
Here, we describe the production of specific painting
probes from a single avian microchromosome and a sin-
gle chromosomal region using the AFM. When an
increasing force is applied to the microscope tip, a
nanosize chromosomal region can be dissected away,
collecting DNA fragment adherent to the tip. We intro-
duce nanolithography on chromosomes surface where
contiguous line patterns can be generated by a software-
controlled pattern generator built in the AFM control-
ler. Controlling the lithography software the tip can be
moved with a specified speed along the precise scanning
lines. The nanodissected DNA can be amplified through
DOP-PCR [12].
Results
In the scanning on the whole metaphase plate the chro-
mosome object of nanolitographic dissection has been
identified. AFM imaging allows the identification of a
pattern of banding as well as a fibrous structure (with
diameter of around 50 nm). Structural protrusions along
the chromosome correspond to the “G-positive” bands
thus making the region to be dissected recognizable with
a topographical banding [10]. The band (1p)(p22-p23),
that results duplicated in one of the two homologous
chromosomes, has been selected in the unduplicated
homologue to be dissected in order to produce a probe
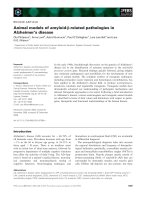
for the FISH. The chromatid band cht del(3)(q2.10) that
results deleted in both chromosomes has been selected
to be dissect ed (Figure 1) and the prob e generated. The
aim was to show the duplication with molecular methods
and to confirm the ability to identifyasinglechromatid
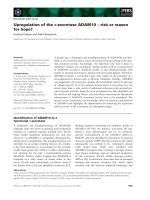
band with the topographical banding. A microchromo-
some has been likewise selected in order to show its uni-
vocal recognizability with hybridization molecular
methods, given the non univocal recognizability with tra-
ditional cytogenetic methods (Figure 2). Here, we show
that DOP-PCR can be applied to a single unstained chro-
mosome or a single chromosomal region without topoi-
somerase treatment normally used in the experiments of
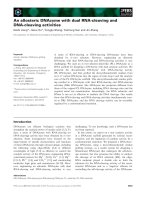
chromatin dissection. The results of the DOP PCR per-
formed with the nanodissected chromosome 1, the single
nanodissected chromatid of chromosome 3 and the sin-
gle microchromosomes nanodissections were examined
in 1% agarose gel electrophoresis and show a banding
pattern between 200 and 600 bp (Figure 3). The template
DNA concentration was comprised from 1 mg/ml and
1.5 mg/ml with 260/280 absorbance of 1.7-1.9. The
amplified DNA concentrations were determined by
quantitative agarose gel electrophoresis and spectropho-
tometric analysis: for all the samples, the concentrations
obtained after DOP PCR were no proportional to the dif-
ferent forces applied (5-10 μN) for the dissections, indi-
cating that the increase in the depth of the dissection and
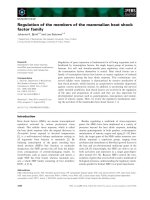
Figure 1 Topographic AFM micrograph of chromosomes 3
after DNA extraction. Upon localization of the chromosome
region to be dissected the AFM microscope is switched in Contact
Nanolithography Mode and the probe is scanned at high force (5-
10 μN) several time for few lines (up to 8) perpendicularly to the
chromatide. The cross sectional analysis of the cut site reveals a full
width at half-maximum height of around 50 nm.
Di Bucchianico et al. Journal of Nanobiotechnology 2011, 9:27
/>Page 2 of 7
so in the quantity of the extracted DNA do not affect the
quantity of the amplified product.
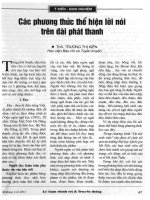
The band specific probe of duplication (1p)(p22-p23)
is generated with Biotin-11-dUTP and applied to inter-
phase nuclei (Figure 4). The fluorescent signals were as
bright and clear as commercial probes. The probe of
single nanodissected chromatid of chromosome 3 is
hybridized in interphase nuclei in two distinct spots.
In Figure 5 FISH using DOP-PCR products of the
nanodissected microchromosomes is shown. By DOP-
PCR of single nanodissected chicken MICs, we have
generated a chromosome painting probe (Figure 5). We
apply FISH technology as a rapid method for detection
of MICs aneuploidy (Figure 6). The presence of dual sig-
nals in the nuclei and the single spot in metaphase is
explained as somatic mosaicism. About 40% of interpha-
sic nuclei and/or metaphase scored shows aneuploidy.
Figure 2 Topographic AFM micrograph of microchromosome.
Microchromosome before and after (insert) DNA extraction. The
cross sectional analysis of the cut site reveals a full width at half-
maximum height of around 40 nm.
Figure 3 DOP P CR results of the nanodissected chromosome.
The nanodissected chromosome 1 (lanes 7 and 8), the single
nanodissected chromatid of chromosome 3 (lanes 4, 5, 6) and the
single microchromosomes nanodissections (lanes 2 and 3) were
examined in 1% agarose gel electrophoresis and show a banding
pattern between 200 and 600 bp. In lane 1, PCR reaction with no
added DNA and in lane 9 the positive control (1 μg/μL Cot-1 DNA).
Figure 4 FISH using DOP-PCR products. FISH using DOP-PCR
products of the nanodissected duplication (1p)(p22-p23).
Hybridization of the biotinylated probe DNA is detected with FITC-
avidin (green signals). Chromosomes are counterstained with DAPI
(blue). The tree signals show that the band (1p)(p22-p23) results
duplicated in one of the two homologous chromosomes.
Figure 5 FISH using DOP-PCR products. FISH using DOP-PCR
products of the nanodissected microchromosome. Hybridization of
the biotinylated probe DNA is detected with FITC-avidin (green
signals). Chromosomes are counterstained with DAPI (blue). By
DOP-PCR of single nanodissected chicken microchromosome, we
have generated a chromosome painting probe.
Di Bucchianico et al. Journal of Nanobiotechnology 2011, 9:27
/>Page 3 of 7
The l evel of somatic mosaicism dire ctly contributes to
carcinogenesis by interfering with the normal division of
cells.
Conventional fluorescence mic roscope make it possi-
ble to observe several Kbp DNA probes in metaphase
anditremainsimpossibleto observe probes having
length shorter than 1 Kbp without several stages of sig-
nal amplification. Our probes have a length between 200
and 600 bp. The related fluorescent signal in metaphase
is identifiable, with a conventional fluorescence micro-
scope, only for MICs characterized by repeated
sequences that allowed repeated hybridization of our
probes, thus overcoming the resolution limits of conven-
tional microscopy. The probes hybridization obtained
from chromosome 1 and chromatid regions of chromo-
some 3 is confirmed by the fluorescent signal in inter-
phasic nuclei where t he DNA appears in a more loose
form which allows the visualization by mean of conven-
tional fluorescence microscopes.
Discussion
This work shows clearly that DNA can be mechanically
extracted by the AFM for subsequent use in molecular
cytogenetics. To date, various investigators have applied
the AFM to the dissection o f chromosomes at different
regions [13]. We introdu ce nanolithography on chromo-
somes surface. In our laboratory we have reduced the
17 μN applied force for the achievement of hybridiza-
tion probes used in Iwabuchi’ sworkandco-authors
[14], until 5 μN, minimum value successfully used by
us. The applied forces are comparable to those used by
Oberringer and co-workers [15]. In addition we have
remarkably reduced the size of the dissected fragment
from 1 μm obtained by Yamanaka and co-authors [16]
reaching a length of 400 nm.
Our experiments have clearly shown that dissected
DNA can subsequently be used as material for PCR
ampli fication and labeling to generate single-cell genetic
probe for FISH analy sis. By means of a conventional
fluorescence microscope it is possible to observe DNA
probes in metaphase having a length of several K bp and
it remains impossible to observe probes having length
inferior to 1 Kbp without several stages of signal ampli-
fication. Our probes have a length from 200 and 600 bp.
The hybridization obtained by mean of the chromosome
1 and chromatid regions of chromosome 3 generated
probes is confirmed by the fluorescent signal in i nter-
phasic nucle i where the DNA appears in a more looser
form which allows the visualization by mean of conven-
tional fluorescence microscopes. As demonstrated by
Oberringer and co-workers, Scanning Near-field Optical
Microscope (SNOM) is present ly necessary for the opti-
cal visualization of probes with dimensions comparable
to those obtained by us [15].
Moreover, AFM and other new technologies such as
SNOM, may allow in the future more exhaustive exami-
nations of metaphase chromosomes and associations
between chromosomal aberrations and diseases at a
nanoscale level. SNOM/AFM, in fact, can simulta-
neously obtain topograph ic and fluorescent images with
nanometer-scale resolution. The application of AFM can
be a useful horizons for human cytogenetic studies such
as in cases of recombination at low copy repeats result-
ing in tiny deletion/duplication of DNA (Prader-Willi
and Angelman syndromes or Charcot-Marie-Tooth dis-
ease). A further limitation of classical cytogenetic and
largely molecular techniques is the lack of capacity to
asses clinically important characteristics of the target
cells. In patient with multiple myeloma, for example,
routine FISH assessment may yield normal results
owing to the low percentage of diseased plasma cells.
Thus, a method to generate single-cell genetic probes is
needed in this type of study.
Many advantages are attributable to the use of AFM
techniques. These include the high sensibility, the short
time required for the application and the low quantity
of manipulation or chemical treatments that can affect
the structure of chromosomes. Finally it can not be
undervalued the low cost of the application in compari-
son t o traditional techniques. Recent advances in AFM
technology have improved the resolution using a liquid
environment. It will be interesting to continue our stu-
dies using these new opportunities in conditions close
to chromosome physiological state.
Figure 6 FISH using DOP-PCR products. FISH using DOP-PCR
products of the nanodissected microchromosome. Hybridization of
the biotinylated probe DNA is detected with FITC-avidin (green
signals). Chromosomes and nuclei are counterstained with DAPI
(blue). We apply FISH technology as a rapid method for detection
of MICs aneuploidy as is clear from the only signal in metaphase.
Di Bucchianico et al. Journal of Nanobiotechnology 2011, 9:27
/>Page 4 of 7
Conclusions
This work demonstrates how it is possible to generate
geneticprobesforasinglespecificcellstartingfroma
small region of chromosome or chroma tid dissected by
an AFM tip. We have thus achieved a real metaphase
chromosome nanolitography. T his strategy opens the
way for new applications in research and diagnostic
cytogenetics, evolutionary studies or physical mapping
of the g enome. Small amounts of DNA from specific
and recognizable sites can be amplified and biotinylated
using standard molecular biology techniques to be
hybridized to metaphase plates and interphase nuclei.
Implementing this method using scanning near field
optical microscopy for fluorescence imaging, can defi-
nitely improve the resolution presently limited by optical
microscopy thus achieving the study of specific genomic
region labeled with only few dye molecules.
Methods
Cell culture and chromosome suspension preparation
MDCC-MSB1 cells were cultured in RPMI medium,
supplemented with 10% heat-inactivated foetal calf
serum (FCS), 100 μg/ml penicillin, 100 μg/ml strepto-
mycinat37°Cin5%CO
2
. The reagents for cell culture
were purchased from Laboratoires Eurobio (France). For
chromosome suspension preparation during the loga-
rithmic growth phase, Colchicine (Sigma, final concen-
tration of 0.05 μg/ml) was added to the cultures that
were then mixed gently and incubated at 37°C for 3 h
prior to experiments. The cells were collected, centri-
fuged for 10 min at 1200 rpm, and the supernatant dis-
carded. The pellet was gently o verlain with 10 ml of
phosphate buffer solution (PBS, pH 7.4) three times and
subjected to hypotonic treatment (0.45% sodium citrate)
for 10 min before being fixed dropwise in 10 ml cold
freshly made fixative, metha nol/acetic acid (3:1). The
chromosome suspension was then stored in fixative at
4°C for at least 12 h.
Slide preparation and topographic banding
The chromosome suspension was centrifuged at 1200
rpm for 10 min, the supernatant discarded, and the pel-
let was resuspended in c old freshly made fixative again
to see it cleaned up. The last pellet was resuspended in
0.8/1.0 m l of fixative. Chromosomes were spread on a
frosted microscope slide previously washed in fixative
diluted in w ater and put at -20°C in distilled water for
at least 1 h. Slides were checked under a phase- contrast
microscope to ensure that the cell density was correct,
and that there were sufficient w ell-spread, cytoplasm-
free mitoses. The slides were finally air-dried. For GTG
Banding (Giemsa banding after Trypsin treatment), after
aging for three days, slides were placed in 0.1% trypsin
solution for 20 seconds, rinsed with 70% ethanol,
washed with water and stained in 5% Giemsa’ssolution
in pH 6.8 PBS.
For topographic banding with the AFM, the slides were
washed in 2 × SSC (0.15 M NaCl, 0.015 M sodium Citrate)
for 10 min. Chromosomes were treated with RNase A
(Boehringer) stock solution (20 mg/ml) diluted 1:200 in 2
× SSC and incubated for 40 min at 37°C. The slides were
then washed in 2 × SSC for 5 min three times, shaking at
room temperature. For protein digestion 10 μlofPepsin
(Sigma, 100 mg/ml) were added to 100 ml of 0.01 M HCl.
The slides were incubated in pepsin solution for 5 min at
37°C and washed in pH 7.4 PBS buffer for 10 min at room
temperature. Finally, the slides were dehydrated in an alco-
hol series (30-50-70-90-99% of Ethanol) prior to AFM
analysis (NT-MDT SMENA on Olympus IX71 Inverted
Fluorescence Microscope). To identify the Topographic
Bands, several cross-line profiles through the long axis of
the chromosomes were measured and compared to the
GTG profiles. Th e ridges of the chromosomes cross-line
profiles were associated with the GTG+ bands and the
grooves with the GTG- bands.
Atomic Force Microscopy Nanolithography
The nanodissection experim ents were carried on b y a
Smena AFM (NT-MDT, Zelenograd, Russia) operated
both in intermittent contact and in contact mode. The
cantilever used were NSG10 (NT-MDT, Zelenograd,
Russia), with a resonance frequency of 140-390 KHz
and a nominal s pring constant of 37.6 N/m. The AFM
used for these experiments is coupled with an inverted
optical microscope Olympus IX70 (Olympus, Japan) that
allows finding the proper metaphase nuclei and to posi-
tion the cantilever on the chromosomes that compose
it. Intermittent contact imaging allows identitying all the
chromosomes in the chosen me taphase and locating the
proper heterochromatin/euchromatin regions, identified
by topographic banding, to perform the nanodissection
experiments. Upon localization of the chromosome
region to be dissected the AFM microscope is switched
in Contact Nanolithography Mode and the probe is
scannedathighforce(5-10μN) several times (4 to 6)
for few lines (up to 8) perpendicularly to the chroma-
tide, th is procedure allows the tip to remove the portion
of chromatine corresponding to the scanned lines. The
cantilever is then lifted immediatly and stored in the
recovery buffer for the further DNA amplification. To
verify the lithographic dissection, imaging is performed
on the same chromosome that underwent the procedure
to see the effective missing portion.
Degenerate Oligonucleotide-primed Polymerase Chain
Reaction (DOP-PCR)
DOP-PCR of nanodissected chromosomes was per-
formed in a MyCycler ™ Thermal Cycler (BIORAD
Di Bucchianico et al. Journal of Nanobiotechnology 2011, 9:27
/>Page 5 of 7
Laboratoires, USA). The premixed double concentrated
DOP-PCR master mix contains 3 U AccuSure DNA
Polymerase (Bioli ne USA Inc.) in 120 mM Tris-HCl, 60
mM (NH
4
)
2
SO
4
,20mMKCl,4mMMgSO
4
,pH8.3,
MgCl
2
3 mM, Brij 35 (Sigma) 0.02% (v/v), dNTPs 0.4
mM. The DOP-PCR react ions was directly performed in
the sterile tubes containing the dissected chromosome
fragments adhered to the AFM tip in Tris-HCl 40 mM
pH 8.3, MgCl
2
20 mM, NaCl 50 mM. In every tube
were added 2 μM6MWprimer(5’CCGACTC-
GAGNNNNNNATGTGG3’ ,MWGEurofinsOperon,
Germany), the DOP-PCR master mix and sterile water
to a final volume of 50 μl. Primary amplification was
performed with the following cycling parameters: initial
denaturation at 95°C for 5 min, 5 low stringency cycles
of 94°C for 1 min, 30°C for 1.5 min, 3 min transition of
30°to 72°C and 72°C for 3 min, followed b y 35 high
stringency cycles of 94°C for 1 min, 62°C for 1 min, 72°
C for 1 min and a final extension of 7 min at 72°C. The
PCR products were analyzed by electrophoretic separa-
tion on 1% agarose gel. 5 μl of the primary PCR pro-
ducts were labeled with Biotin-11-dUTP ( Fermentas) in
a secondary PCR rea ction. The 50 μl labelling reaction
contained 1.25 U Taq DNA Polymerase (Fermentas) in
10 mM Tris-HCl pH 8.8, 50 mM KCl, 0.08% Nonidet
P40, 2 mM MgCl
2
, 0.2 mM dATP, dCTP and dGTP,
100 μMdTTPand80μM Biotin-11-dUTP (Fermentas).
Cycling parameters were: initial denaturation at 94°C for
3 min, 20 cycles of 94°C for 1 min, 56°for 1 min, 72°for
30 sec and final extension for 3 min. Labeled products
were recovered by ethanol precipitation and 500 ng of
biotinylated products with 100 fold excess of Chicken
Cot-1 DNA were resuspended in hybridization solution
(50% deionized formamide, 2X SSC, 10% dextran
sulfate).
Chicken Cot-1 DNA and Probe preparation
Chicken Cot-1 DNA (not commercially available) is the
repetitive sequ ence of Chicken genomic DNA used as a
competitor to inhibit hybridization of repeats present
within DNA probes. Total genomic DNA was isolated
and boiled for 90 min to o btain fragments size of 300-
600 bp. The fragmented DNA (1 mg/ml) was denatured
in 0.3 M NaCl at 95°C for 10 min and then allowed to
reanneal at 65°C for 6 min. An equal volume of ice-cold
2× S1 nuclease buffer and S1 nuclease (Fermentas) was
added and incubated at 37°C for 30 min. An equal
volume of 25:24:1 phenol:chloroform:isoamyl alcohol
was added and mixed well inverting the tube for 10-15
times and then centrifuged for 10 min at 5000 rpm at
room temperature. The supernatant was transferred into
a new tube and a equal volume of chloroform was
added, mixed well and centrifuged for 10 min at 5000
rpm at RT. The supern atant was transferred into a new
tube and 1/12
th
volume of 3 M NaCl was added , mixed
well, and 2.5 volume of 100% ethanol was then added
and incubated at -20°C overnight. The tube was centri-
fuged at 5000 rpm for 30 min and the pellet wash whit
70% of ethan ol, air-dried and resuspe nded in dist illed
water. The Cot-1 DNA were analyzed by electrophoretic
separation on 1% agarose gel and concentration adjusted
to 1 μg/μl. The DOP-PCR labelled probes were dis-
solved in 50% formamide, 10% dextran sulphate and 2 ×
SSC to a final concentration of 50 ng/μl with a 100 fo ld
excess of chicken Cot-1 DNA.
Fluorescence in situ hybridization (FISH)
The slide-mounted cells were placed for 2 min in a
denaturing solution (70% deionized formamide/2 × SSC,
pH 7.0) a t 70°C in a Coplin jar and then rinsed for 2
min in ice-cold 70% ethanol t o stop the denaturation.
The dehydration was continued by incubating slide for 2
min each at room temperature in 80-95-100% ethanol.
The slides were finally air-dried. 20 μLofhybridization
solution is denatured at 75°C for 5 min, applied to slide
and covered with a 22-mm
2
coverslip. Hybridization was
at 37°C overnight in a moist chamber. Slides were
washed in 50 ml of 50% formamide/2 × SSC at 39°C for
15min,2×SSCat39°Cfor15min,1×SSCatroom
temperature for 5 min and allow ed to equilibrate 5 min
in 4 × SSC at room temperature. 50 μL of biotin detec-
tion solution (Avidin-FITC, Vector Laboratories) was
applied and incubated 45 min in a aluminium foil-
wrapped moist chamber at 37°C. The slides were
sequentially soak in aluminium foil wrapp ed Copli n jars
containing room temperature 4 × SSC, 0.1% Triton X-
100/4 × SSC, and 4 × SSC 10 min in each solution. The
slide was coun terstained with DAPI (4,6 -diamidino-2-
phenylindole dihydrochloride). FISH signals were cap-
tured by a Z eiss Axioplan 2 fluorescence microscope
with epi-illumination and filter set appropriate for the
fluorochrome used.
Acknowledgements
The work was supported by 2010 RIA grants of University of L’Aquila to A.
Poma, D. Botti and EU project BIODOT (Sensing BIOsystems and their
Dynamics in fluids with Organic Transistors) supported by the Sixth
European Research Framework Programme under contract NMP4-CT-2006-
032352 at the ISMN-CNR, Bologna.
Author details
1
Department of Basic and Applied Biology, University of L’Aquila, Via Vetoio
1, L’Aquila 67100, Italy.
2
Institute for Nanostructured Materials, Consiglio
Nazionale delle Ricerche ISMN-CNR, Via P. Gobetti 101, Bologna 40129, Italy.
Authors’ contributions
SDB has made substantial contributions to conception and design,
acquisition, collection, analysis, and interpretation of data; has drafted the
manuscript. MFG has prepared cells, LDL has performed the DOP-PCR
experiments, FV has made substantial contributions for the use of Atomic
Force Microscope. FB supported in the AFM experiments and in the critical
revision. AP and DB were been involved in drafting and revising the
Di Bucchianico et al. Journal of Nanobiotechnology 2011, 9:27
/>Page 6 of 7
manuscript critically for important intellectual content. All authors read and
approved the final manuscript.
Competing interests
The authors declare that they have no competing interests.
Received: 12 April 2011 Accepted: 28 June 2011
Published: 28 June 2011
References
1. Meltzer PS, Guan XY, Burgess A, Trent JM: Rapid generation of region
specific probes by chromosome microdissection and their application.
Nature genetics 1992, 1:24-28.
2. Höckner M, Erdel M, Spreiz A, Utermann G, Kotzot D: Whole Genome
Amplification from Microdissected Chromosomes. Cytogenet. Genome
Research 2009, 125:98-102.
3. Thalhammer S, Langer S, Speicher MR, Heckl WH, Geigl B: Generation of
chromosome painting probes from single chromosomes by laser
microdissection and linker-adaptor PCR. Chromosome Research 2004,
12:337-343.
4. Binnig G, Quate CF, Gerber C: Atomic Force Microscope. Physical Review
Letters 1986, 56:930-933.
5. Zurla C, Samuely T, Bertoni G, Valle F, Dietler G, Finzi L, Dunlap DD:
Integration host factor alters LacI-induced DNA looping. Biophysical
Chemistry 2007, 128:245-252.
6. Valle F, DeRose JA, Dietler G, Kawe M, Plückthun A, Semenza G: AFM
structural study of the molecular chaperone GroEL and its two-
dimensional crystals: an ideal “living” calibration sample. Ultramicroscopy
2002, 93:83-9.
7. Di Bucchianico S, Venora G, Lucretti S, Limongi T, Palladino L, Poma A:
Saponaria officinalis karyology and karyotype by means of Image
Analyzer and Atomic Force Microscopy. Microscopy Research and
Technique 2008, 71:730-736.
8. Tamayo J: Structure of human chromosomes studied by atomic force
microscopy Part II. Relationship between structure and cytogenetic
bands. Journal of Structural Biology 2003, 141:189-197.
9. Ushiki T, Hoshi O: Atomic force microscopy for imaging human
metaphase chromosomes. Chromosome Research 2008, 16:383-396.
10. Di Bucchianico S, Giardi MF, De Marco P, Ottaviano L, Botti D: Cytogenetic
stability of chicken T-cell line transformed with Marek’s disease virus:
atomic force microscope, a new tool for investigation. Journal of
Molecular Recognition 2011, 24:608-618.
11. Burt DW: Origin and evolution of avian microchromosomes. Cytogenetic
Genome Research 2002, 96:97-112.
12. Telenius H, Carter NP, Bebb CE, Nordenskjold M, Ponder BA, Tunnacliffe A:
Degenerate oligonucleotide-primed PCR: General amplification of target
DNA by a single degenerate primer. Genomics 1992, 13:718-725.
13. Iwabuchii S, Mori T, Ogawa K, Sato K, Saito M, Morita Y, Ushiki T, Tamiya E:
Atomic force microscope-based dissection of human metaphase
chromosomes and high resolution imaging by carbon nano tube tip.
Archives of Histolology and Cytology 2002, 65:473-479.
14. Iwabuchi S, Muramatsu H, Chiba N, Kinjo Y, Murakami Y, Sakaguchi T,
Yokoyama K, Tamiya E: Simultaneous detection of near-field topographic
and fluorescence images of human chromosomes via scanning near-
field optical/atomic-force microscopy (SNOAM). Nucleic Acids Research
1997, 25:1662-1663.
15. Oberringer M, Englisch A, Heinz B, Gao H, Martin T, Hartmann U: Atomic
force microscopy and scanning near-field optical microscopy studies on
the characterization of human metaphase chromosomes. Eur Biophys J
2003, 32:620-627.
16. Yamanaka K, Saito M, Shichiri M, Sugiyama S, Takamura Y, Hashiguchi G,
Tamiya E: AFM picking-up manipulation of the metaphase chromosome
fragment by using the tweezers-type probe. Ultramicroscopy 2008,
108:847-854.
doi:10.1186/1477-3155-9-27
Cite this article as: Di Bucchianico et al.: Atomic Force Microscope
nanolithography on chromosomes to generate single-cell genetic
probes. Journal of Nanobiotechnology 2011 9:27.
Submit your next manuscript to BioMed Central
and take full advantage of:
• Convenient online submission
• Thorough peer review
• No space constraints or color figure charges
• Immediate publication on acceptance
• Inclusion in PubMed, CAS, Scopus and Google Scholar
• Research which is freely available for redistribution
Submit your manuscript at
www.biomedcentral.com/submit
Di Bucchianico et al. Journal of Nanobiotechnology 2011, 9:27
/>Page 7 of 7